GLTR - The S&P 500 Needs To Hold This Key Level - Otherwise It's Time To Batten Down The Hatches (Technical Analysis)
2023-11-03 10:52:51 ET
Summary
- The S&P 500 is at a key support level as we enter the best month of the year.
- Breadth continues to weaken, creating the potential for significant further weakness in the indexes if support fails to hold.
- Gold and Bitcoin are alternative investment options to consider if the S&P 500 enters a protracted downtrend.
The S&P 500 ( SPX ) is at support within a year-long uptrend as we enter the most bullish month for stock returns. We're bullish on stocks and looking for things to buy.
But only if key support near 4150 continues to hold. If it doesn't, we need to be looking to put our money somewhere else.
Why so optimistic?
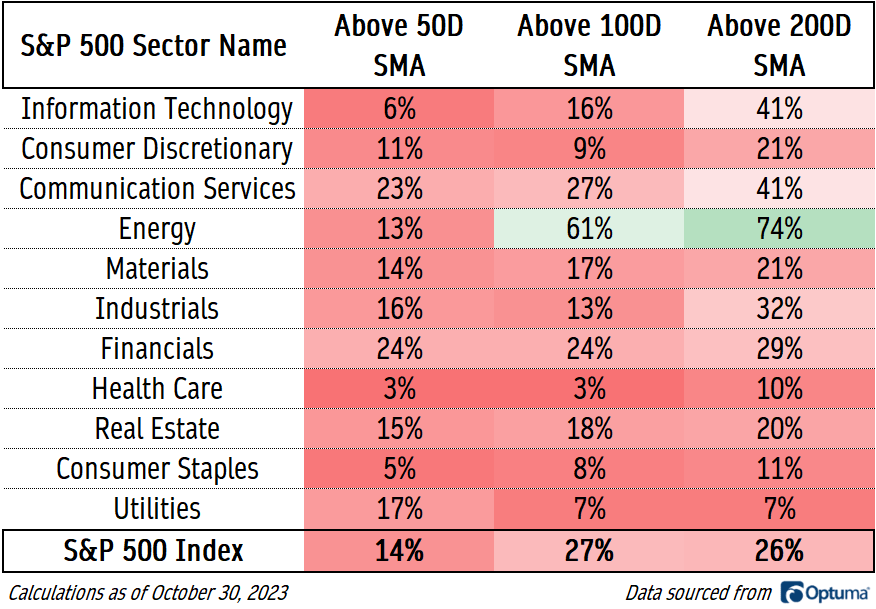
Don't get us wrong, there are plenty of reasons to be bearish right now. For one, breadth continues to weaken. Just 1/4 of stocks in the S&P 500 Index are above their 200-day moving average, and even fewer are above their 50-day. Only one sector is showing positive moving average breadth characteristics, and that's Energy. Yet Energy's performance has more to do with the trajectory of oil prices than risk appetite in equities, so it's tough to get too excited about the underlying strength we see there.
That weakness in breadth is confirmed when we look at the Value Line Geometric Index. This index tracks price changes in the median stock, and over the past few weeks, it's dropped to new 52-week lows.
Created by author with data from Optuma
The Value Line index hasn't quite reached the bear market lows it set last September, but plenty of individual stocks have. The number of issues setting new highs on the NYSE minus the ones setting new lows has been in negative territory since August, and the measure is still trending lower.
Created by author with data from Optuma
Leading on the downside are the small caps. The iShares Russell 2000 ETF ( IWM ) lagged all throughout the first half of the year when equity prices were rising, and now it's threatening to break to multi-year lows.
Created by author with data from Optuma
The damage is even more pronounced in the smallest of the small stocks. The micro-caps, iShares Micro-Cap ETF ( IWC ), fell below their pre-COVID highs at the outset of October and have continued to sell off. One question we have to ask ourselves when assessing whether we're in a bear market is, " Who's going to lead us lower?" . This chart provides our answer.
Created by author with data from Optuma
What's the bull case?
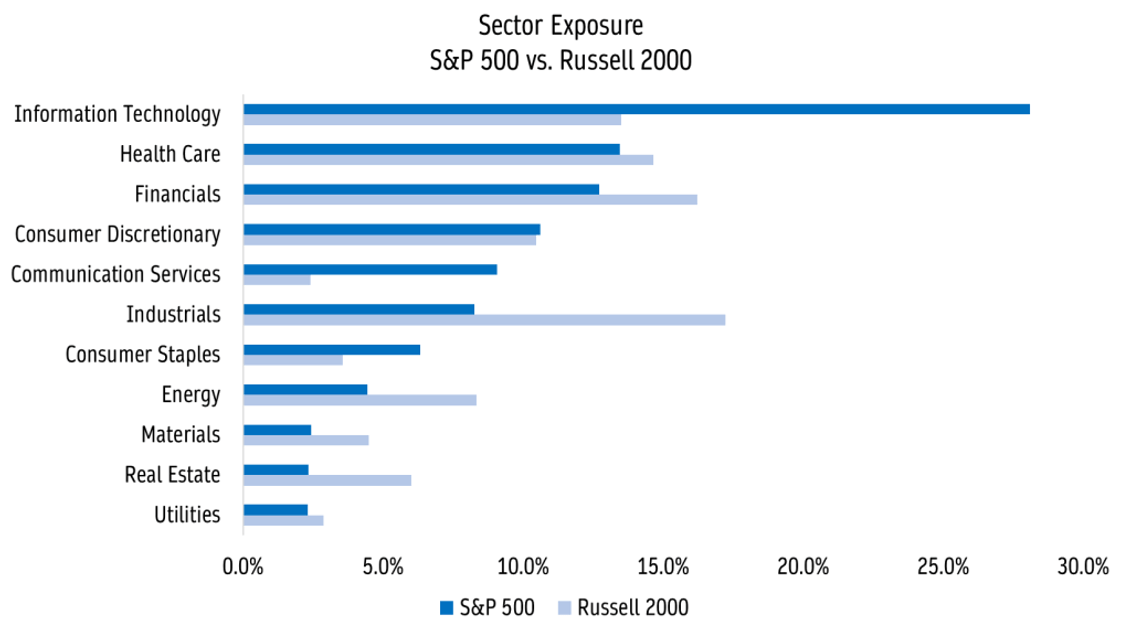
The measures above clearly show that the S&P 500's 9% year-to-date gain is not widely distributed. But the weakness in breadth that we discussed above has a lot to do with sector exposure. The large cap rally this year has been dominated by growth sectors like Information Technology and Communication Services, each of which has risen more than 30% in 2023.
Incidentally, indexes like the Russell 2000 are massively underweight those two groups and have increased exposure to the year's two weakest sectors, Real Estate and Utilities.
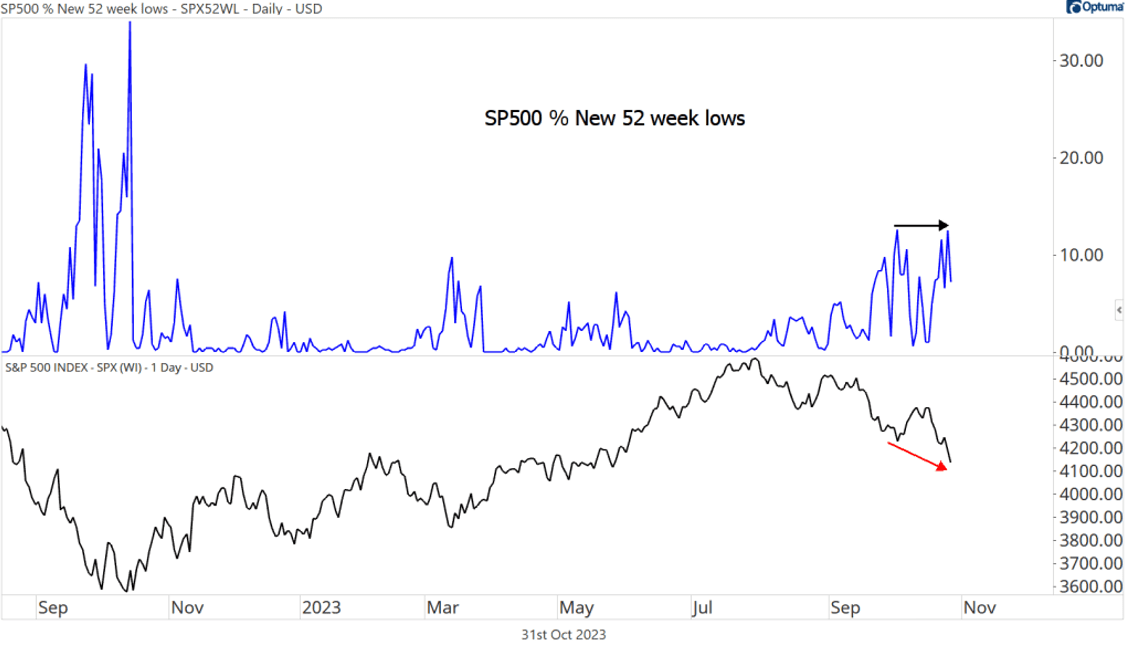
And thanks to that differentiated sector exposure, the list of new lows in the S&P 500 actually peaked a month ago, even though the index has continued to drift lower. These types of divergences often lead to price reversals.
Additionally, we're about to enter the single best month for stocks. Stocks have sold off in October despite the seasonal tailwind, which serves as a reminder that prices don't have to follow seasonal patterns. But that doesn't mean we have to ignore these historical trends entirely. In November, stocks have gained an average of 1.7% since 1950.
Created by author with data from Optuma
A rally from the October lows would be starting from an important area of support, too. This 4150 level for the S&P 500 has been our line in the sand for months, and we see no reason to change that now. That was a significant area of resistance in the spring, and it also happens to be the 161.8% retracement from the COVID selloff.
Our base case continues to be that this is a consolidation within an ongoing uptrend. We want to be buying stocks.
Created by author with data from Optuma
However, there's a reason we have these levels. We will know when our base case is no longer intact.
If the S&P 500 is below the spring highs, there's no reason to be approaching this market from a bullish perspective. On a sustained break, we won't be looking to buy every upside breakout we see. We're going to start looking for short opportunities instead, or look for setups in other asset classes because the weight of the evidence will have shifted toward an extended bear market instead.
An extended bear market would be starting from pretty logical levels. The area near 4500 is the 423.6% Fibonacci retracement from the entire 2007-2009 decline. The market has respected these levels over the last 10 years, so we should, too. The next leg of this long-term uptrend can't begin until we've absorbed all the overhead supply from this major resistance zone.
Created by author with data from Optuma
Where do we hide?
Where can we put our money if the S&P 500 enters a protracted downtrend?
We're keeping an eye on Gold ( XAUUSD:CUR ). While stocks have been drifting toward their lows, gold has been drifting towards its highs. This is a big, messy consolidation that we want no part of until we see a resolution, but if that resolution comes, we don't want to be left behind.
Created by author with data from Optuma
How high could gold go on a breakout? We're eying $3200. That's the 1794% Fibonacci retracement from the 1990s decline. Prices have respected these retracement levels all the way up: The hiccups in 2006 and 2008 occurred near Fib levels, the ceiling from 2013-2019 was the 684.4% retracement, and right now, we're stuck below the 1109% retracement. It would make a lot of sense to go up and touch the next one. $3200 might even be a conservative expectation - prices rallied a lot more after the 2004 breakout.
Created by author with data from Optuma
Bitcoin USD ( BTC-USD ) has caught our eye, too. It just broke out to its highest level in more than a year, following a length consolidation between 25,000 and 30,000. Our initial target there is 45,000. That's the 261.8% retracement from the 2017-2018 decline.
Created by author with data from Optuma
In summary, we still think this is a time to be buying stocks. But if the S&P 500 falls below the spring highs, we'd rather put our money somewhere else.
For further details see:
The S&P 500 Needs To Hold This Key Level - Otherwise It's Time To Batten Down The Hatches (Technical Analysis)