RITA - The State Of REITs: April 2023 Edition
2023-04-17 11:48:47 ET
Summary
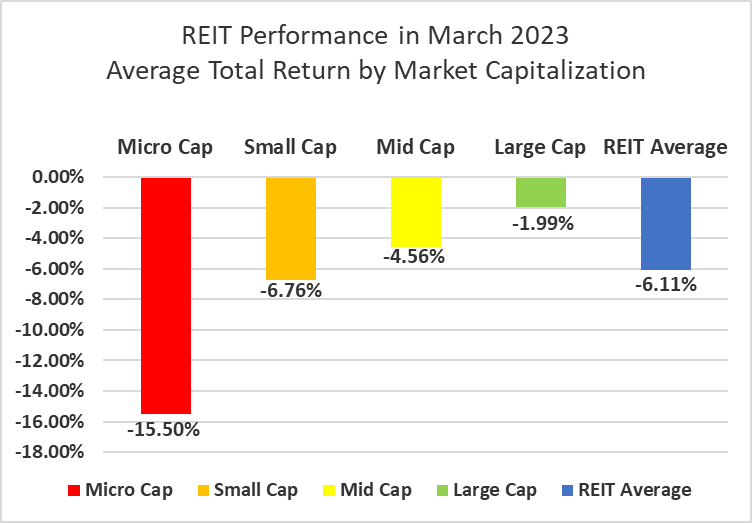
- The REIT sector fell again in March with a -6.11% total return.
- Large cap (-1.99%) and mid cap (-4.56%) REITs saw modestly negative total returns in March, while small caps (-6.76%) and micro caps (-15.50%) were deeper in the red.
- Only 21.25% of REIT securities had a positive total return in March.
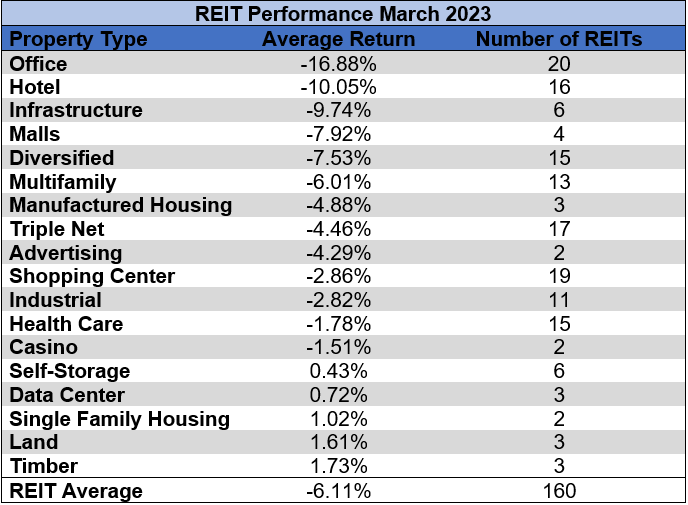
- Timber (+1.73%) and Land (+1.61%) REITs outperformed all other REIT property types in March. Office (-16.88%) and Hotel (-10.05%) REITs performed the worst, averaging double digit declines.
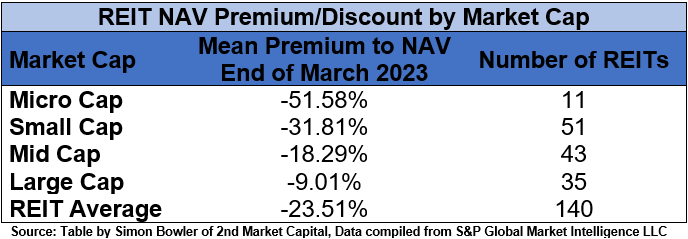
- The average REIT NAV discount widened from -19.63% to -23.51% during March. The median NAV discount also widened from -17.59% to -22.22%.
REIT Performance
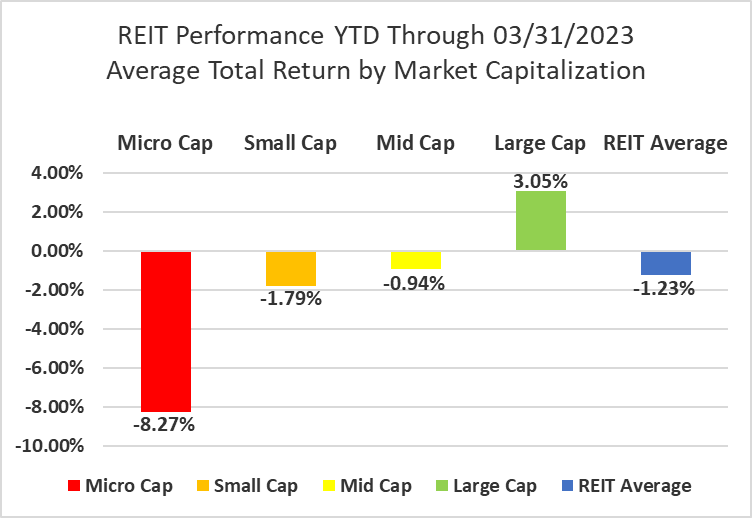
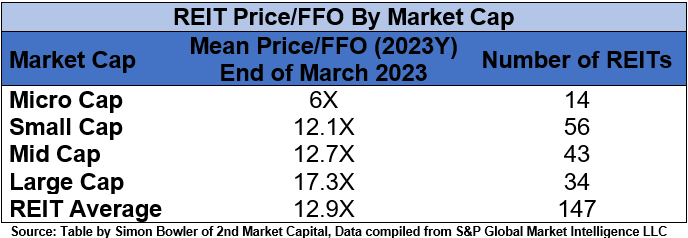
The REIT sector suffered another tough month in March (-6.11%) and fell into negative YTD return territory (-1.23%). REITs underperformed the Dow Jones Industrial Average (+2.08%), S&P 500 (+3.67%) and NASDAQ (+6.8%). The market cap weighted Vanguard Real Estate ETF ( VNQ ) had a much better total return than the average REIT in March (-2.18% vs. -6.11%) and is outperforming YTD (+1.66% vs. -1.23%). The spread between the 2023 FFO multiples of large cap REITs (17.3x) and small cap REITs (12.1x) narrowed slightly in March as multiples contracted by 0.2 turns for large caps and 0.1 turns for small caps. Investors currently need to pay an average of 43.0% more for each dollar of FFO from large cap REITs relative to small cap REITs. In this monthly publication, I will provide REIT data on numerous metrics to help readers identify which property types and individual securities currently offer the best opportunities to achieve their investment goals.
Source: Graph by Simon Bowler of 2nd Market Capital, Data compiled from S&P Global Market Intelligence LLC. See important notes and disclosures at the end of this article
There was a strong negative correlation between total return and market cap in March. REITs of all sizes averaged negative total returns in March. Large cap (-1.99%), mid cap (-4.56%) and small cap (-6.76%) REITs averaged single digit declines while micro caps (-15.50%) endured double digit negative total returns. Large cap REITs (+3.05%) are outperforming small caps (-1.79%) by 485 basis points on YTD 2023 total return.
Source: Graph by Simon Bowler of 2nd Market Capital, Data compiled from S&P Global Market Intelligence LLC. See important notes and disclosures at the end of this article
5 out of 18 Property Types Yielded Positive Total Returns in March
27.78% percent of REIT property types averaged a positive total return in March, with an 18.6% total return spread between the best and worst performing property types. Timber (+1.73%) and Land (+1.61%) were the best performing property types in March. Timber was buoyed by the strong performance of PotlatchDeltic ( PCH ) (+8.27%). All 3 Timber REITs are in the black after the first quarter of the year.
Office (-16.88%) and Hotel (-10.05%) REITs underperformed their REIT peers in March. In a painful repeat of February’s poor performance, all 20 Office REITs had negative total returns. All 20 Office REITs are now in the red year to date as well. Franklin Street Properties ( FSP ) (-35.12%), SL Green Realty ( SLG ) (-30.09%) and Office Properties Income Trust ( OPI ) (-25.18%) had the sharpest declines among Office REITs in March.
Source: Table by Simon Bowler of 2nd Market Capital, Data compiled from S&P Global Market Intelligence LLC. See important notes and disclosures at the end of this article
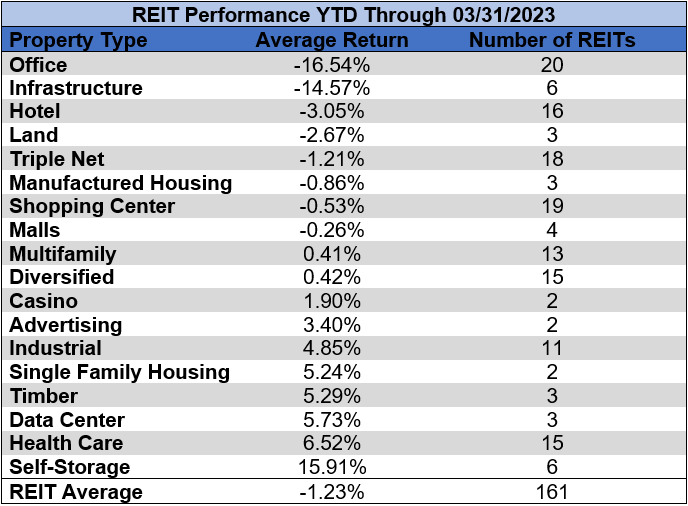
Office (-16.54%) and Infrastructure REITs (-14.57%) severely underperformed all other property types in the 1 st quarter of 2023. 10 of the 18 REIT property types are the black YTD led by Self Storage (+15.91%) and Health Care (+6.52%).
Source: Table by Simon Bowler of 2nd Market Capital, Data compiled from S&P Global Market Intelligence LLC. See important notes and disclosures at the end of this article
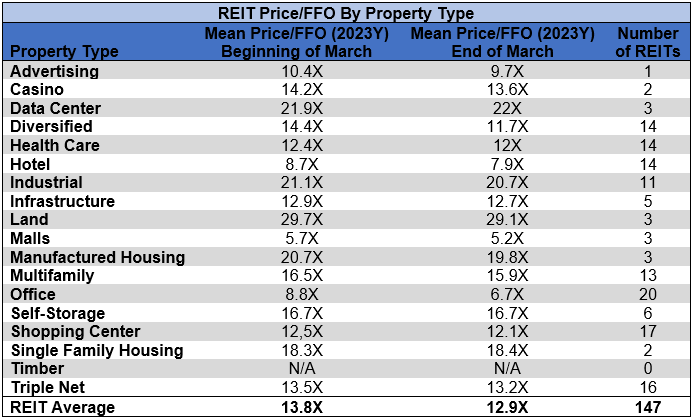
The REIT sector as a whole saw the average P/FFO (2023Y) decrease 0.9 turns in March from 13.8x down to 12.9x). The average FFO multiple expanded for 11.8% of property types, contracted for 82.4% and held steady for 5.9%. There are no recent 2023 FFO/share estimates for any of the Timber REITs. Land (29.1x) Data Centers (22x), Industrial (20.7x) and Manufactured Housing (19.8x) continue to trade at the highest multiples among REIT property types. Mall (5.2x), Office (6.7x), Hotel (7.9x) and Advertising (9.7x) REITs are the only REITs currently trading at single digit multiples.
Source: Table by Simon Bowler of 2nd Market Capital, Data compiled from S&P Global Market Intelligence LLC. See important notes and disclosures at the end of this article
Performance of Individual Securities
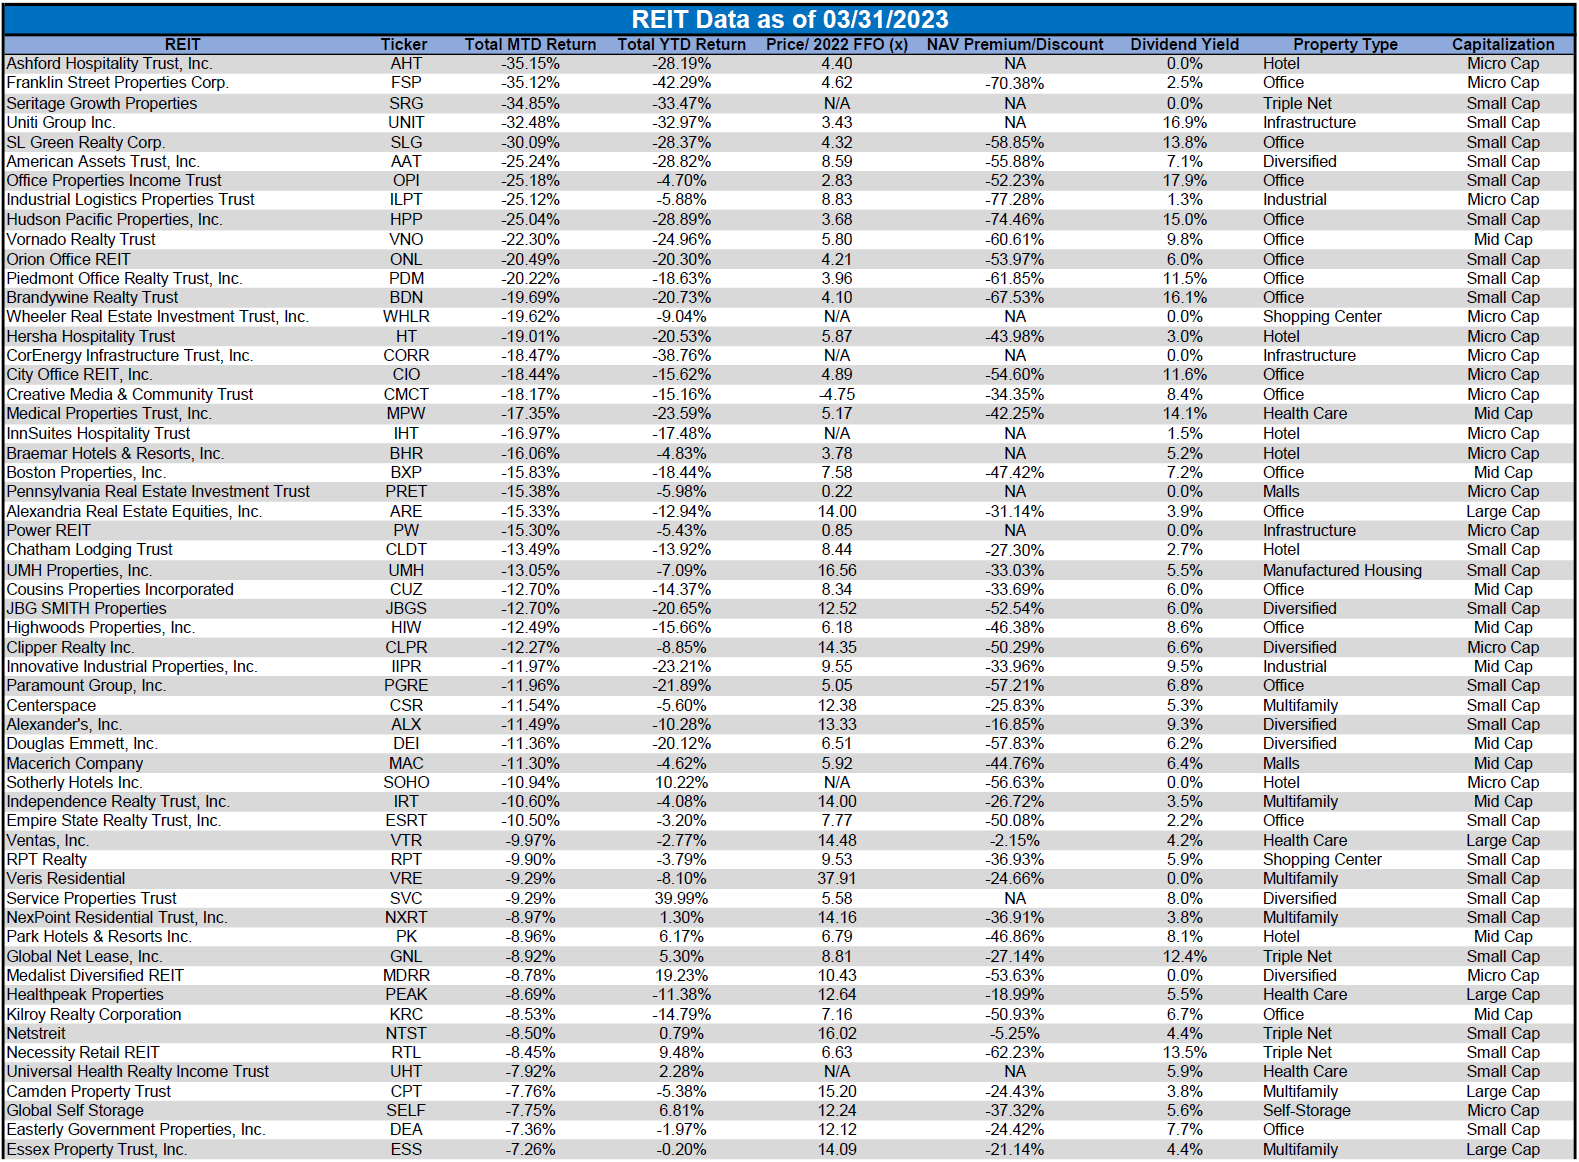
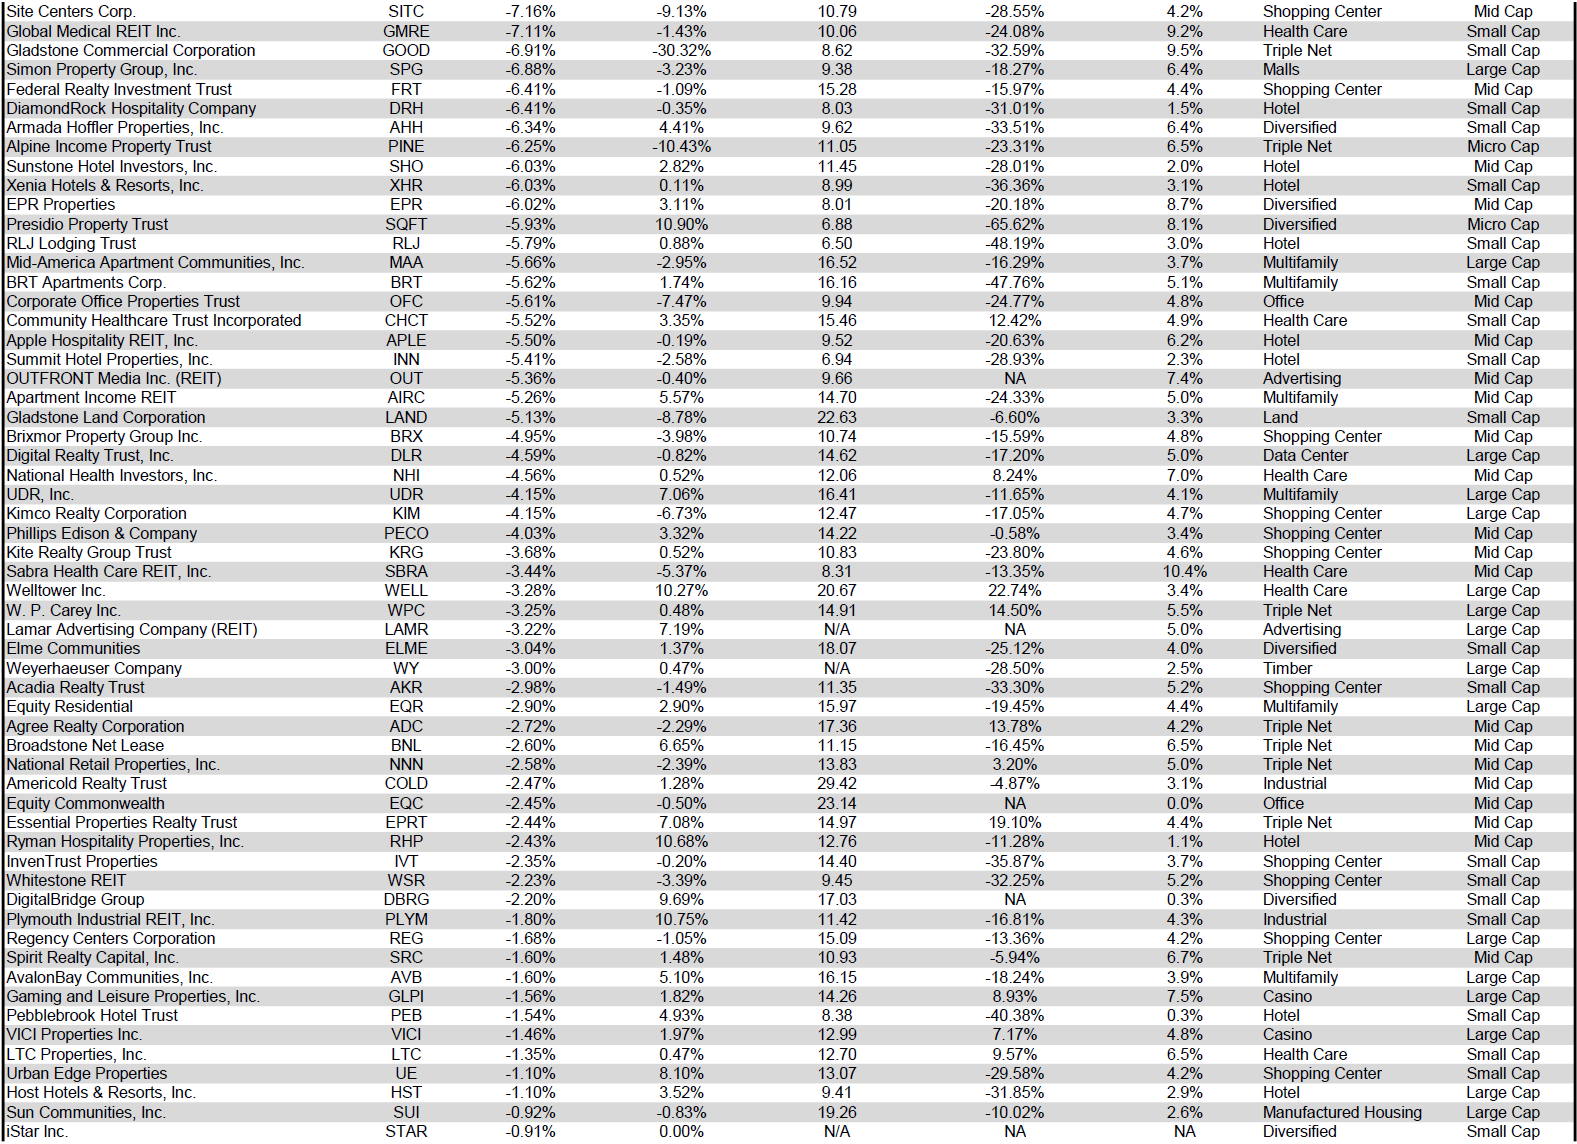
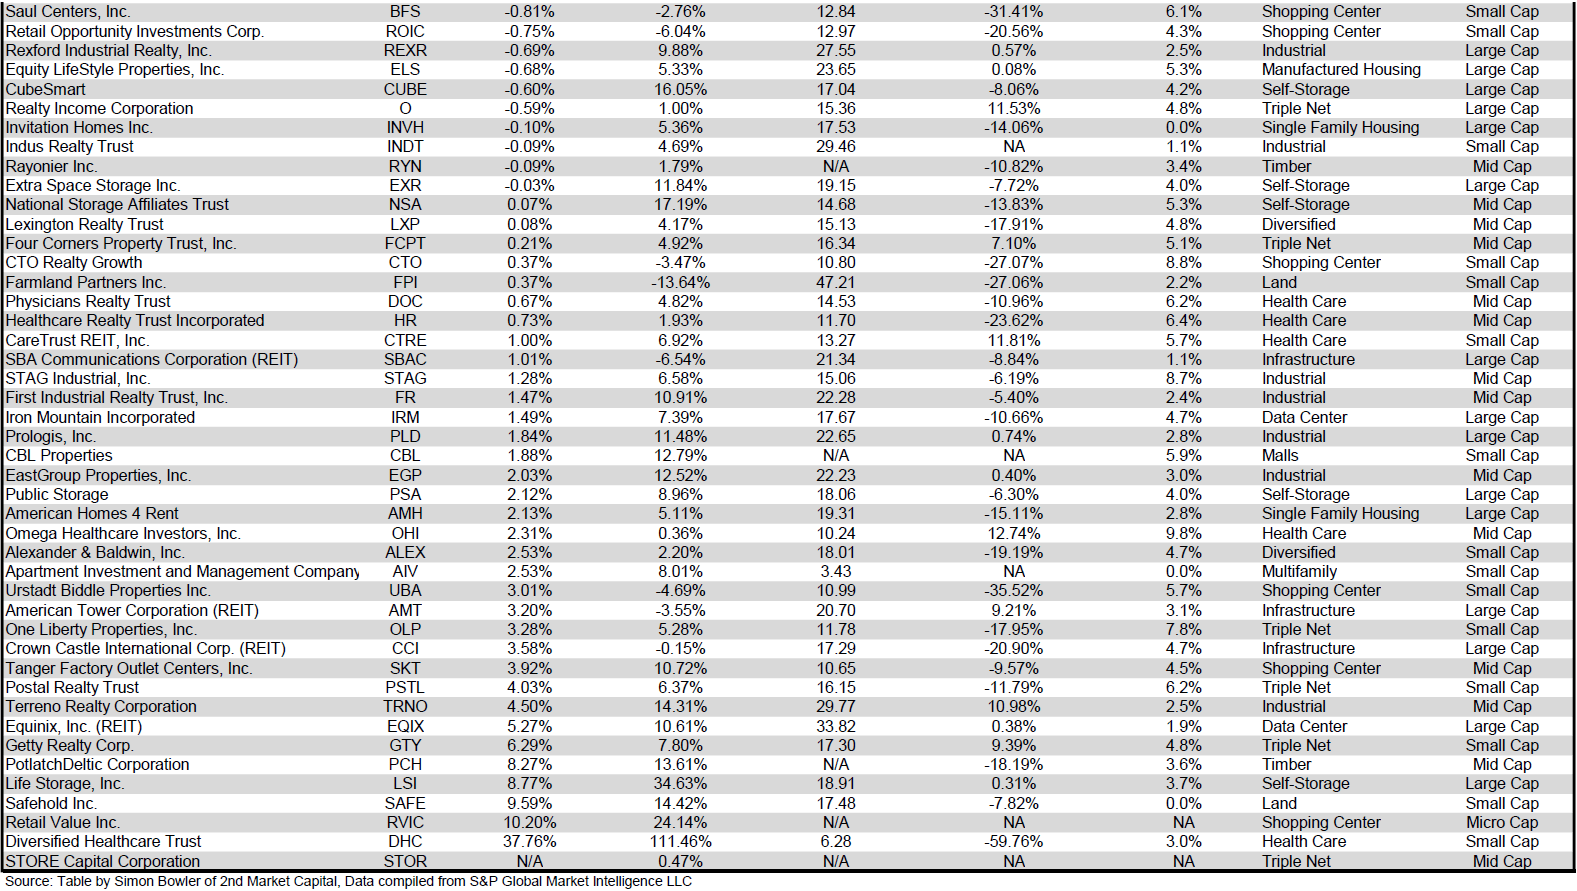
iStar (STAR) merged with Safehold ( SAFE ) in a stock-for-stock transaction on March 31 st . STAR shareholders received 0.153 shares of SAFE for every share of STAR held. This distribution of SAFE shares occurred after a reverse stock split in which each STAR share was consolidated into 0.160 shares. The combined entity will trade under the name Safehold and will continue to use the ticker SAFE.
Diversified Healthcare Trust ( DHC ) (+37.76%) was the best performing REIT again in March after leading the sector in February as well with a +23.83% total return. The share price of DHC soared after the REIT posted earnings on March 1 st that handily beat the analyst consensus and the performance from the prior year.
Ashford Hospitality Trust ( AHT ) (-35.15%) was the worst performing REIT again in March with an even worse total return than their dismal -28.16% in February. This represents a continuation of the unrivaled share price decline of AHT, which has now fallen 99.5% in the past 5 years.
21.74% of REITs had a positive total return in March with 50.31% in the black year to date. During the first quarter of last year the average REIT had a -1.44% return. During the 1 st quarter of this year the average REIT has had a comparable performance with a -1.23% total return.
Source: Table by Simon Bowler of 2nd Market Capital, Data compiled from S&P Global Market Intelligence LLC. See important notes and disclosures at the end of this article Source: Table by Simon Bowler of 2nd Market Capital, Data compiled from S&P Global Market Intelligence LLC. See important notes and disclosures at the end of this article Source: Table by Simon Bowler of 2nd Market Capital, Data compiled from S&P Global Market Intelligence LLC. See important notes and disclosures at the end of this article
For the convenience of reading this table in a larger font, the table above is available as a PDF as well .
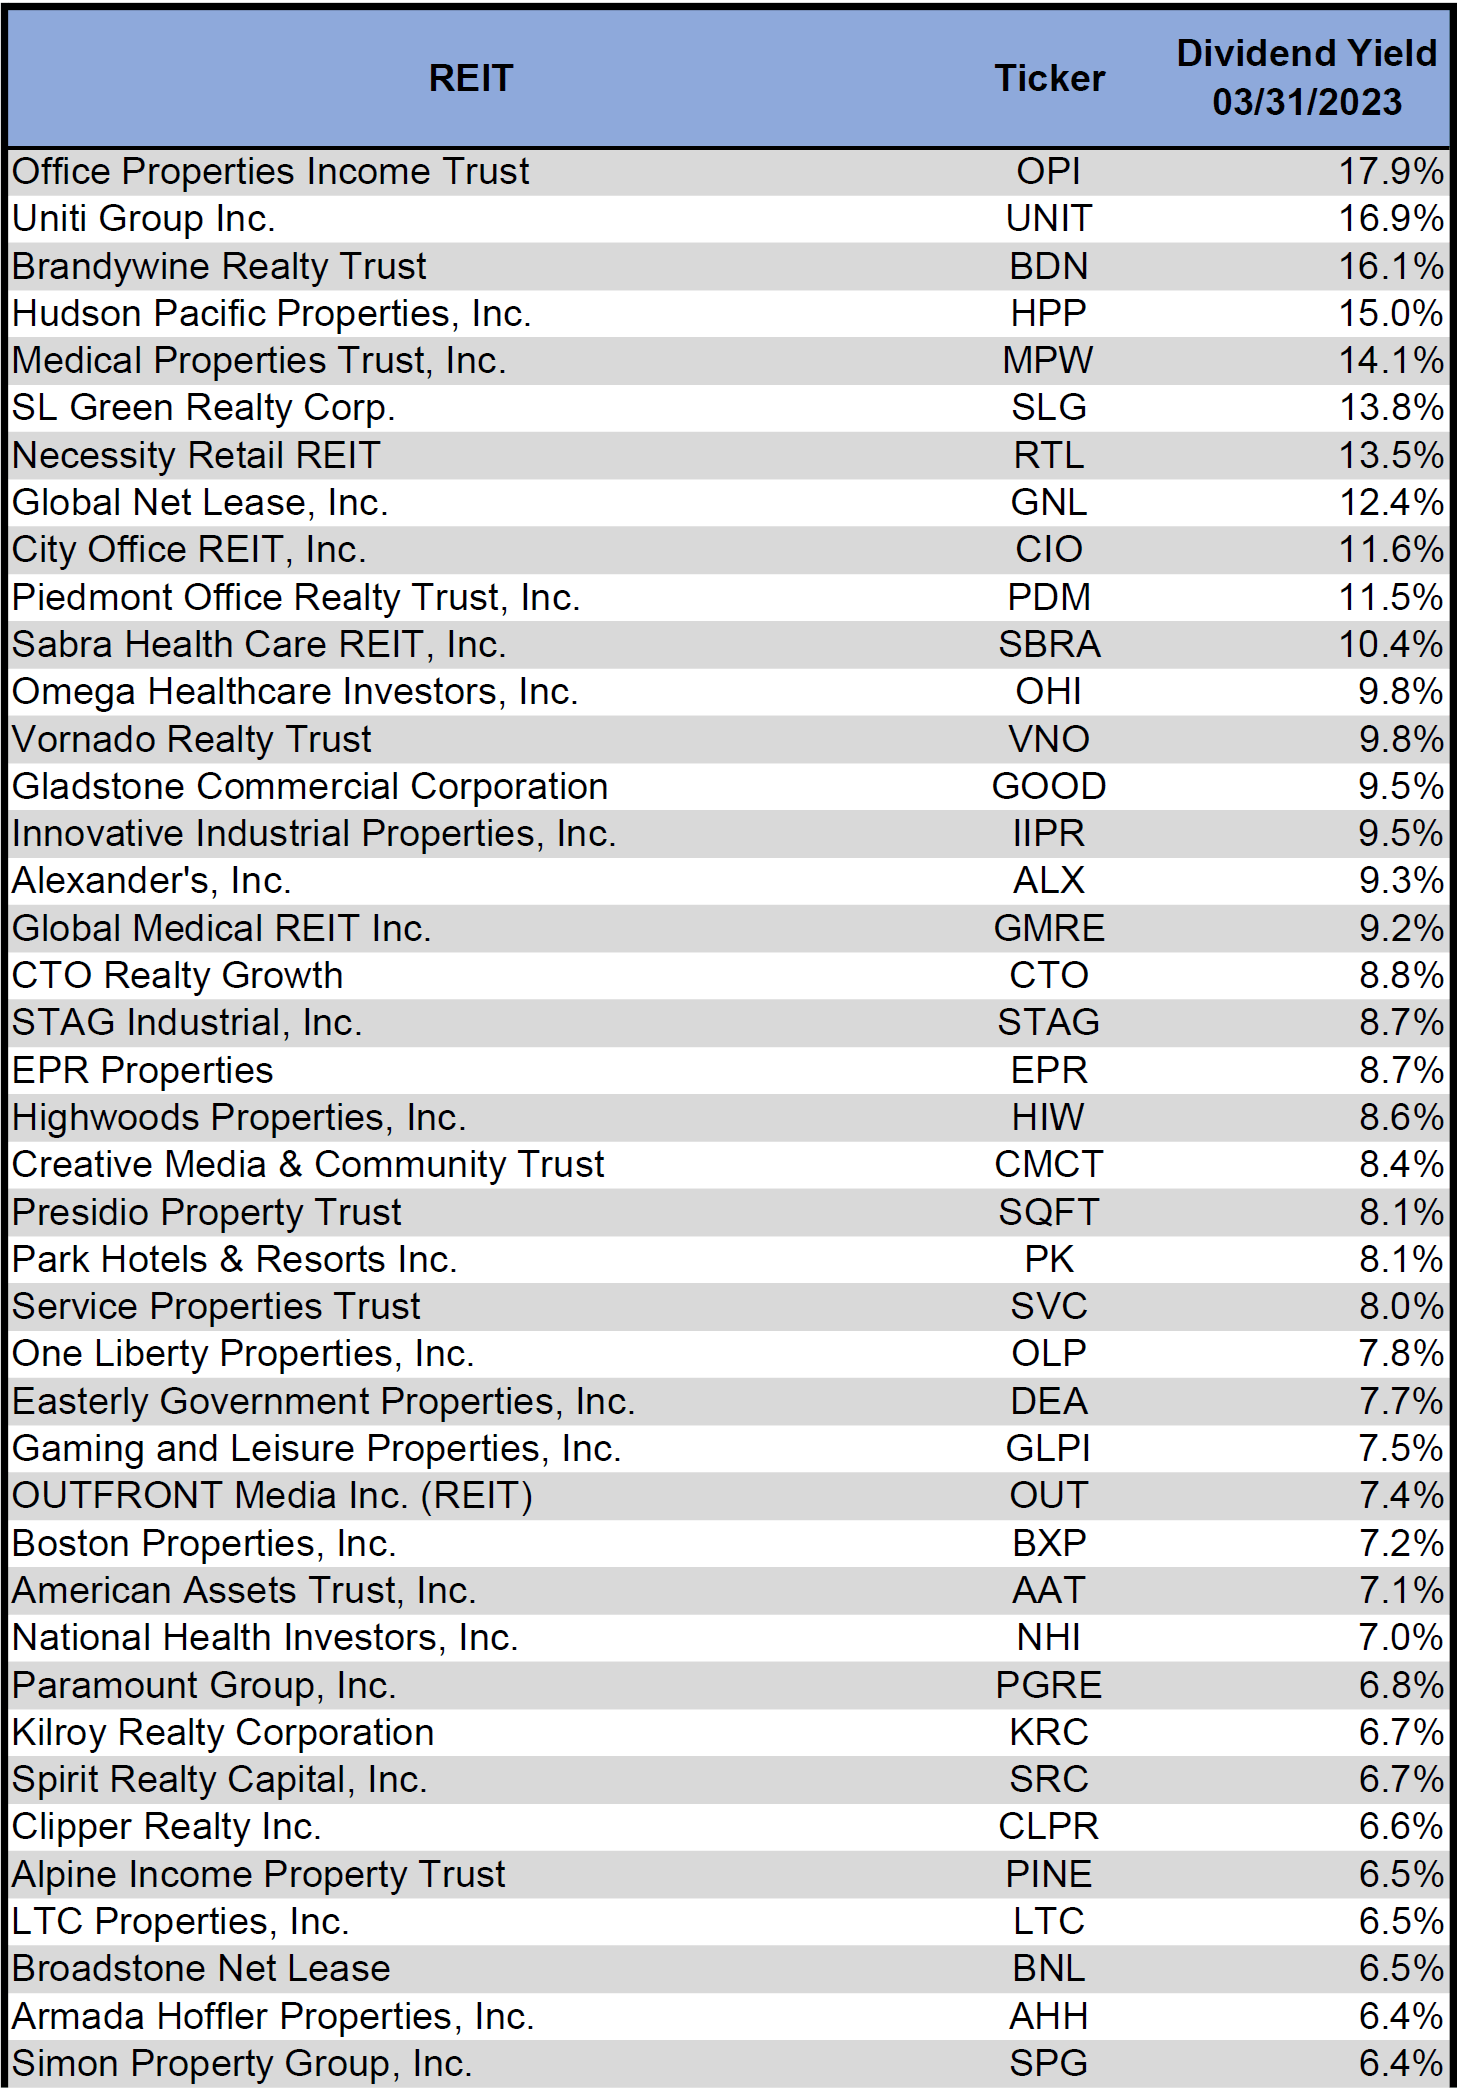
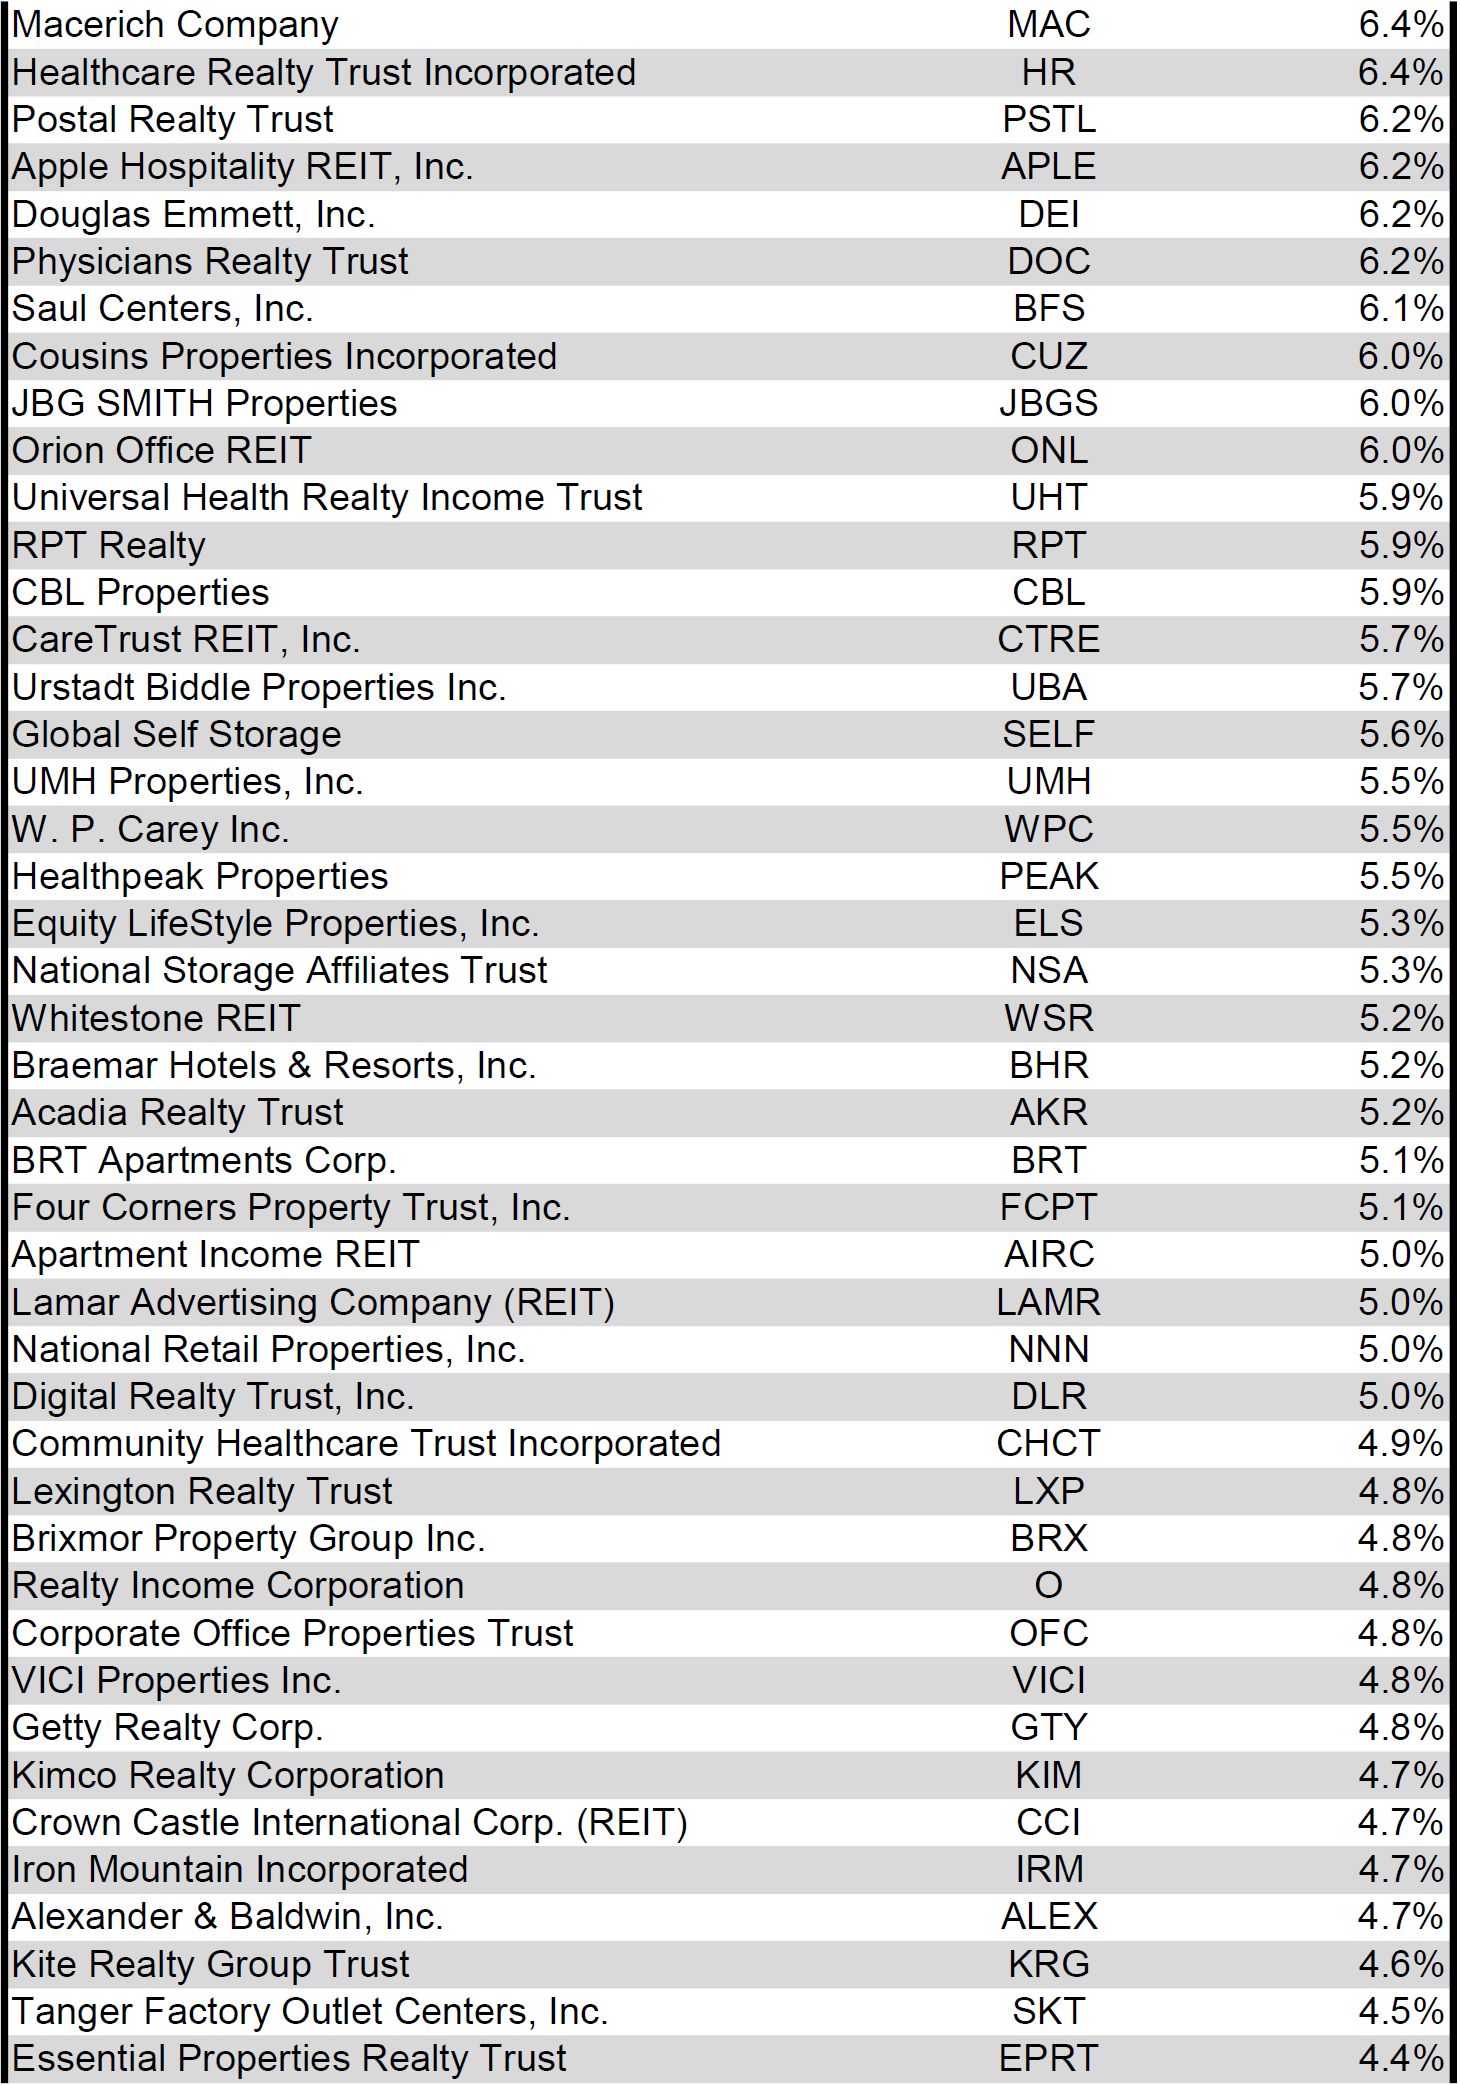
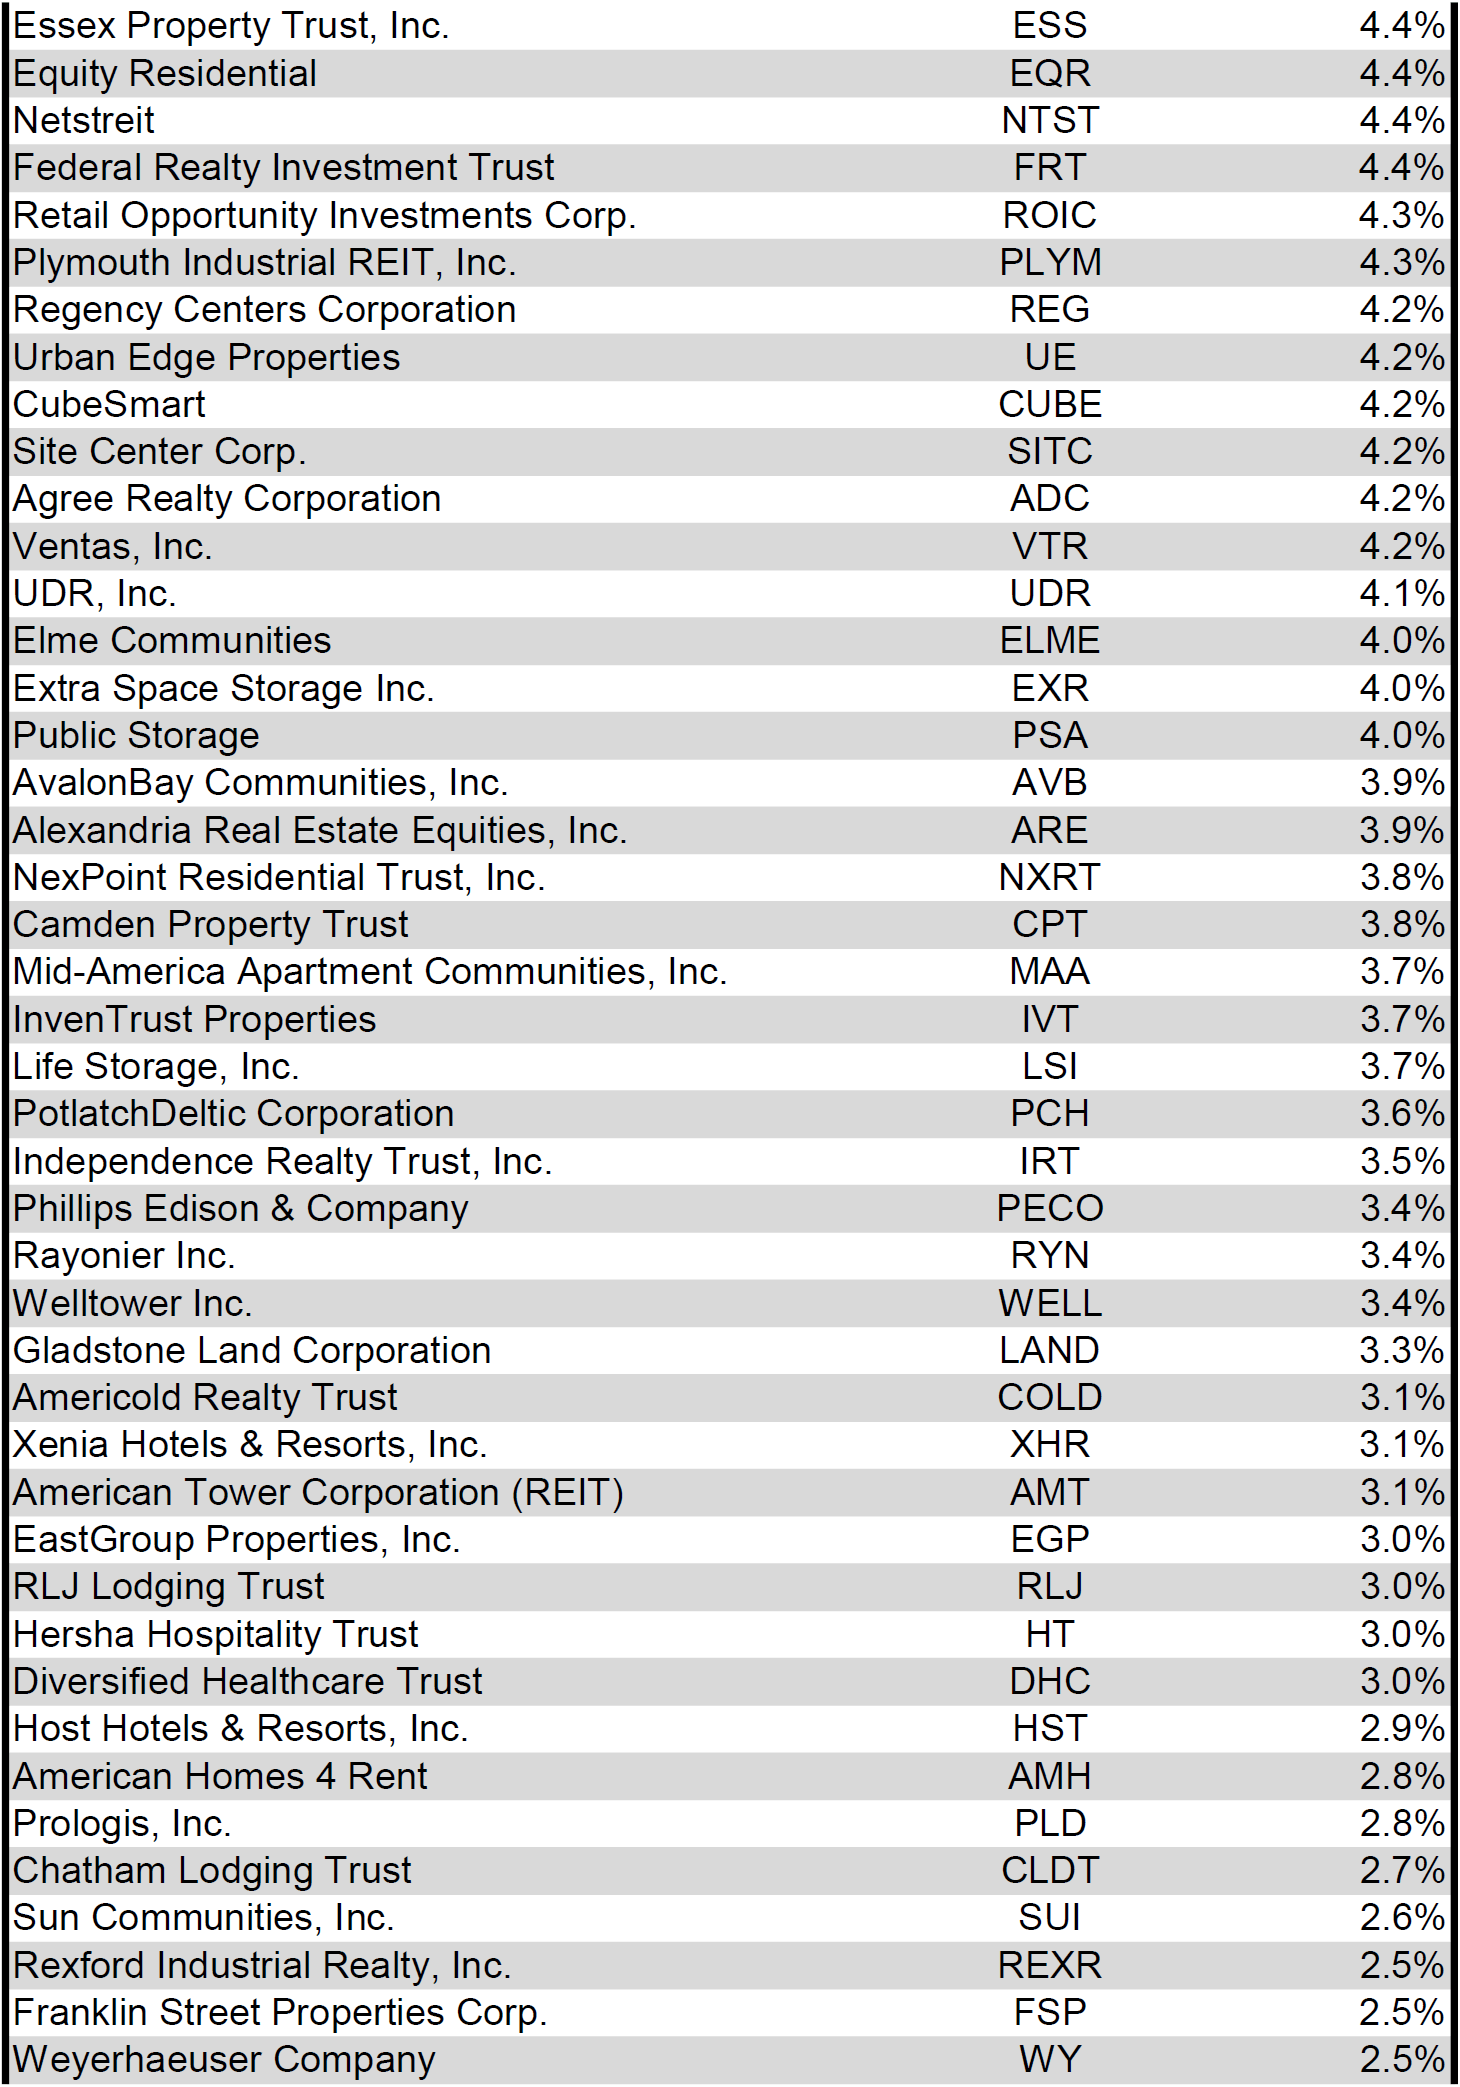
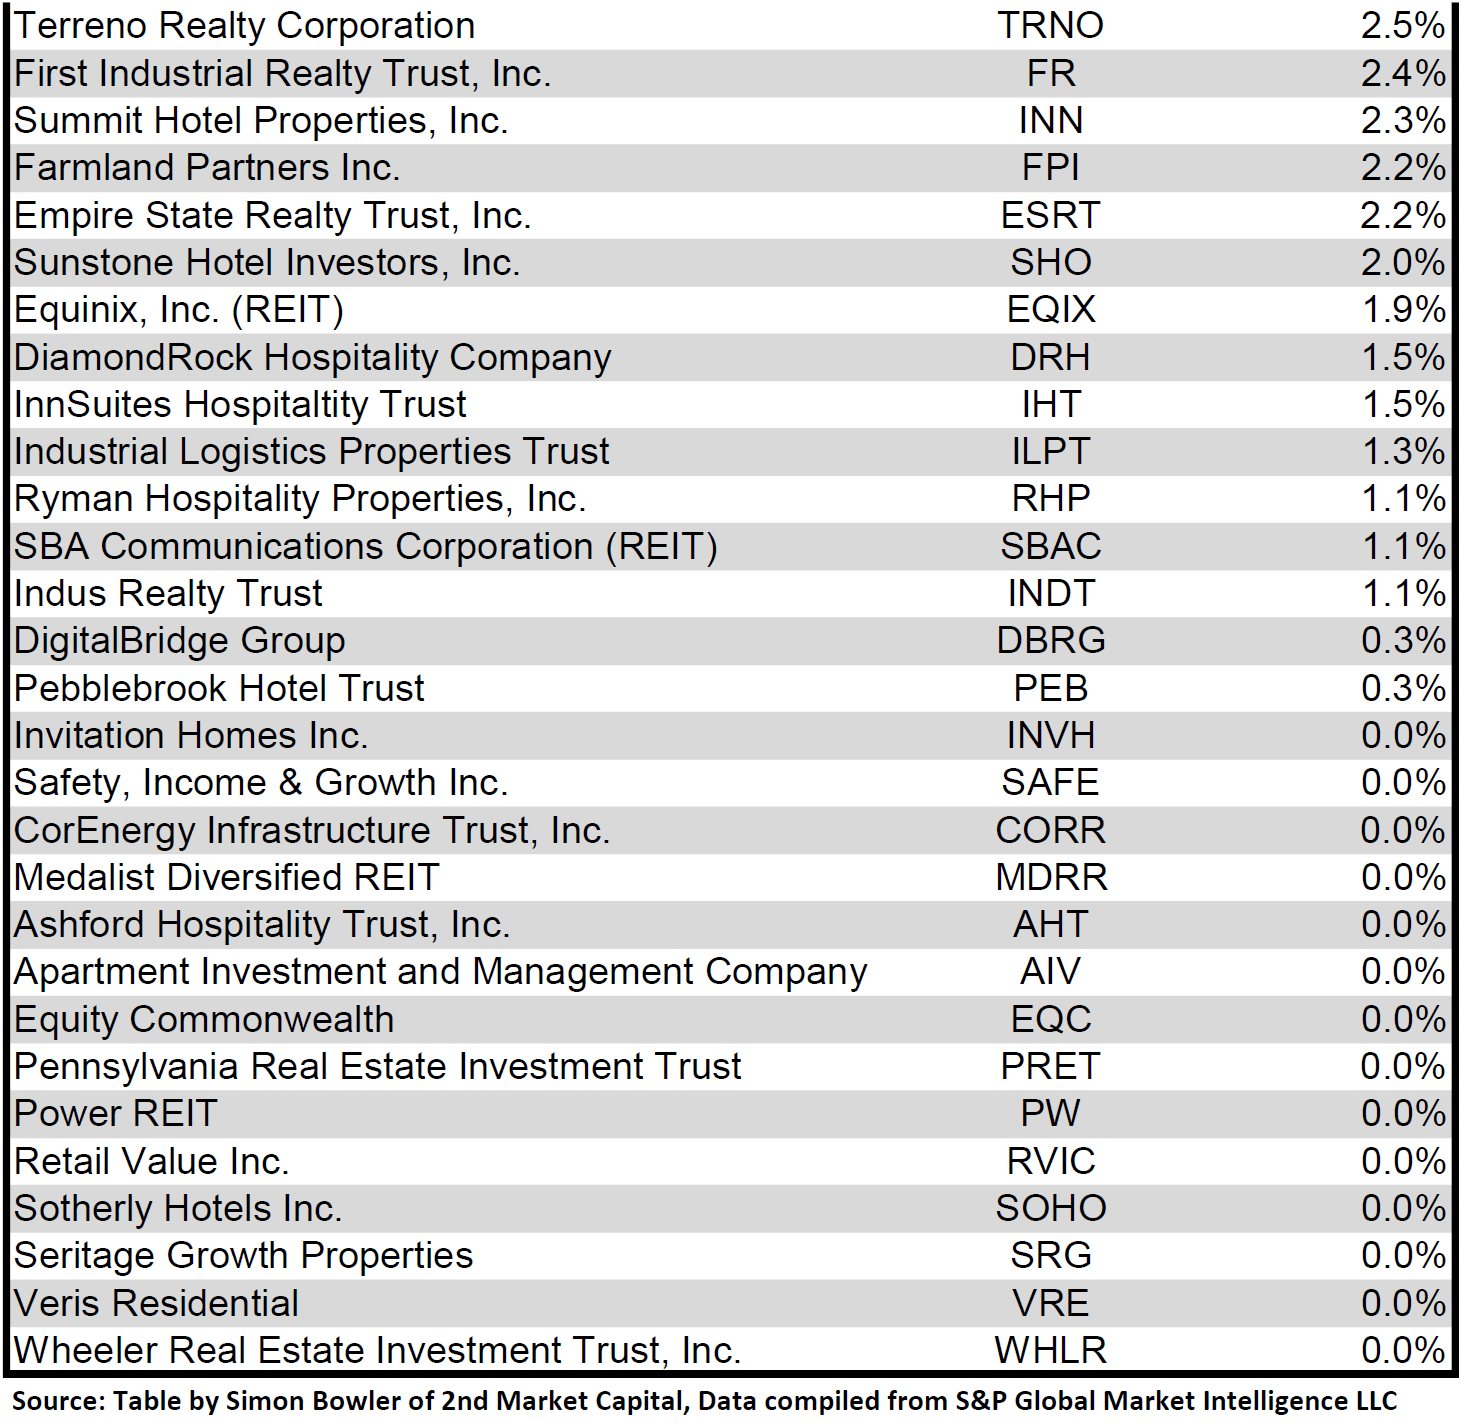
Dividend Yield
Dividend yield is an important component of a REIT's total return. The particularly high dividend yields of the REIT sector are, for many investors, the primary reason for investment in this sector. As many REITs are currently trading at share prices well below their NAV, yields are currently quite high for many REITs within the sector. Although a particularly high yield for a REIT may sometimes reflect a disproportionately high risk, there exist opportunities in some cases to capitalize on dividend yields that are sufficiently attractive to justify the underlying risks of the investment. I have included below a table ranking equity REITs from highest dividend yield (as of 03/31/2023) to lowest dividend yield.
Source: Table by Simon Bowler of 2nd Market Capital, Data compiled from S&P Global Market Intelligence LLC. See important notes and disclosures at the end of this article Source: Table by Simon Bowler of 2nd Market Capital, Data compiled from S&P Global Market Intelligence LLC. See important notes and disclosures at the end of this article Source: Table by Simon Bowler of 2nd Market Capital, Data compiled from S&P Global Market Intelligence LLC. See important notes and disclosures at the end of this article Source: Table by Simon Bowler of 2nd Market Capital, Data compiled from S&P Global Market Intelligence LLC. See important notes and disclosures at the end of this article
For the convenience of reading this table in a larger font, the table above is available as a PDF as well .
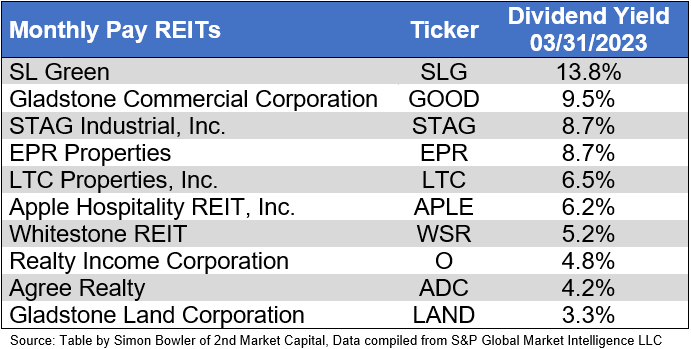
Although a REIT’s decision regarding whether to pay a quarterly dividend or a monthly dividend does not reflect on the quality of the company’s fundamentals or operations, a monthly dividend allows for a smoother cash flow to the investor. Below is a list of equity REITs that pay monthly dividends ranked from highest yield to lowest yield.
Source: Table by Simon Bowler of 2nd Market Capital, Data compiled from S&P Global Market Intelligence LLC. See important notes and disclosures at the end of this article
Valuation
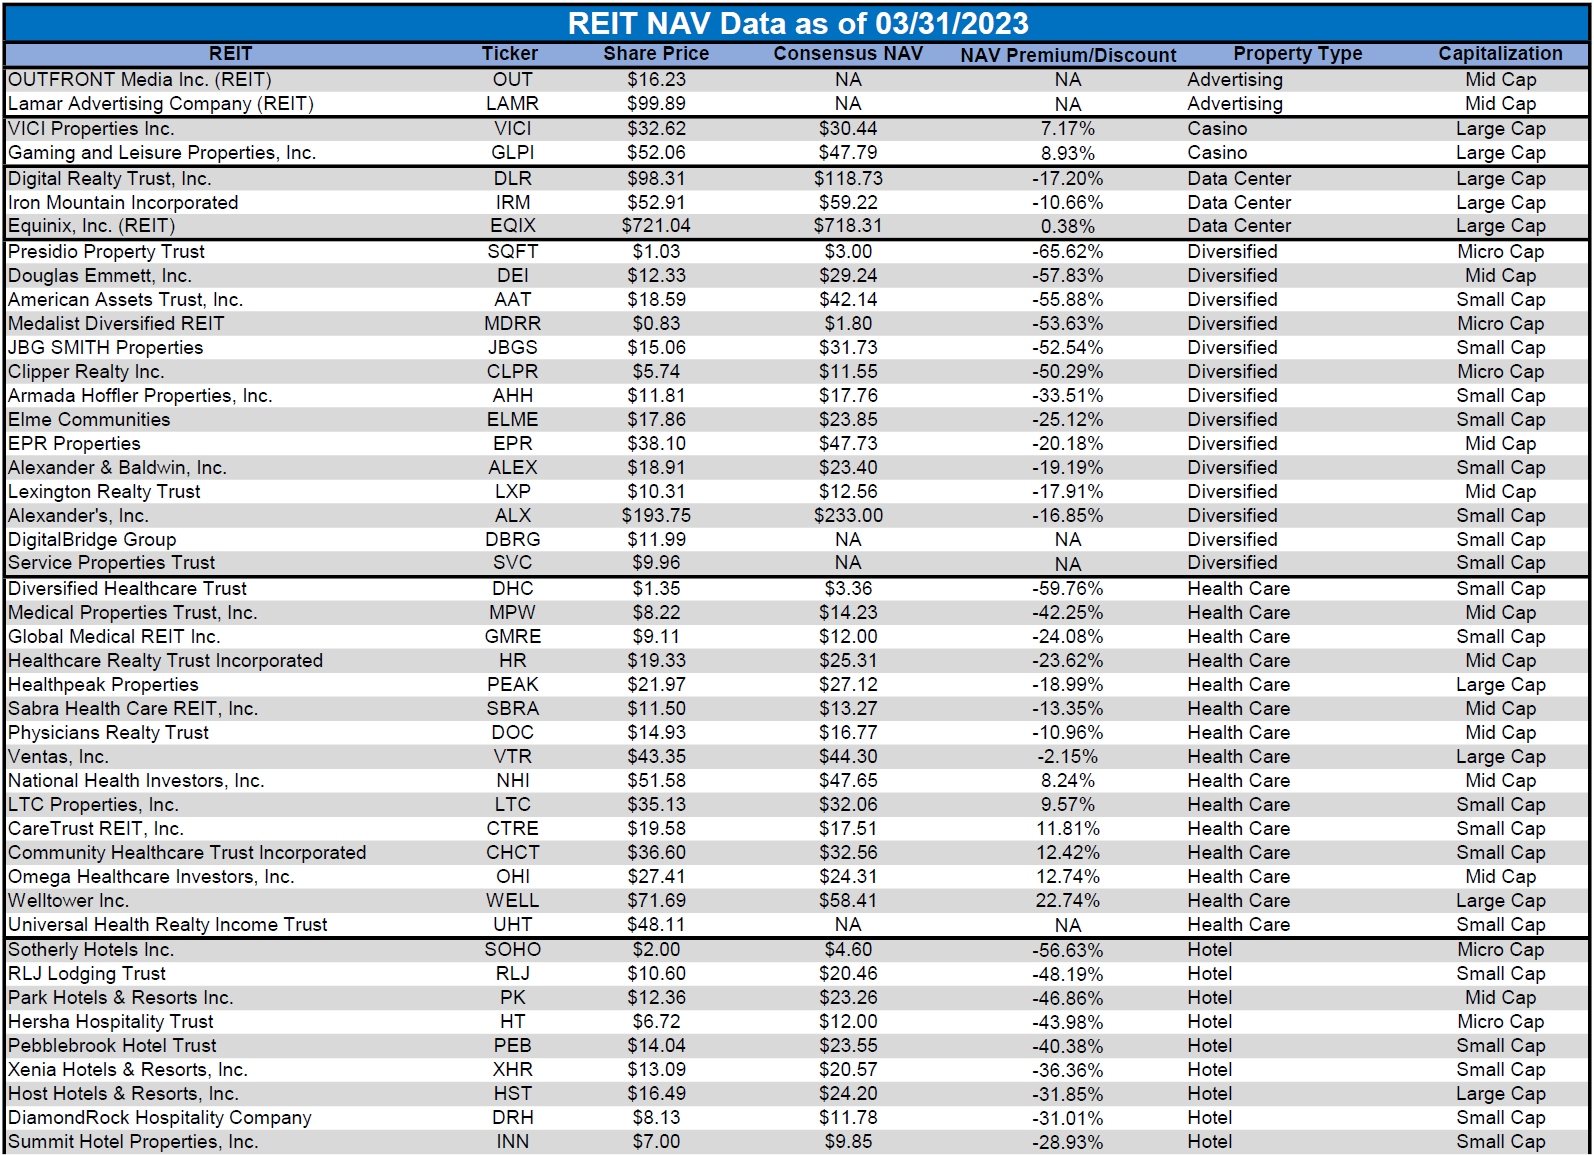
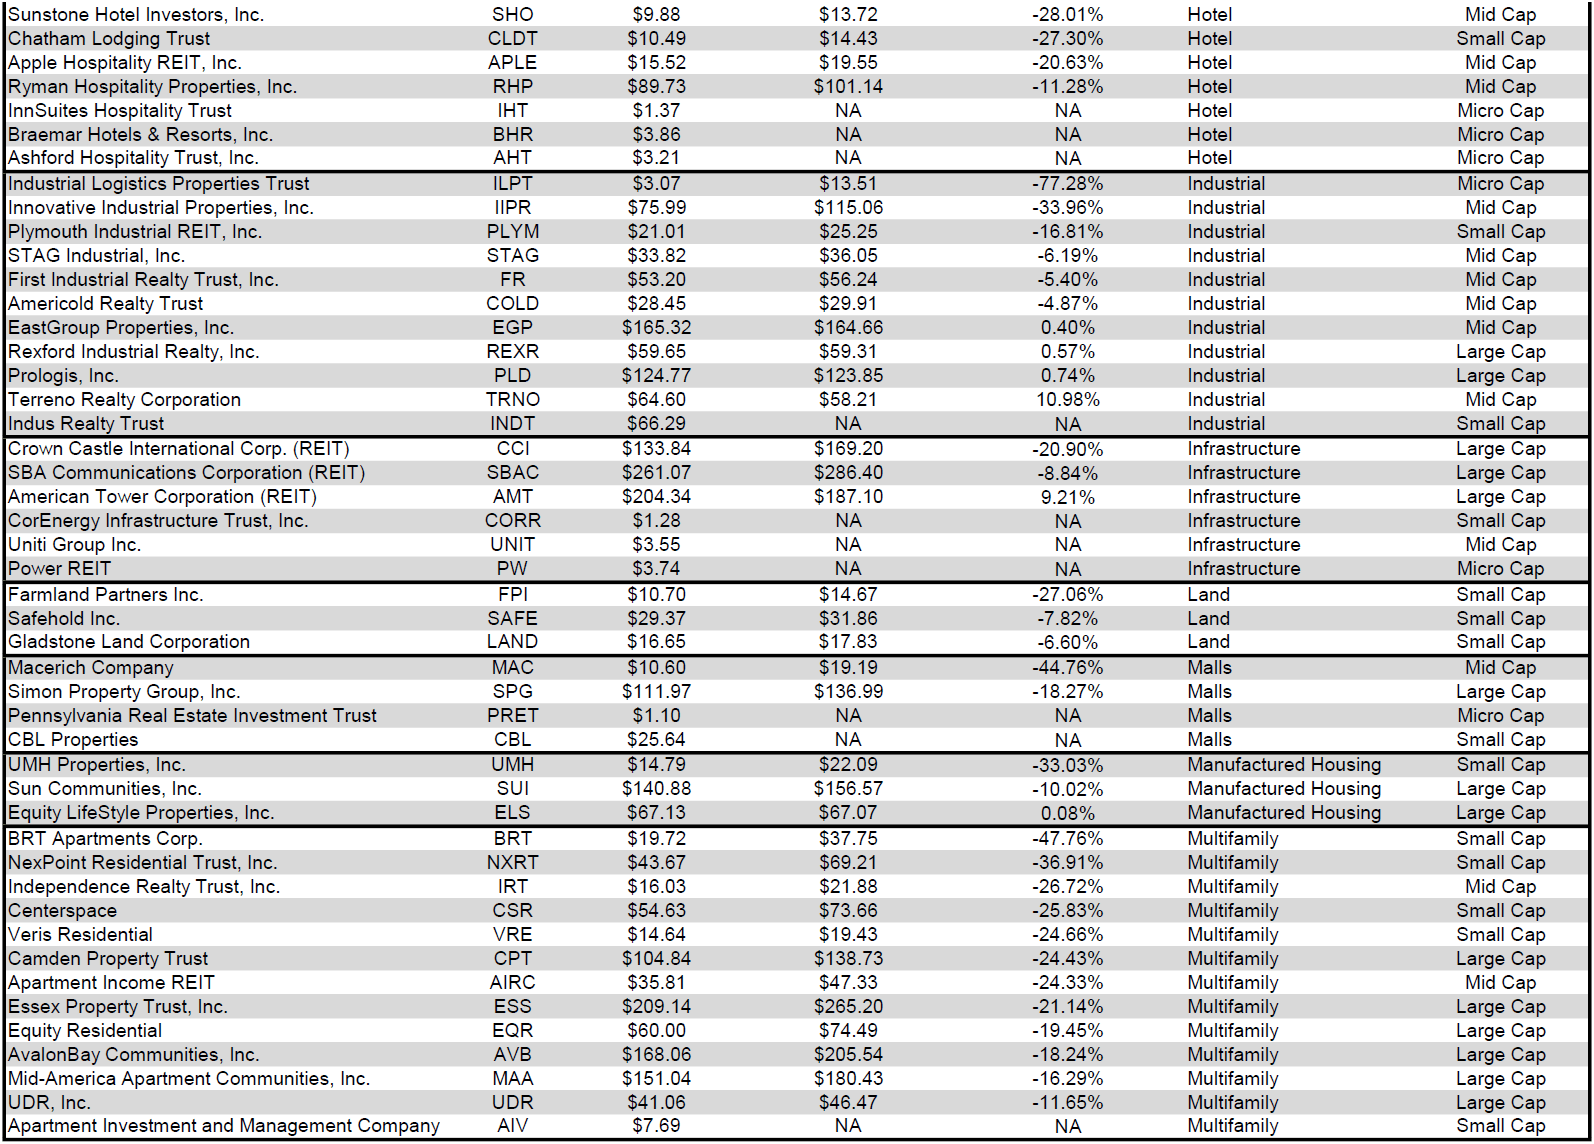
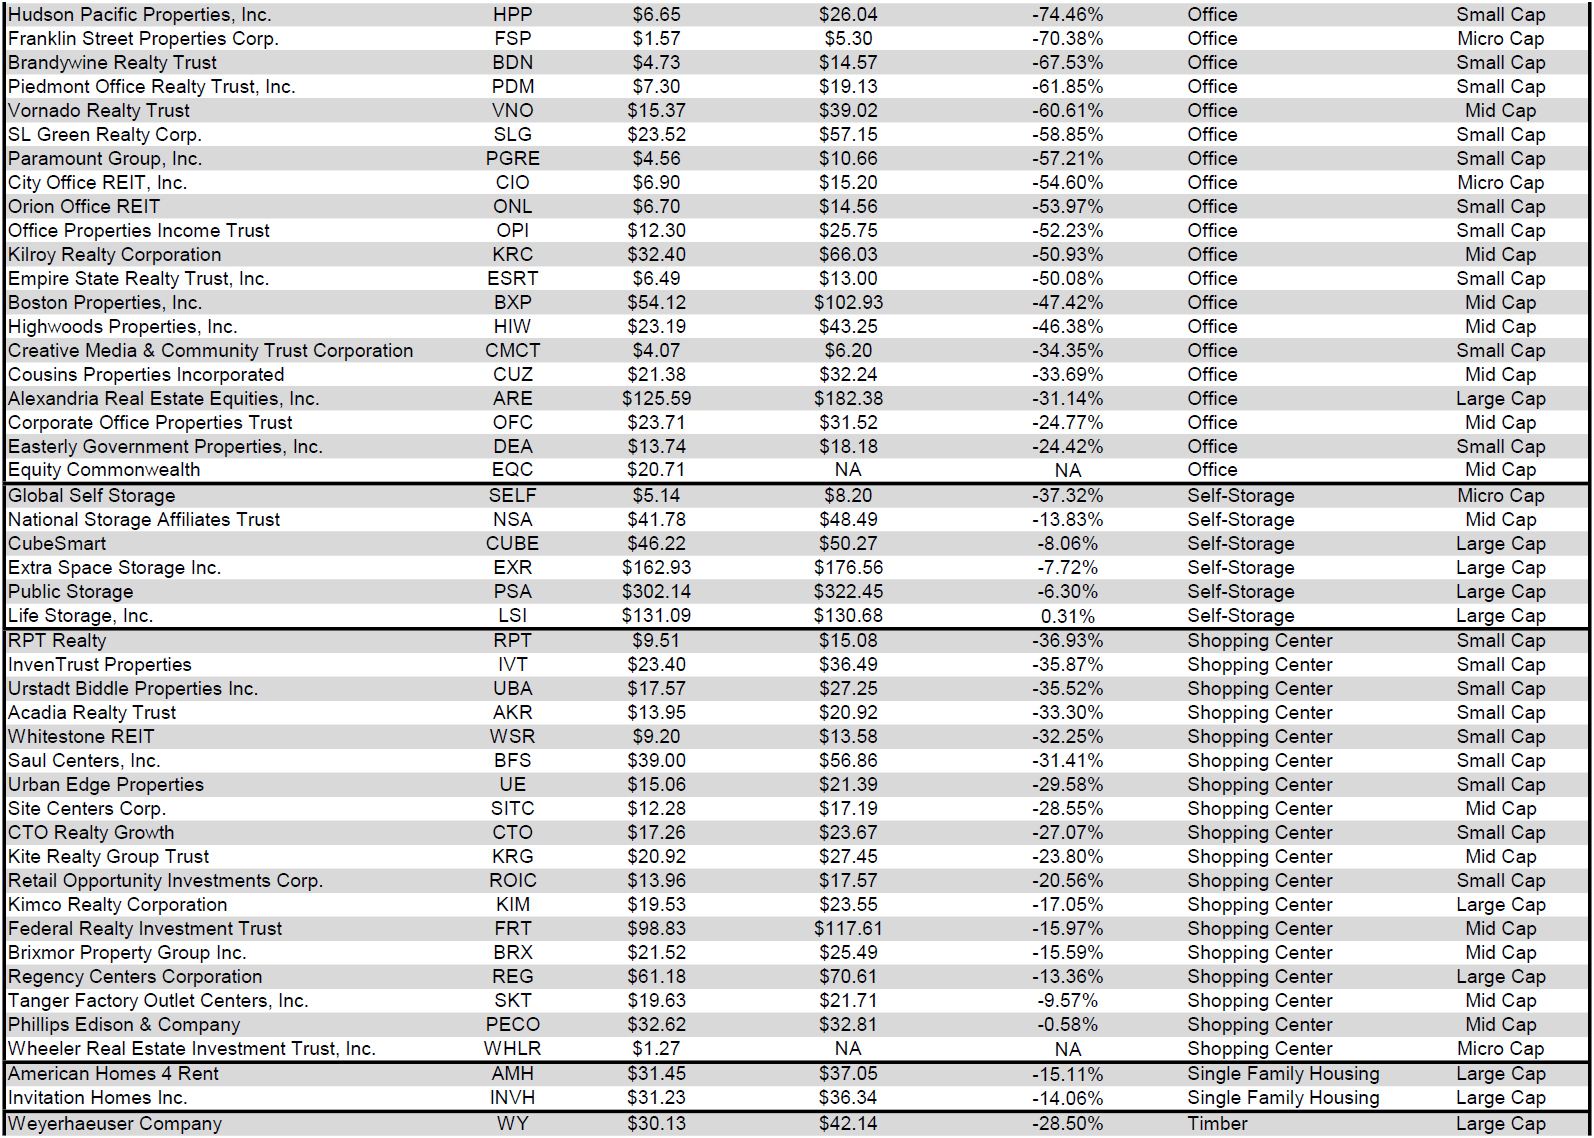
REIT Premium/Discount to NAV by Property Type
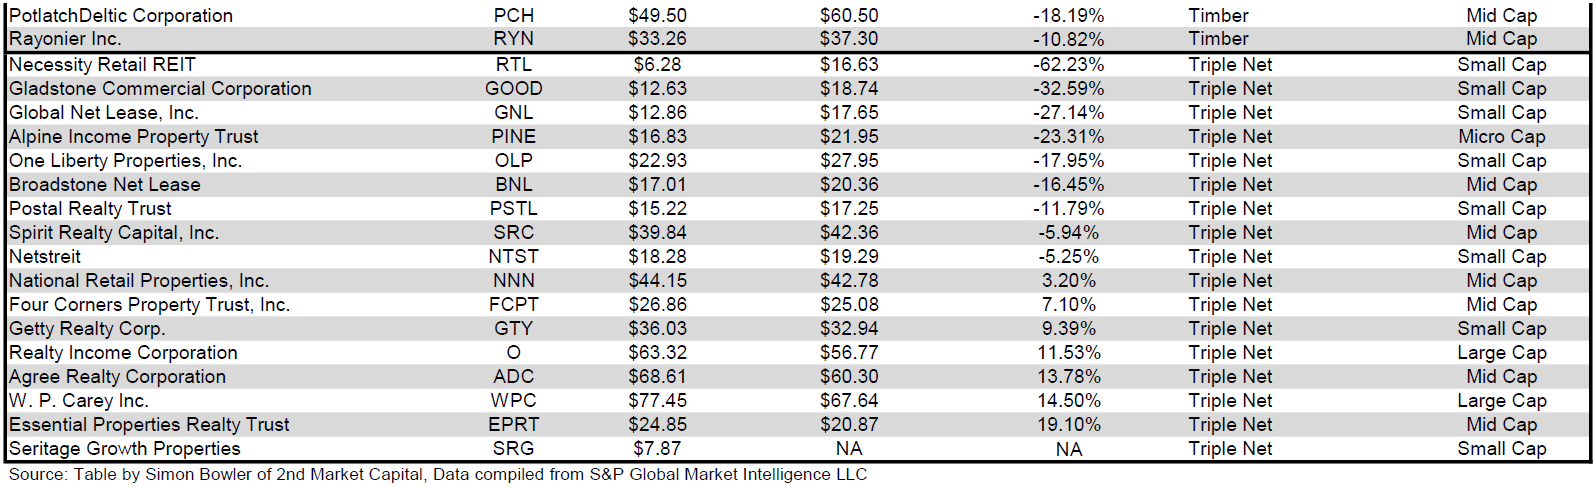
Below is a downloadable data table, which ranks REITs within each property type from the largest discount to the largest premium to NAV. The consensus NAV used for this table is the average of analyst NAV estimates for each REIT. Both the NAV and the share price will change over time, so I will continue to include this table in upcoming issues of The State of REITs with updated consensus NAV estimates for each REIT for which such an estimate is available.
Source: Table by Simon Bowler of 2nd Market Capital, Data compiled from S&P Global Market Intelligence LLC. See important notes and disclosures at the end of this article Source: Table by Simon Bowler of 2nd Market Capital, Data compiled from S&P Global Market Intelligence LLC. See important notes and disclosures at the end of this article Source: Table by Simon Bowler of 2nd Market Capital, Data compiled from S&P Global Market Intelligence LLC. See important notes and disclosures at the end of this article Source: Table by Simon Bowler of 2nd Market Capital, Data compiled from S&P Global Market Intelligence LLC. See important notes and disclosures at the end of this article
For the convenience of reading this table in a larger font, the table above is available as a PDF as well .
Takeaway
The large cap REIT premium (relative to small cap REITs) narrowed slightly in March and investors are now paying on average about 43% more for each dollar of 2023 FFO/share to buy large cap REITs than small cap REITs (17.3x/12.1x - 1 = 43.0%). As can be seen in the table below, there is presently a strong positive correlation between market cap and FFO multiple.
Source: Table by Simon Bowler of 2nd Market Capital, Data compiled from S&P Global Market Intelligence LLC. See important notes and disclosures at the end of this article
The table below shows the average premium/discount of REITs of each market cap bucket. This data, much like the data for price/FFO, shows a strong, positive correlation between market cap and Price/NAV. The average large cap REIT (-9.01%) trades at a single digit discount to NAV, while mid cap REITs (-18.29%) trade at a double-digit discount to NAV. Small cap REITs (-31.81%) trade at a little over 2/3 of NAV. Micro caps on average trade at just under half of their respective NAVs (-51.58%).
Source: Table by Simon Bowler of 2nd Market Capital, Data compiled from S&P Global Market Intelligence LLC. See important notes and disclosures at the end of this article
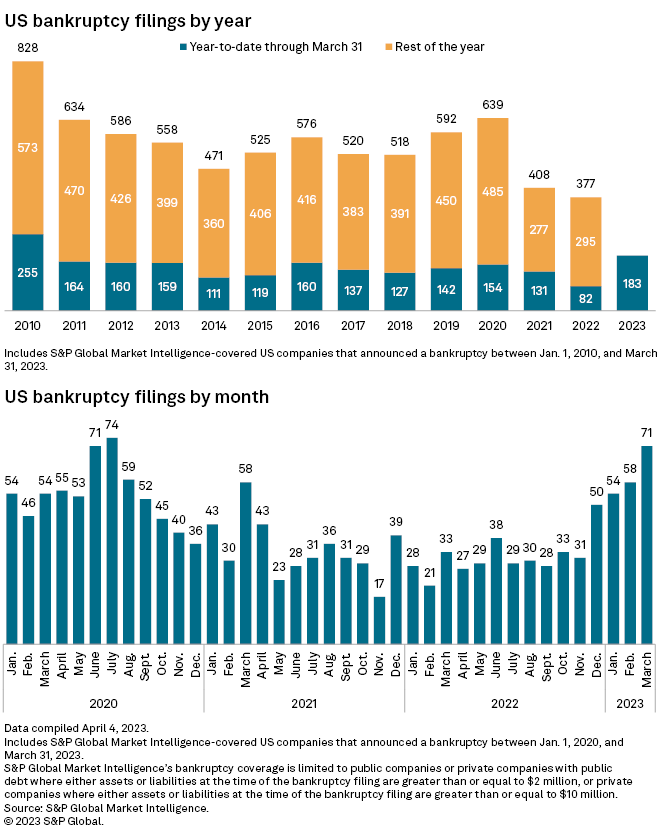
In recent months I have been highlighting the trend of rising bankruptcy filings and cautioned that these filings will likely continue to pick up speed. As can be seen in the charts below, that trend has continued into March. The number of bankruptcy filings rose for the 4 th straight month and in the first quarter of 2023 there have been more filings than in any other Q1 since 2010. Due to sharp increases in the cost of capital and challenging economic conditions, Q2 is unlikely to see a reversal of this trend.
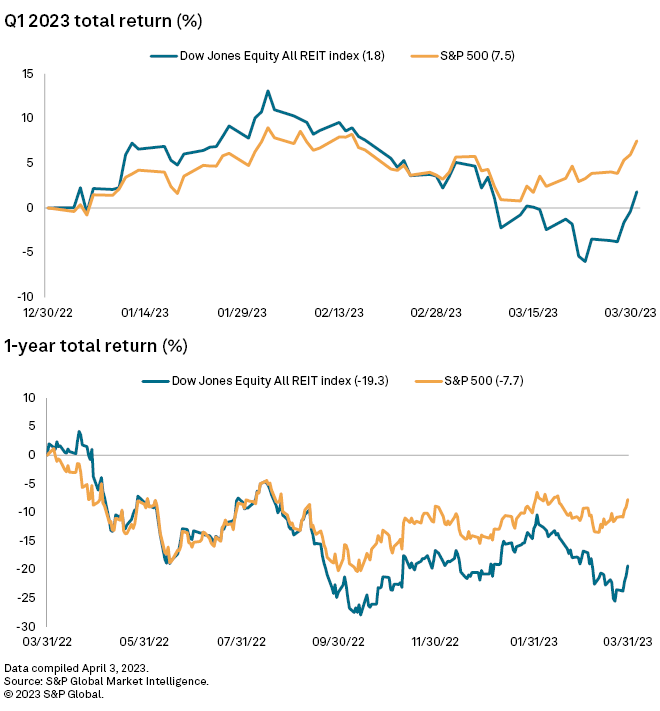
Although REITs initially outperformed at the start of 2023, the total return of the REIT sector has now fallen far behind the total return of the S&P 500 year to date. This REIT underperformance is even more significant over the past years with REITs underperforming the S&P 500 by more than 1100 basis points.
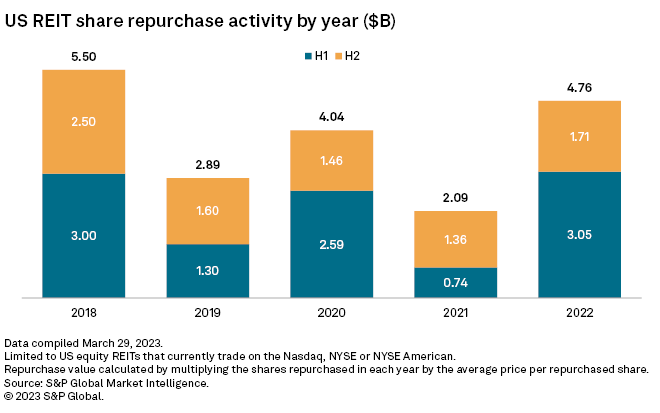
This has created an environment in which REIT share prices have become disproportionately discounted. Many REITs have capitalized on these sizeable discounts and have accretively repurchased shares at prices well-below NAV. Equity REIT share repurchase activity in 2022 was the highest since 2018.
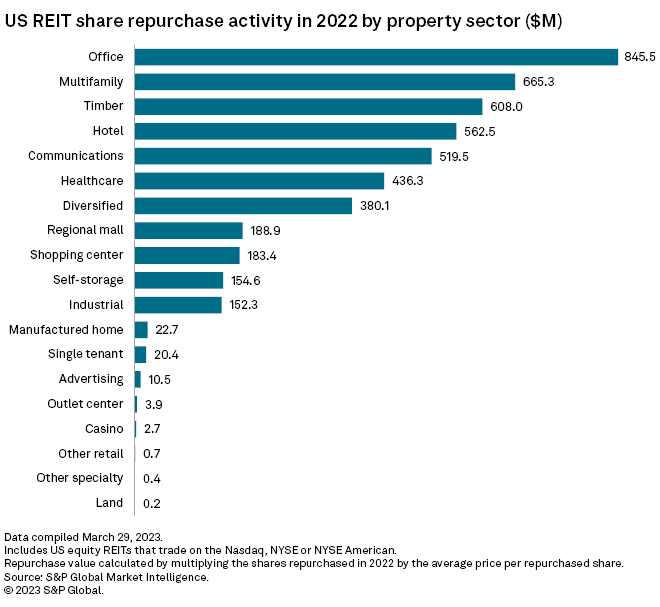
The degree to which share buybacks are accretive is proportionate to the magnitude of NAV discount. Thus, it is appropriate that some of the most beaten down property types (such as Office, Multifamily and Hotels) had among the largest volumes of share repurchases in 2022. It is also logical that property types trading at premiums to NAV such as Casino REITs had among the smallest volumes of buybacks.
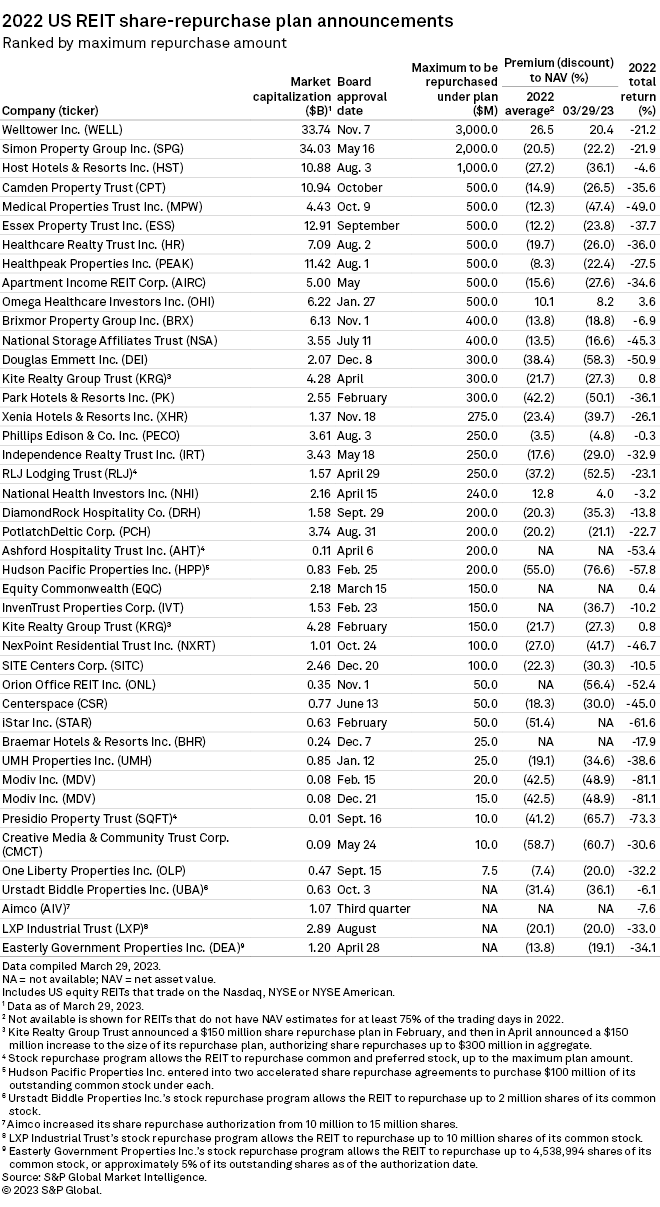
The table below provides a list of equity REITs that have announced share repurchase plans. It is important to note that the announcement of such a plan does not guarantee that the maximum repurchase amount will be achieved or even that a REIT will execute any portion of the plan since the timing and quantity of repurchases will be heavily dependent upon market conditions. However, it does indicate that a REIT intends to capitalize on the mispricing of its own securities and provides a potential opportunity for NAV accretion.
It is always a very important part of due diligence to evaluate REIT balance sheets and to closely monitor capital management activities. However, which capital management activities a REIT should engage in is very different when at a favorable NAV premium vs. a large NAV discount. REIT management teams that are acting in the best interest of their shareholders will adjust their strategies according to market conditions and cost of capital and they will evaluate the opportunity cost of any decision. If there is a lack of alignment with shareholders, however, capital management activities may align more with executive compensation structure (for example assets under management ((AUM)) and less with NAV/FFO accretion or balance sheet strengthening. The challenges and opportunities for REITs have changed dramatically since the end of 2021 when valuations for many REITs were inflated. Before investing in a REIT, investors would be wise to evaluate whether that REIT’s strategy appropriately reflects the current environment and whether their balance sheet is strong enough to successfully implement that strategy.
For further details see:
The State Of REITs: April 2023 Edition