JBGS - The State Of REITs: December 2023 Edition
2023-12-28 22:45:15 ET
Summary
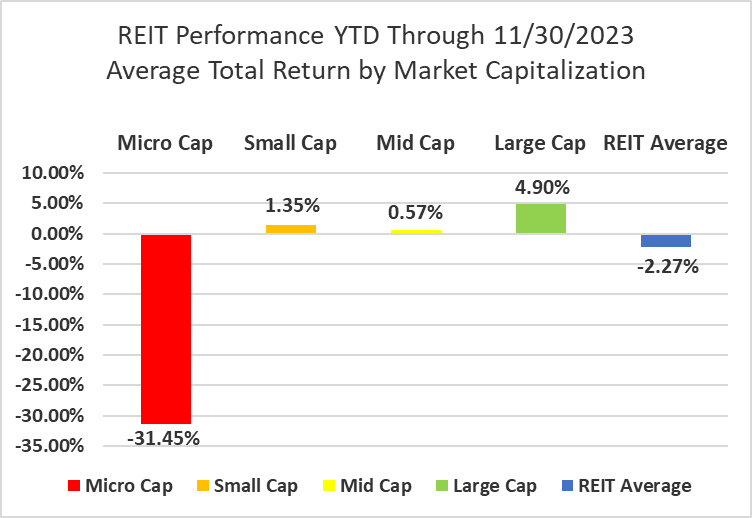
- The REIT sector averaged a +9.50% total return in November, but remains in negative territory year to date (-2.27%).
- Large cap REITs (+11.54%) outperformed again in November. Micro caps (+3.30%) finally had a month in the black, but continue to badly underperform their larger peers.
- 90.2% of REIT securities had a positive total return in November, but only 42.5% are in the black year to date.
- All 18 REIT property types averaged a positive total return in November, led by Advertising (+25.75%) and Office (+15.80%), while Malls (+1.51%) and Shopping Centers (+2.89%) lagged.
- The average REIT NAV discount narrowed from -28.17%to -20.50% during November. The median NAV discount narrowed from -27.94% to-19.74%.
REIT Performance
The REIT sector soared in November after 3 straight months in the red. The average REIT total return in November outpaced than that of the Dow Jones Industrial Average (+9.2%) and S&P 500 (9.1%), but fell short of the double digit return of the NASDAQ (+10.8%). The market cap weighted Vanguard Real Estate ETF ( VNQ ) outperformed the average REIT in November (+12.08% vs. +9.50%) and has also outperformed YTD (+2.15% vs. -2.27%). The spread between the 2023 FFO multiples of large cap REITs (16.4x) and small cap REITs (12.6x) narrowed slightly in November as multiples expanded 1.1 turns for large caps and 1.2 turns for small caps. Investors currently need to pay an average of 30.2% more for each dollar of FFO from large cap REITs relative to small cap REITs. In this monthly publication, I will provide REIT data on numerous metrics to help readers identify which property types and individual securities currently offer the best opportunities to achieve their investment goals.
Graph by Simon Bowler of 2nd Market Capital, Data compiled from S&P Global Market Intelligence LLC. See important notes and disclosures at the end of this article
In November micro cap REITs (+3.30%) continued to badly underperform their larger peers. Large caps (+11.54%) averaged the largest total return followed by strong performances from both mid caps (+10.35%) and small caps (+9.69%). Large cap REITs (+4.90%) are outperforming small caps (+1.35%) by 355 basis points on YTD 2023 total return.
Graph by Simon Bowler of 2nd Market Capital, Data compiled from S&P Global Market Intelligence LLC. See important notes and disclosures at the end of this article
18 out of 18 Property Types Yielded Positive Total Returns in November
100% percent of REIT property types averaged a positive total return in November. There was a sizeable 24.24% total return spread between the best and worst performing property types. Advertising (+25.75%) and Office (15.80%) outperformed all other REIT property types in November.
Malls (+1.51%) and Shopping Centers (+2.89%) saw the smallest gains in November. Malls were dragged down by the dismal performance of Pennsylvania REIT ( PRET ) (-40.94%), which offset the strong outperformance of the other mall REITs: Macerich (+19.97%), Simon Property Group ( SPG ) (+13.65%) and CBL Properties ( CBL ) (+13.36%).
Table by Simon Bowler of 2nd Market Capital, Data compiled from S&P Global Market Intelligence LLC. See important notes and disclosures at the end of this article
Despite a +7.29% average total return in November, Infrastructure remains the worst performing REIT property type year to date (-28.46%). Land (-16.01%), Office (-14.11%) and Malls (-13.86%) have also averaged double digit negative returns in 2023. The number of REIT property types in the black year to date increased from 3 to 7 in November. Data Centers (+34.28%), Single Family Housing (+19.41%) and Health Care (+18.80%) are significantly outpacing all other REIT property types.
Table by Simon Bowler of 2nd Market Capital, Data compiled from S&P Global Market Intelligence LLC. See important notes and disclosures at the end of this article
The REIT sector as a whole saw the average P/FFO (2024Y) increase 1.1 turns in November from 11.4x up to 12.5x. The average REIT saw multiple expansion in 100% of property types in November. Land (40x), Data Centers (24.6x), Single Family Housing (19.2x), Manufactured Housing (18.6x) and Timber (18.3x) currently trade at the highest average multiples among REIT property types. Malls (5.6x), Office (7.5x), Hotels (7.8x), Advertising (9.6x) and Diversified REITs (9.8x) all trade at single digit FFO multiples.
Table by Simon Bowler of 2nd Market Capital, Data compiled from S&P Global Market Intelligence LLC. See important notes and disclosures at the end of this article
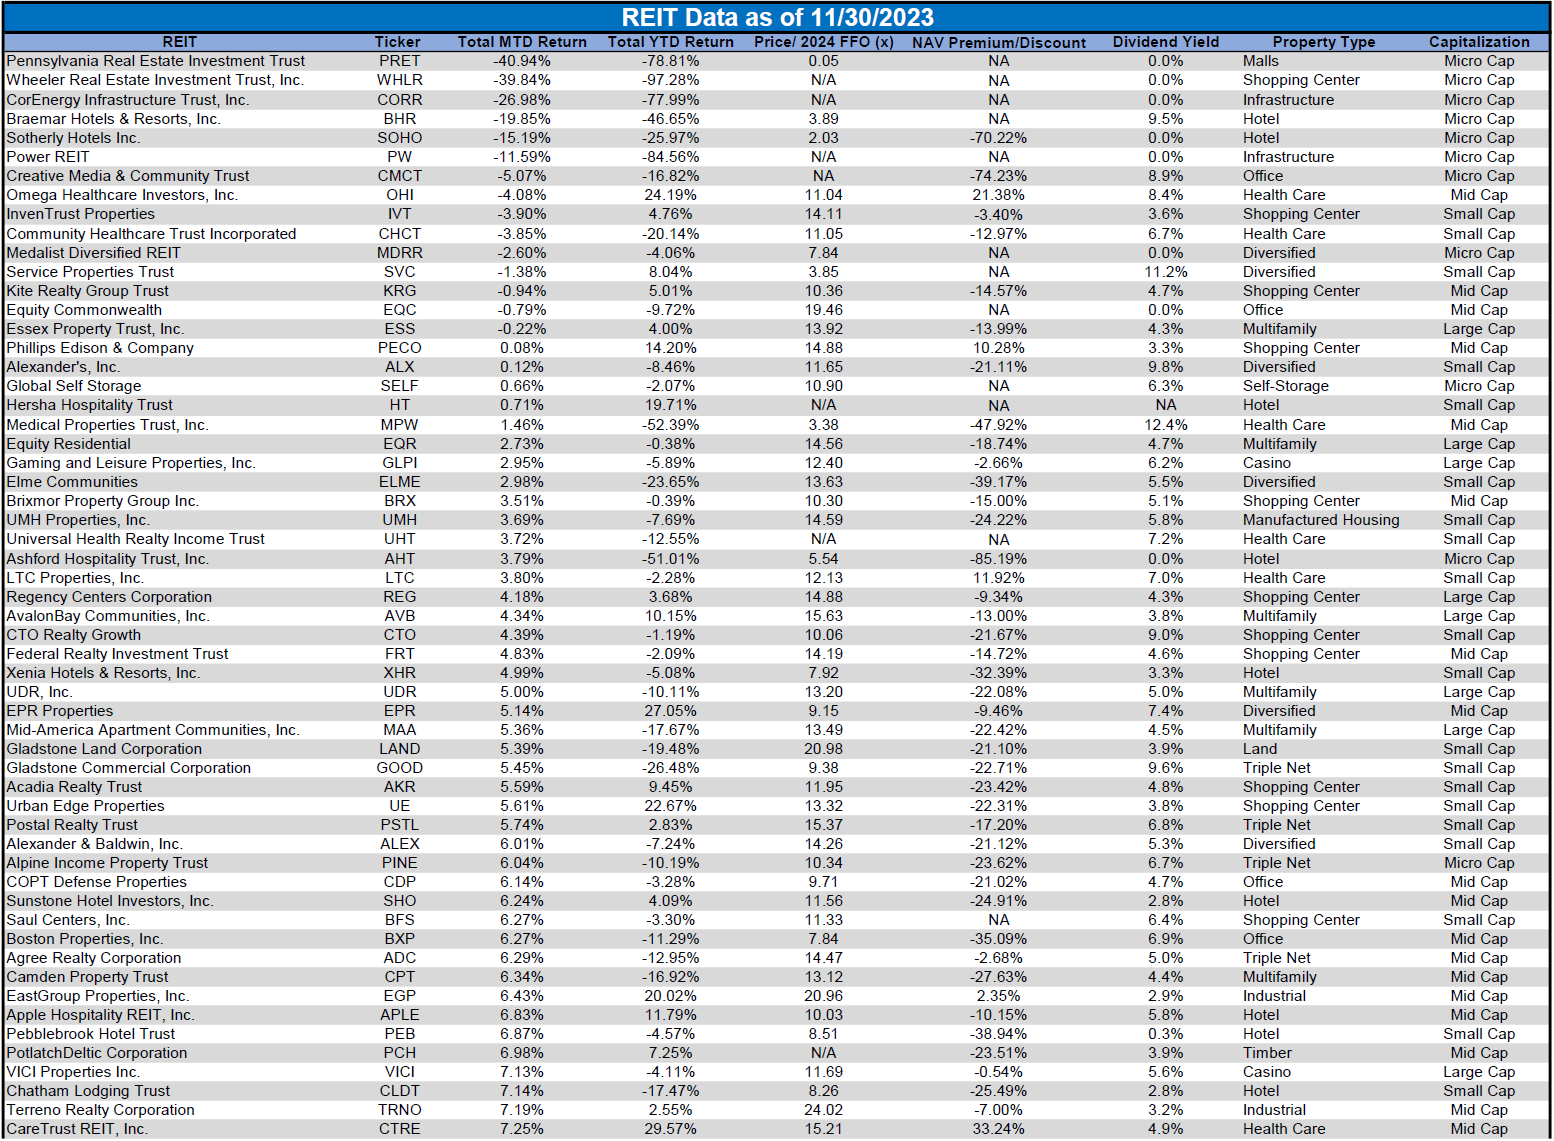
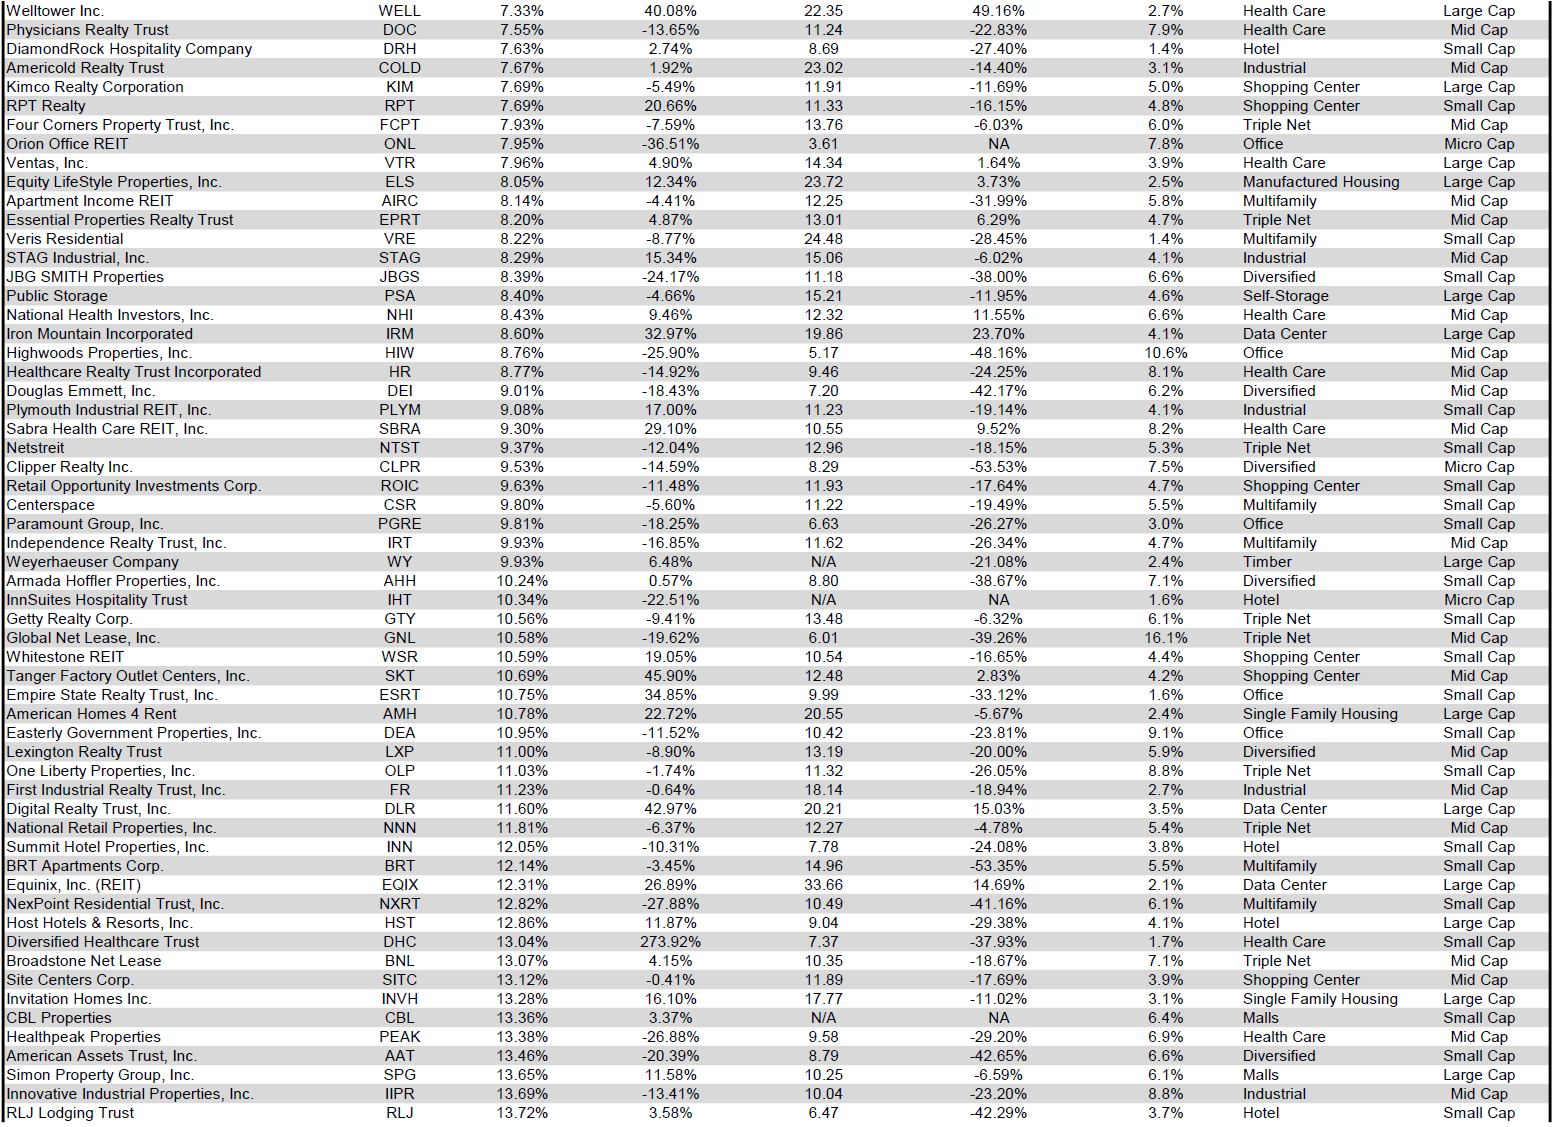
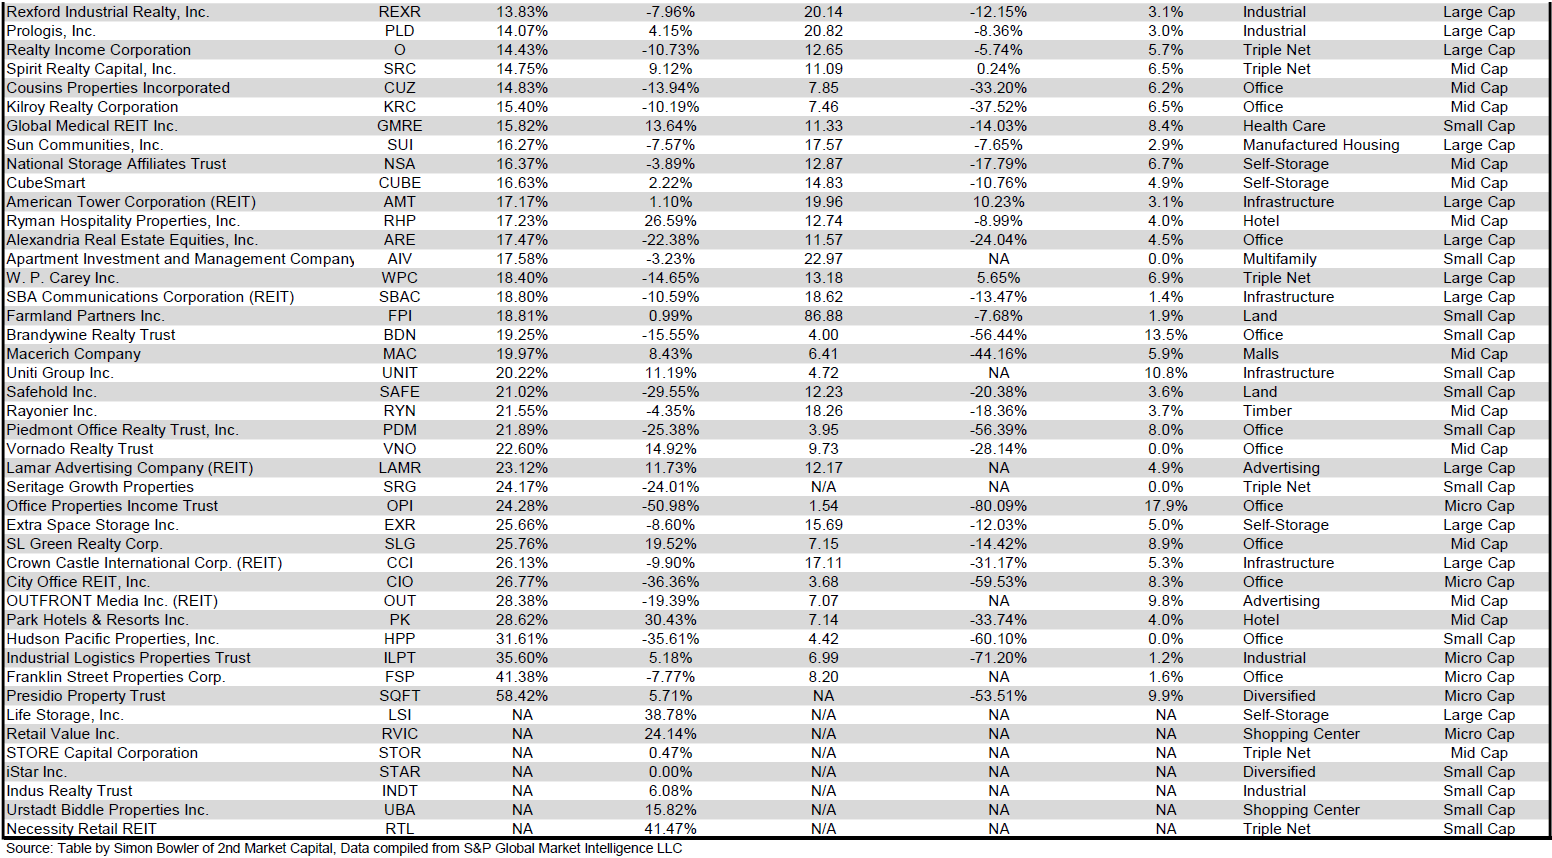
Performance of Individual Securities
Presidio Property Trust ( SQFT ) (+58.42%) was the best performing REIT in November, sharply rebounding after a rough first 10 months of the year. SQFT is now back in the black in 2023 with a +5.71% YTD total return.
Pennsylvania REIT ( PRET ) (-40.94%) plummeted after the release of Q3 earnings that revealed yet another brutal quarter, which signaled little chance of staving off a 2nd bankruptcy. PRET is now the 2 nd worst performing REIT of 2023 (-78.81%), outperforming only the -97.28% trainwreck total return of Wheeler REIT ( WHLR ).
90.20% of REITs had a positive total return in November with only 42.50% in the black year to date. During the first 11 months of last year the average REIT had a -18.42% return. During the first 11 months of this year the average REIT has endured much smaller losses with a -2.27% average total return.
Table by Simon Bowler of 2nd Market Capital, Data compiled from S&P Global Market Intelligence LLC. See important notes and disclosures at the end of this article Table by Simon Bowler of 2nd Market Capital, Data compiled from S&P Global Market Intelligence LLC. See important notes and disclosures at the end of this article Table by Simon Bowler of 2nd Market Capital, Data compiled from S&P Global Market Intelligence LLC. See important notes and disclosures at the end of this article
For the convenience of reading this table in a larger font, the table above is available as a PDF as well .
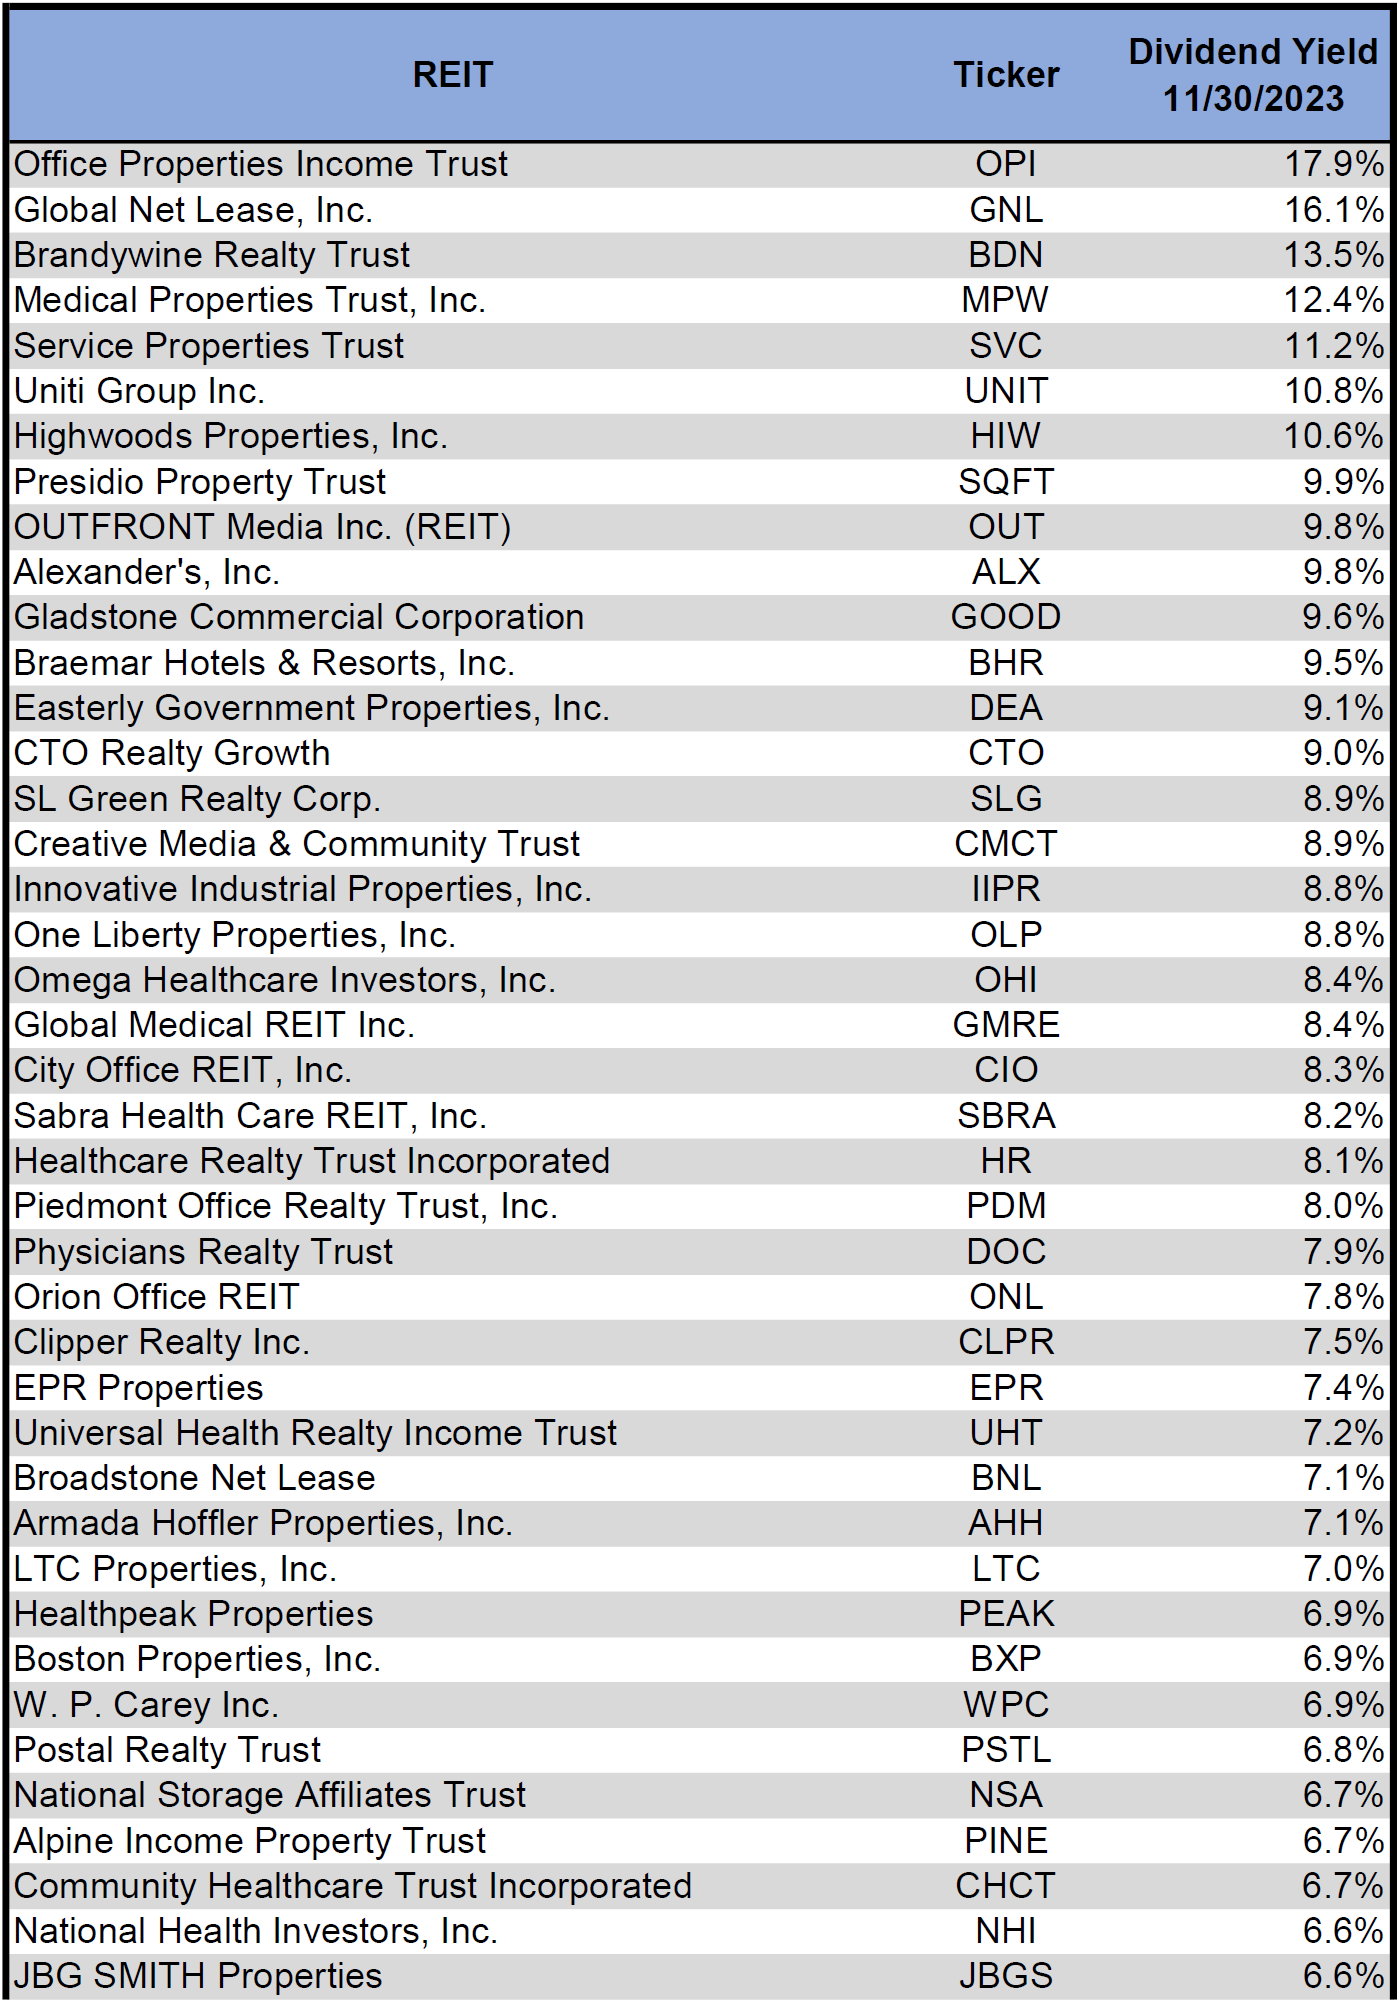
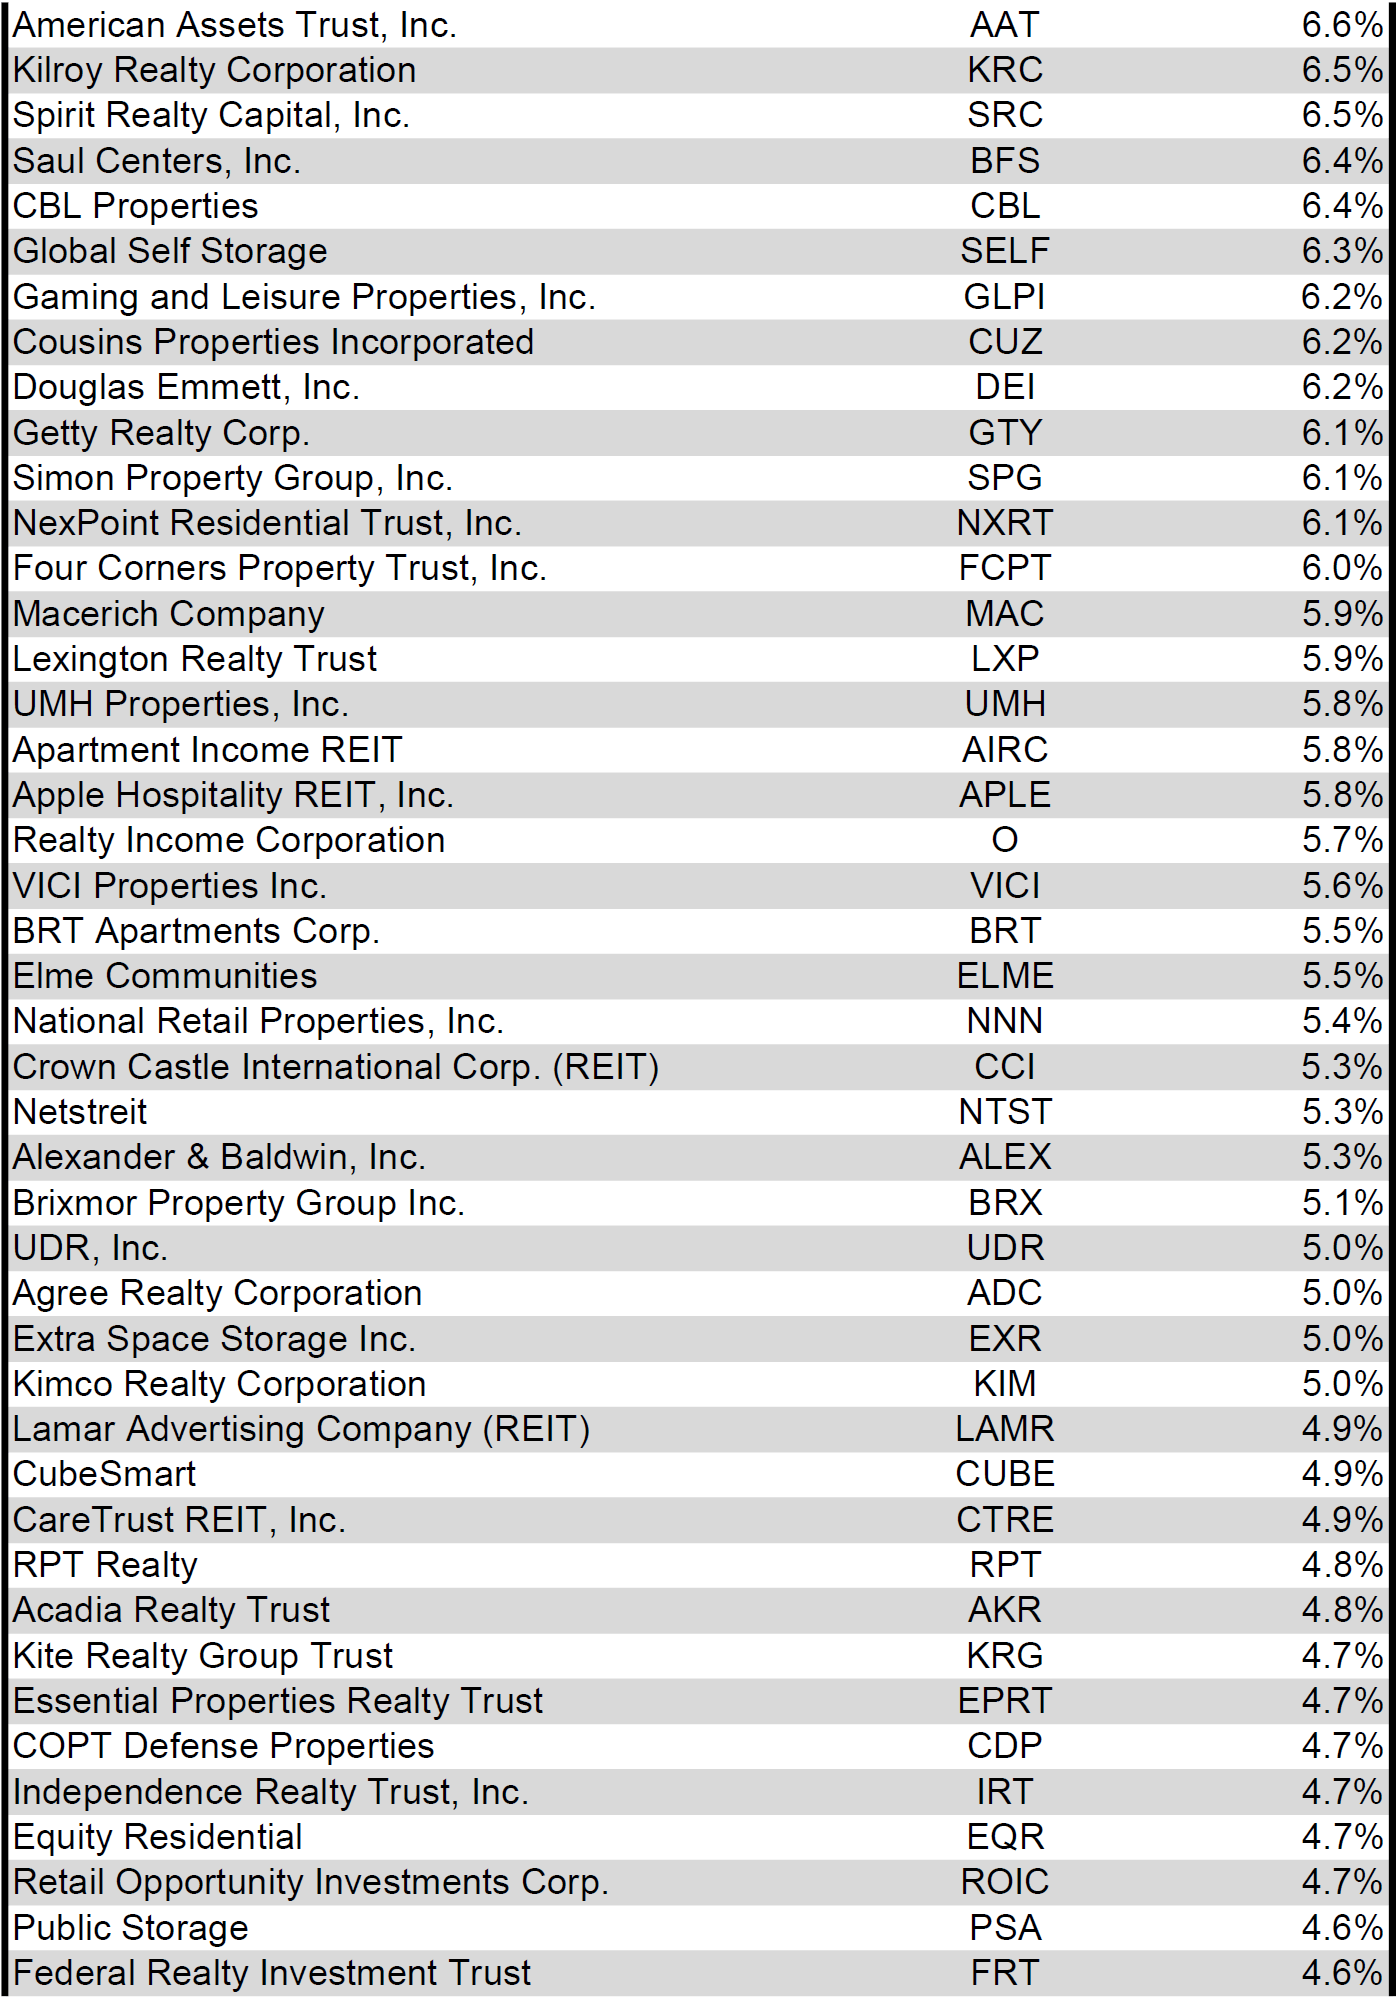
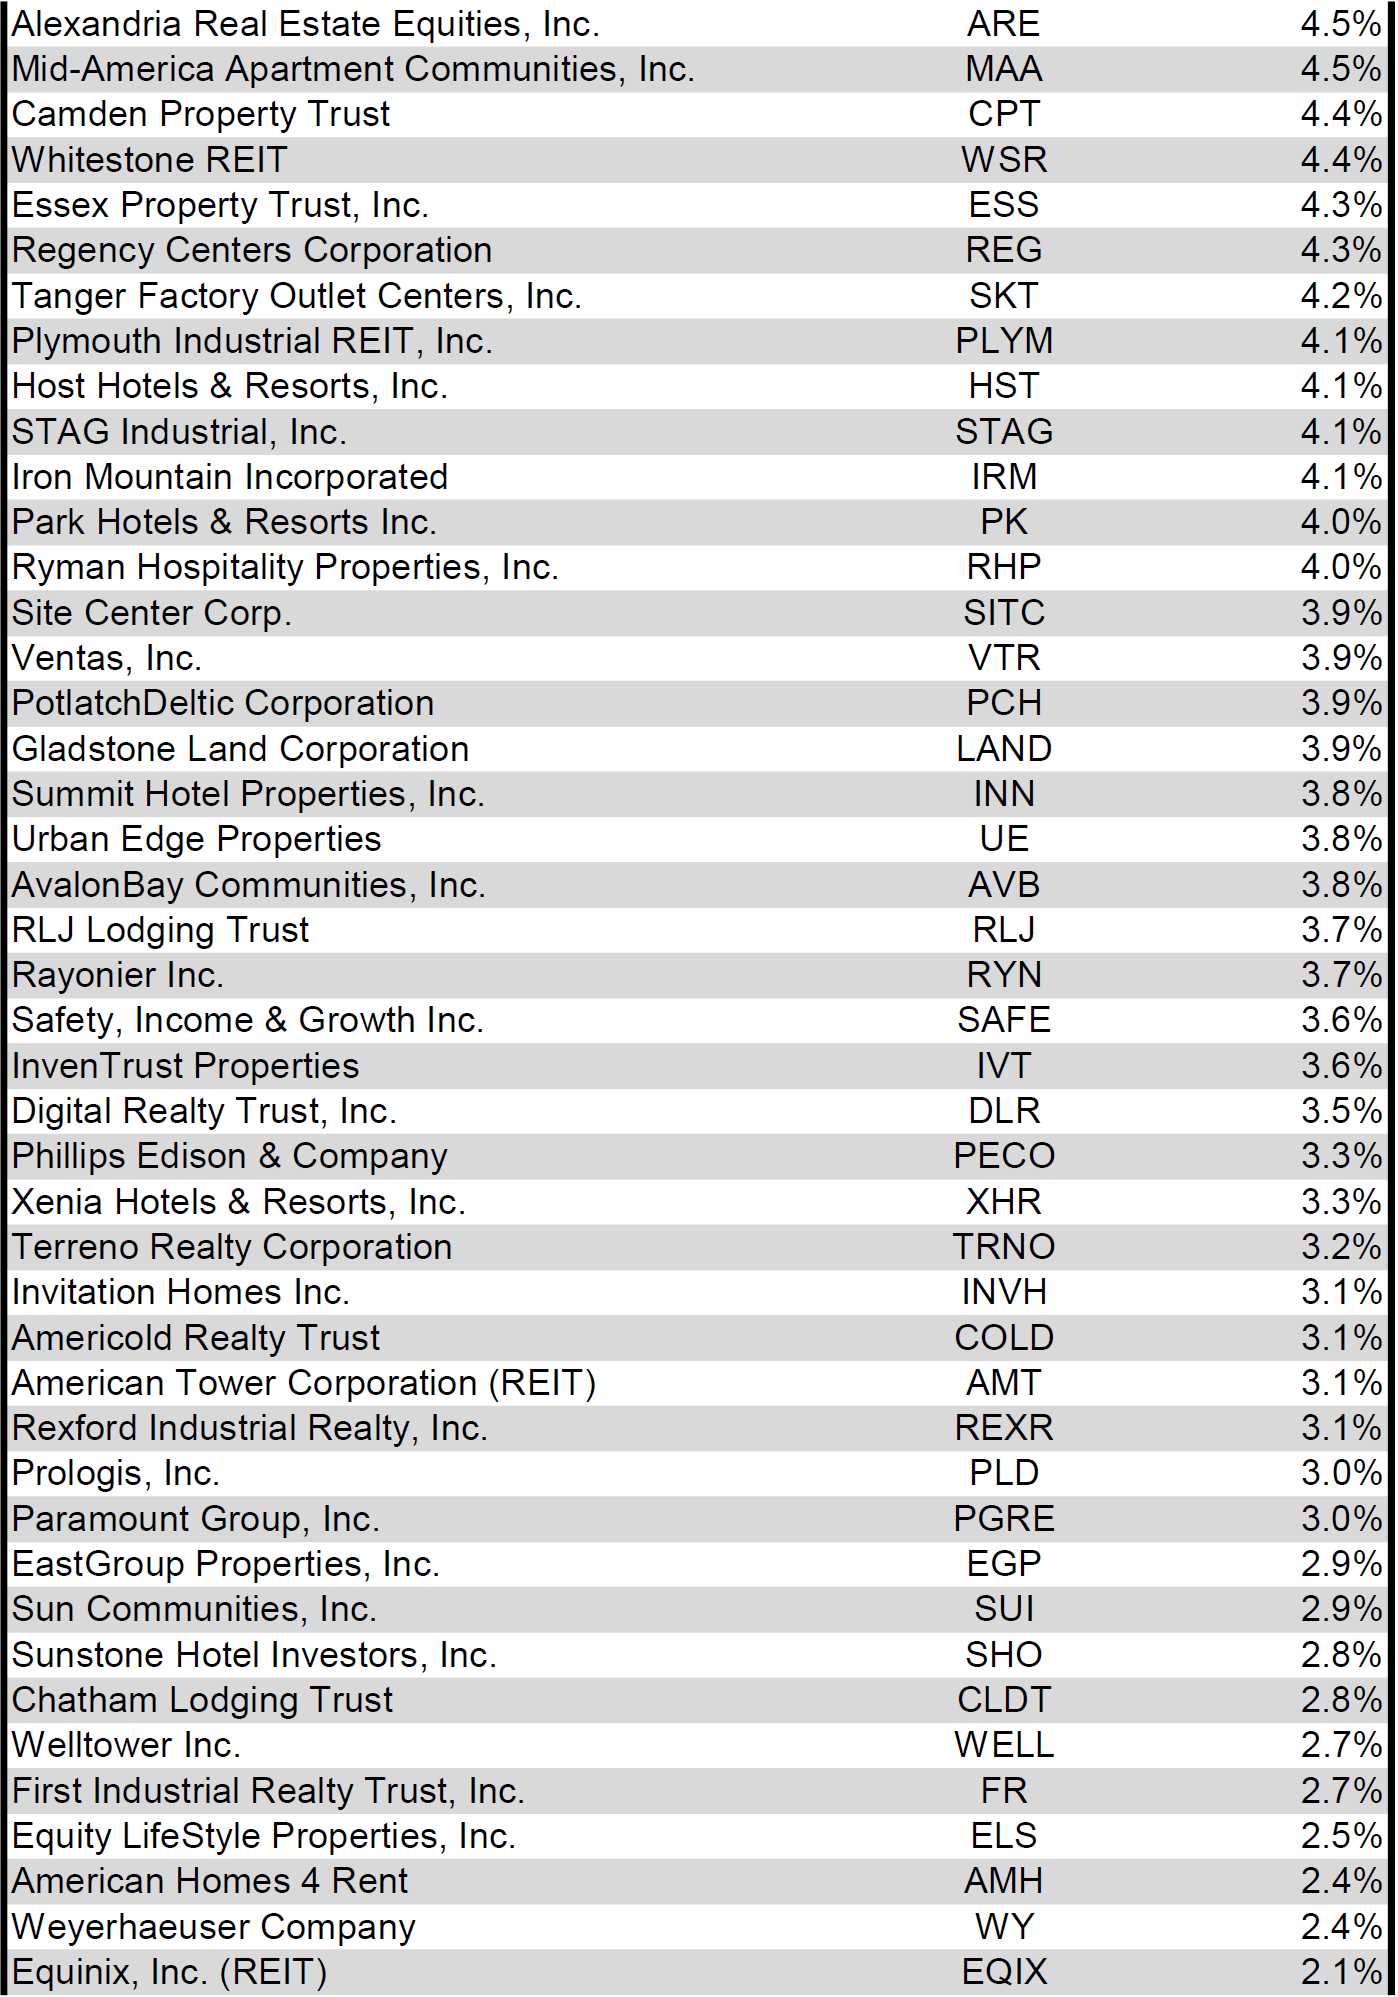
Dividend Yield
Dividend yield is an important component of a REIT's total return. The particularly high dividend yields of the REIT sector are, for many investors, the primary reason for investment in this sector. As many REITs are currently trading at share prices well below their NAV, yields are currently quite high for many REITs within the sector. Although a particularly high yield for a REIT may sometimes reflect a disproportionately high risk, there exist opportunities in some cases to capitalize on dividend yields that are sufficiently attractive to justify the underlying risks of the investment. I have included below a table ranking equity REITs from highest dividend yield (as of 11/30/2023) to lowest dividend yield.
Table by Simon Bowler of 2nd Market Capital, Data compiled from S&P Global Market Intelligence LLC. See important notes and disclosures at the end of this article Table by Simon Bowler of 2nd Market Capital, Data compiled from S&P Global Market Intelligence LLC. See important notes and disclosures at the end of this article Table by Simon Bowler of 2nd Market Capital, Data compiled from S&P Global Market Intelligence LLC. See important notes and disclosures at the end of this article Table by Simon Bowler of 2nd Market Capital, Data compiled from S&P Global Market Intelligence LLC. See important notes and disclosures at the end of this article
For the convenience of reading this table in a larger font, the table above is available as a PDF as well .
Although a REIT’s decision regarding whether to pay a quarterly dividend or a monthly dividend does not reflect on the quality of the company’s fundamentals or operations, a monthly dividend allows for a smoother cash flow to the investor. Below is a list of equity REITs that pay monthly dividends ranked from highest yield to lowest yield.
Table by Simon Bowler of 2nd Market Capital, Data compiled from S&P Global Market Intelligence LLC. See important notes and disclosures at the end of this article
Valuation
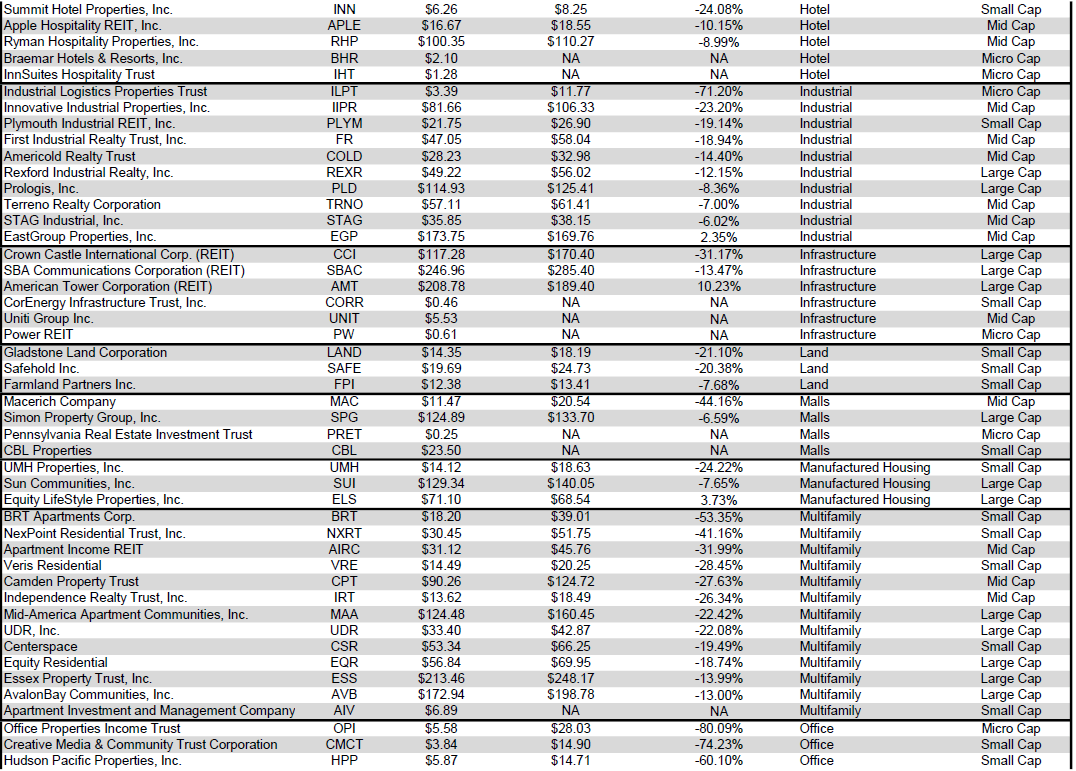
REIT Premium/Discount to NAV by Property Type
Below is a downloadable data table, which ranks REITs within each property type from the largest discount to the largest premium to NAV. The consensus NAV used for this table is the average of analyst NAV estimates for each REIT. Both the NAV and the share price will change over time, so I will continue to include this table in upcoming issues of The State of REITs with updated consensus NAV estimates for each REIT for which such an estimate is available.
Table by Simon Bowler of 2nd Market Capital, Data compiled from S&P Global Market Intelligence LLC. See important notes and disclosures at the end of this article Table by Simon Bowler of 2nd Market Capital, Data compiled from S&P Global Market Intelligence LLC. See important notes and disclosures at the end of this article Table by Simon Bowler of 2nd Market Capital, Data compiled from S&P Global Market Intelligence LLC. See important notes and disclosures at the end of this article Table by Simon Bowler of 2nd Market Capital, Data compiled from S&P Global Market Intelligence LLC. See important notes and disclosures at the end of this article
For the convenience of reading this table in a larger font, the table above is available as a PDF as well .
Takeaway
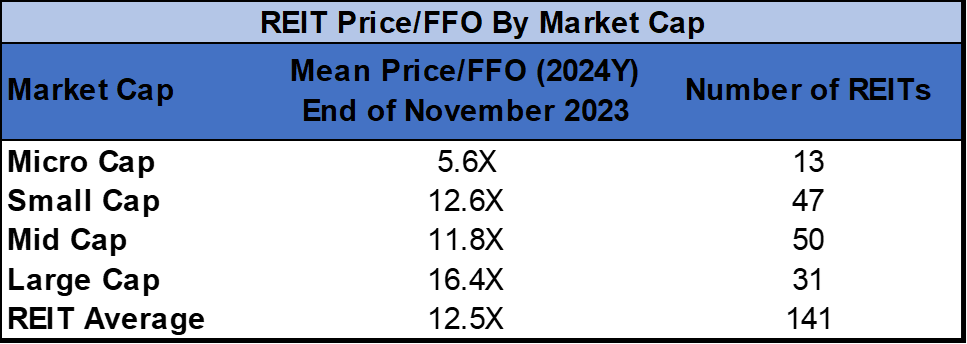
The large cap REIT premium (relative to small cap REITs) narrowed in November and investors are now paying on average about 30% more for each dollar of 2024 FFO/share to buy large cap REITs than small cap REITs (16.4x/12.6x - 1 = 30.2%). As can be seen in the table below, there is presently a strong positive correlation between market cap and FFO multiple.
Table by Simon Bowler of 2nd Market Capital, Data compiled from S&P Global Market Intelligence LLC. See important notes and disclosures at the end of this article
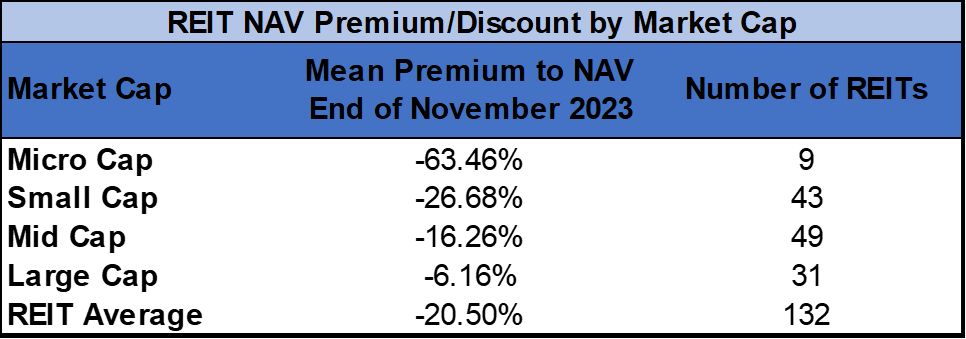
The table below shows the average NAV premium/discount of REITs of each market cap bucket. This data, much like the data for price/FFO, shows a strong, positive correlation between market cap and Price/NAV. The average large cap REIT (-6.16%) trades at a single digit discount to NAV. Mid cap REITs (-16.26%) trade at a mid-teens discount to NAV, while small cap REITs (-26.68%) trade at just under 3/4 of NAV. Micro caps on average trade at just over 1/3 of their respective NAVs (-63.46%).
Table by Simon Bowler of 2nd Market Capital, Data compiled from S&P Global Market Intelligence LLC. See important notes and disclosures at the end of this article
In November the pace of bankruptcy filings decelerated from recent highs, but still marked the 14 th straight month of year-over-year increases in filings. After the first 11 months of the year, 2023 has already surpassed the number of bankruptcy filings in any year since 2012, excluding 2020 which saw elevated filings during the government lockdowns. The Fed has signaled that there may be rate cuts coming in 2024, which could help to reduce the cost of capital for struggling businesses. However, the timing and magnitude of cuts is still uncertain, so bankruptcies may remain elevated over upcoming months.
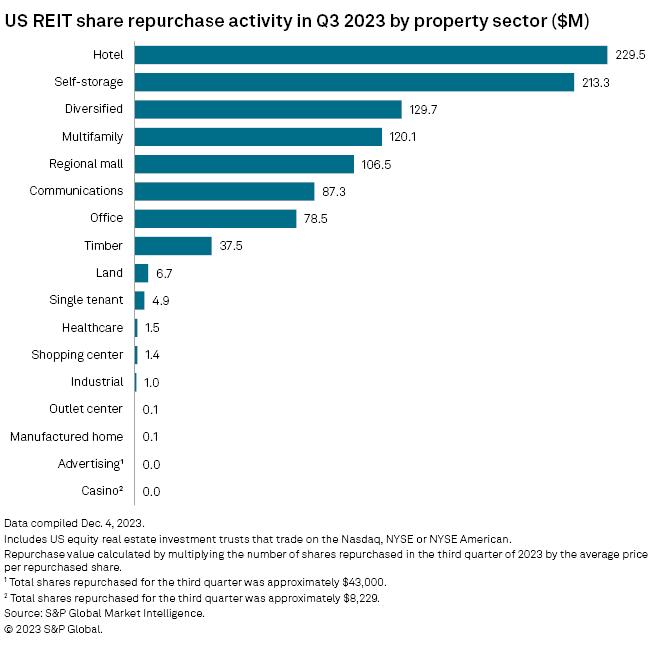
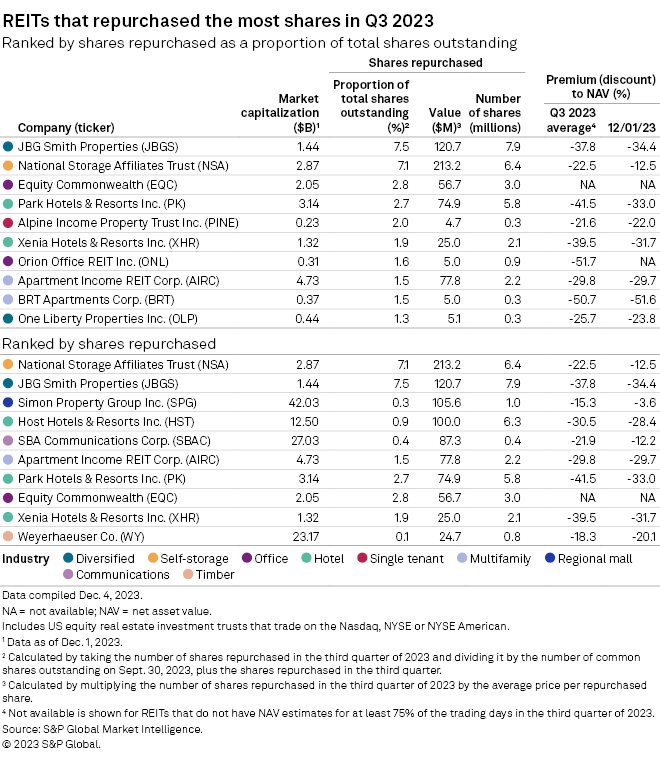
Although a decline in share price can feel painful for shareholders in the short-term, it can also present an accretive opportunity for REITs. When REITs trade materially below NAV, they have the opportunity to increase NAV by buying back shares at a discount. It is a common and effective practice by well-managed REITs to capitalize on pricing disparities by issuing new shares when trading at a premium to NAV and buying back shares when trading at a discount. Q3 2023 saw a year-over-year increase in share repurchase activity as REITs sought to take advantage of wide spreads between NAV and share price.
The property types that saw the greatest volume of share buybacks were Hotels, Self Storage, Diversified, Multifamily and Mall REITs. Advertising and Casino REITs engaged in minimal share repurchase activity.
National Storage Affiliates Trust ( NSA ), JBG Smith Properties ( JBGS ), Simon Property Group ( SPG ) and Host Hotels & Resorts ( HST ) each repurchased over $100M of shares during Q3. JBGS and NSA bought back the largest portion of their outstanding shares with 7.5% and 7.1% of outstanding shares repurchased respectively.
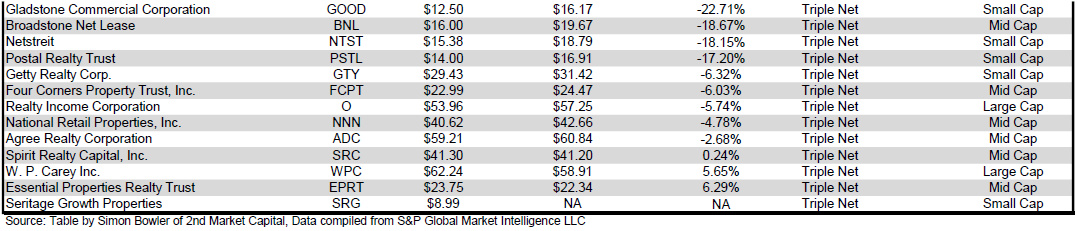
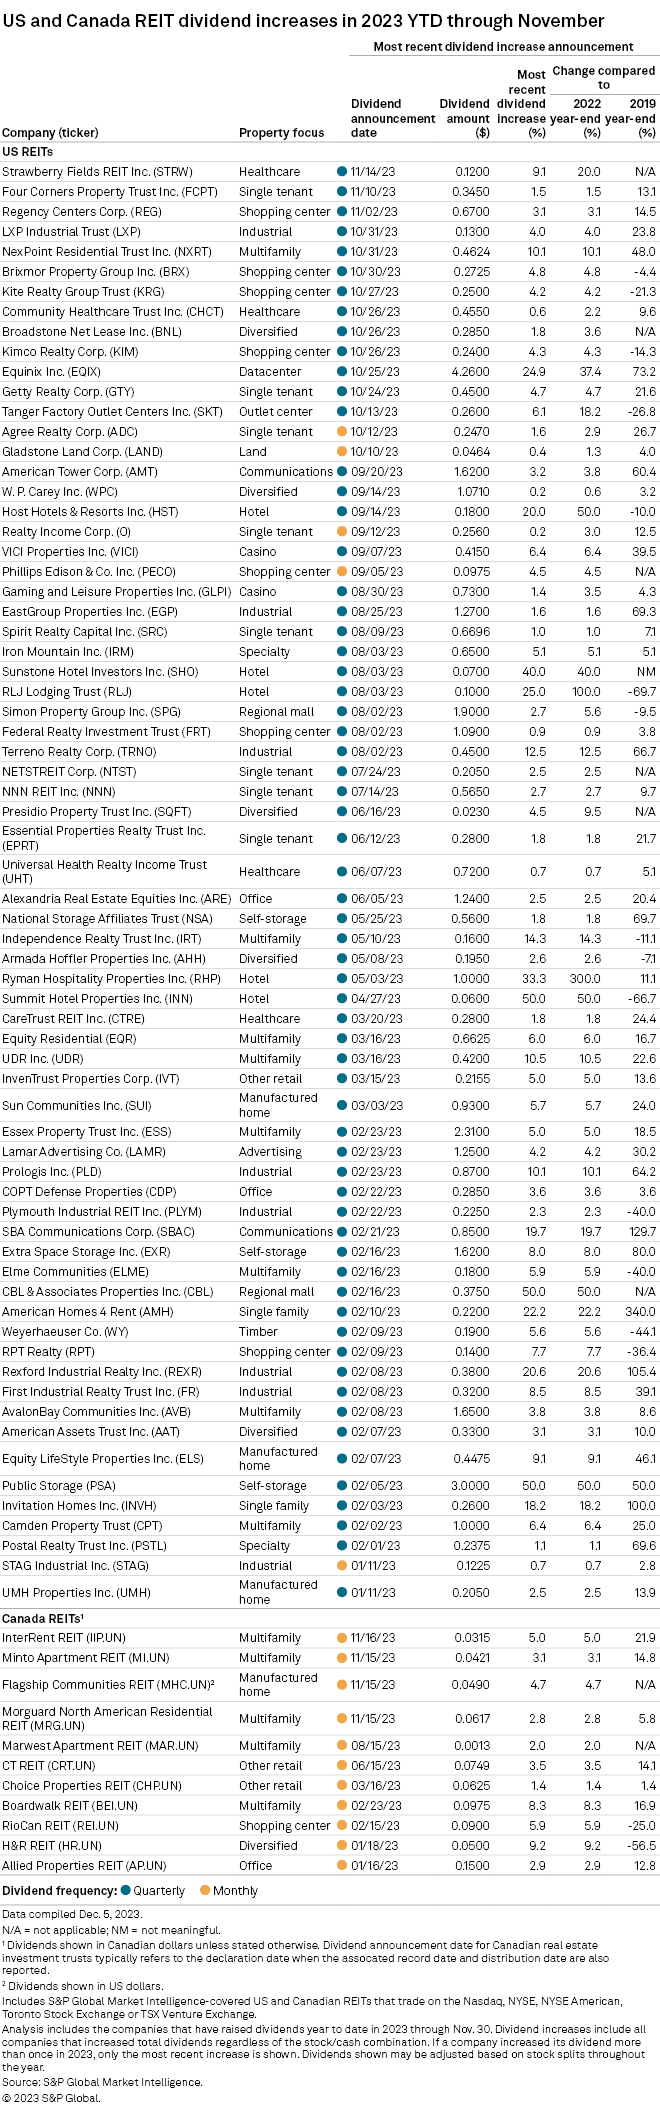
3 REITs announced dividend hikes in November. Strawberry Fields REIT ( STRW ) had the largest increase of +9.1% followed by +3.1% for Regency Centers ( REG ) and +1.5% for Four Corners Property Trust ( FCPT ).
If projected Fed rate cuts play out in 2024, the dividend yields of many REITs could become increasingly attractive relative to declining treasury yields. With 114 REITs trading at a discount to NAV and 69 REITs having raised their dividend this year, the REIT sector remains well-positioned for further gains. However, the balance sheets and fundamentals of individual REITs range from very poor to stellar, so in order to successfully maximize total return in REIT investment it is essential to analyze the opportunity and risk that each specific REIT presents.
For further details see:
The State Of REITs: December 2023 Edition