BYRE - The State Of REITs: July 2023 Edition
2023-07-26 15:22:58 ET
Summary
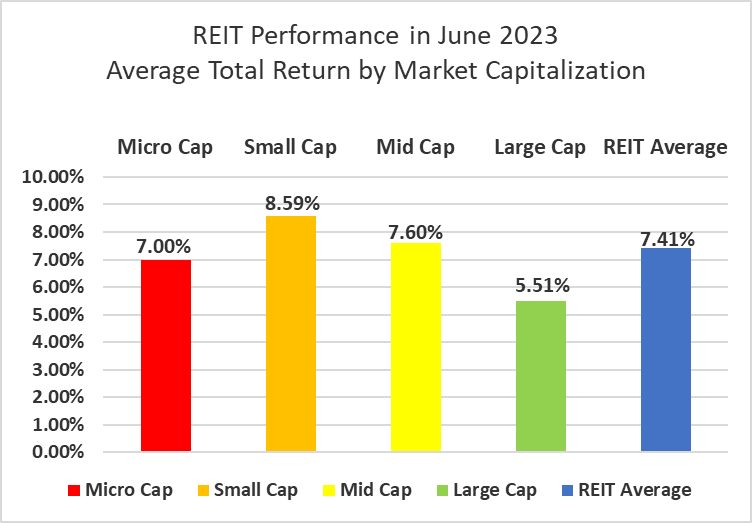
- After 4 straight months in the red, the REIT sector surged back into the black year to date with a stellar +7.41% total return in June.
- Small cap REITs (+8.59%) outperformed again in June. Large caps (+5.51%) again underperformed their smaller REIT peers in June.
- A remarkable 87.34% of REIT securities had a positive total return in June with 49.69% in the black year to date.
- Timber (+13.49%), Advertising (+11.99%) and Office (+11.95%) outperformed other REIT property types in June. Land (+1.30%), Self-Storage (+2.32%) and Casino (+2.50%) REITs averaged the smallest gains.
- The average REIT NAV discount narrowed from-26.57% to -22.44% during June. The median NAV discount narrowed from -24.41% to -20.48%.
REIT Performance
The REIT sector ended a four-month slide with a strong total return rebound in June. REITs (+7.41%) solidly outperformed the S&P 500 (+5.98%), NASDAQ (+5.92%) and Dow Jones Industrial Average (+4.35%). The market cap weighted Vanguard Real Estate ETF ( VNQ ) underperformed the average REIT in June (+5.62% vs. +7.41%), but has outperformed YTD (+3.44% vs. +0.46%). The spread between the 2023 FFO multiples of large cap REITs (17.2x) and small cap REITs (11.7x) remained flat in June as multiples expanded 0.5 turns for large caps and 0.5 turns for small caps. Investors currently need to pay an average of 47.0% more for each dollar of FFO from large cap REITs relative to small cap REITs. In this monthly publication, I will provide REIT data on numerous metrics to help readers identify which property types and individual securities currently offer the best opportunities to achieve their investment goals.
Source: Graph by Simon Bowler of 2nd Market Capital, Data compiled from S&P Global Market Intelligence LLC. See important notes and disclosures at the end of this article
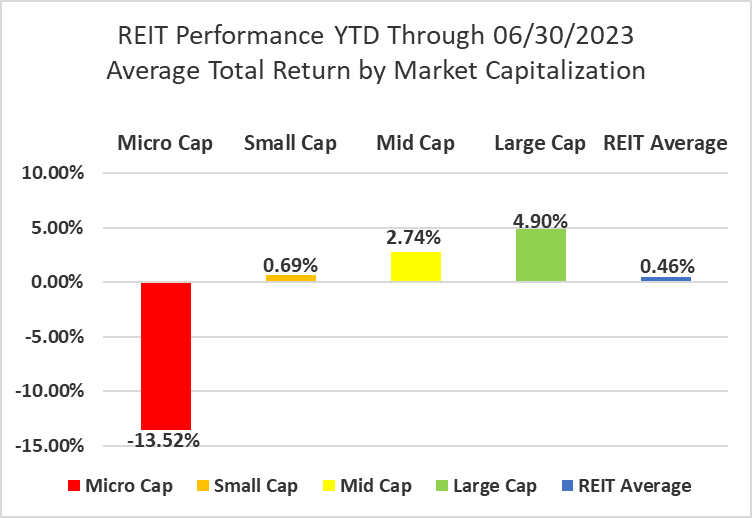
Large cap REITs (+5.51%) fell short of their smaller peers again in June. Small caps (+8.59%) led the REIT sector again in June, outpacing mid-caps (+7.60%) and micro caps (+7.00%). Despite back-to-back months of underperformance, Large cap REITs (+4.90%) are outperforming small caps (+0.69%) by 421 basis points on YTD 2023 total return.
Source: Graph by Simon Bowler of 2nd Market Capital, Data compiled from S&P Global Market Intelligence LLC. See important notes and disclosures at the end of this article
18 out of 18 Property Types Yielded Positive Total Returns in June
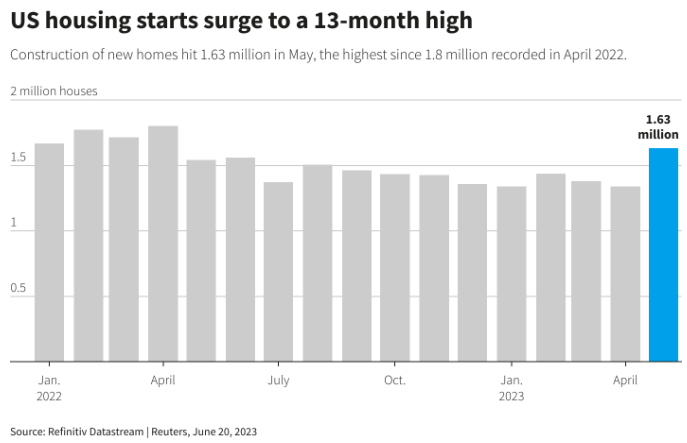
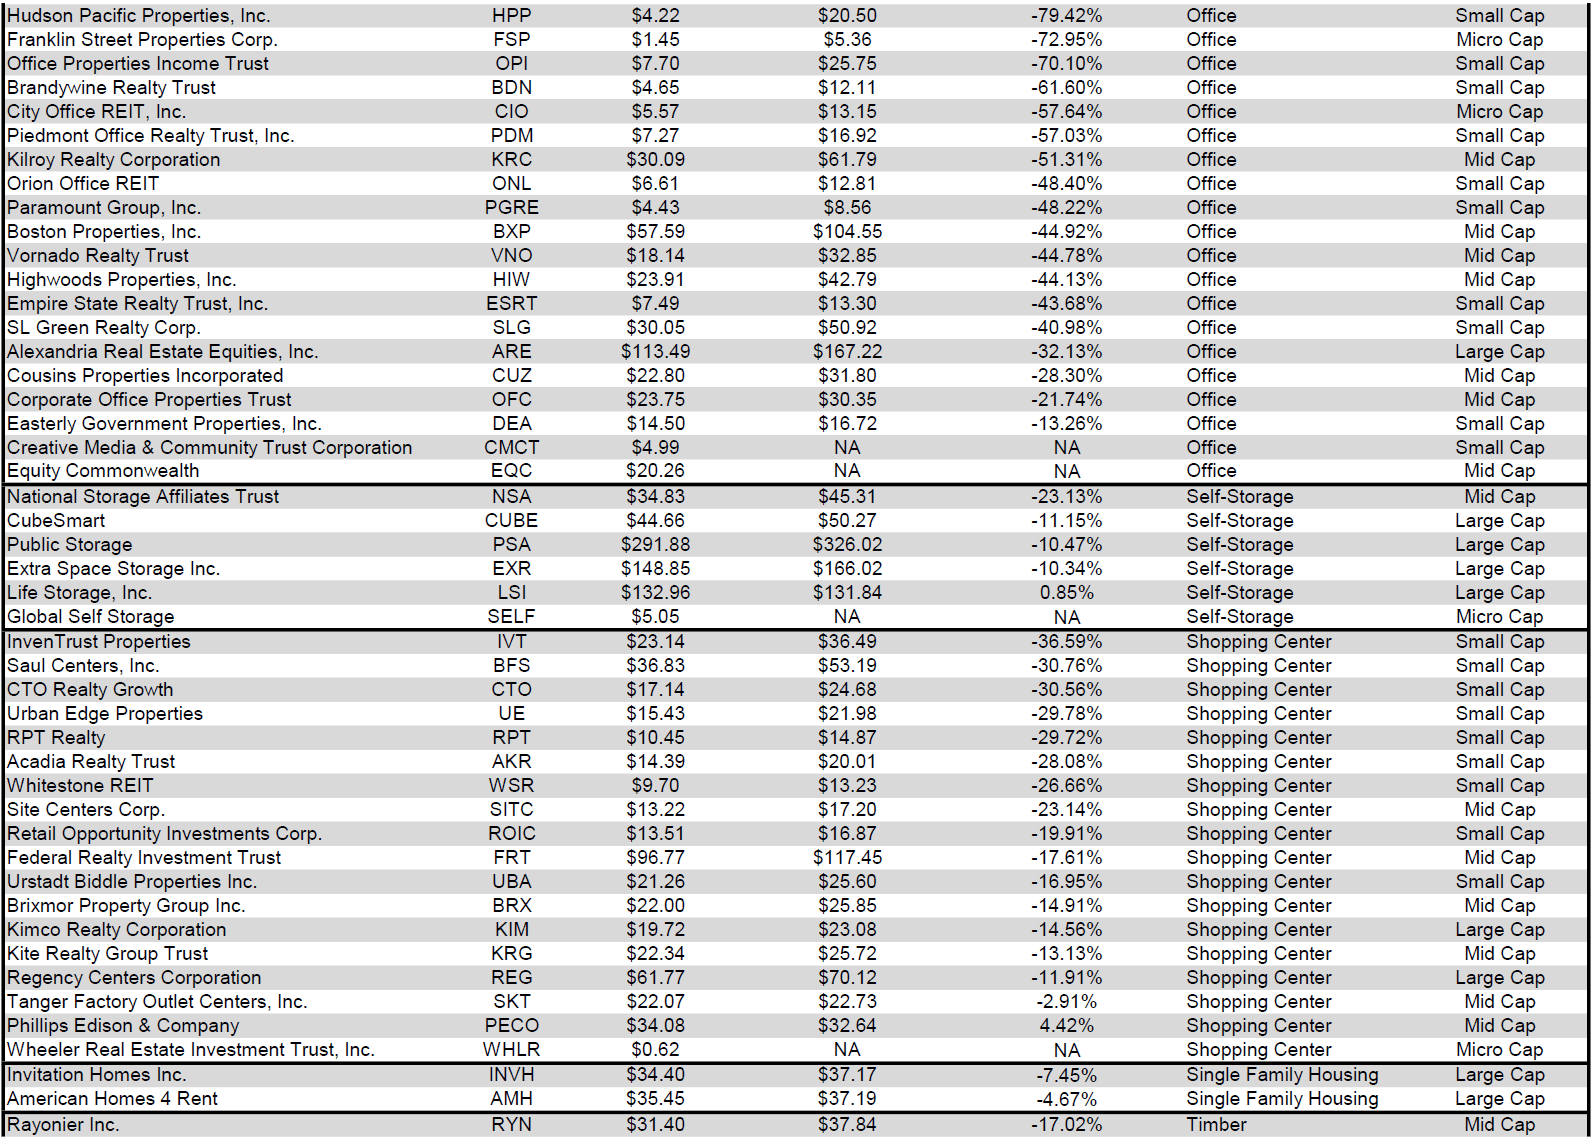
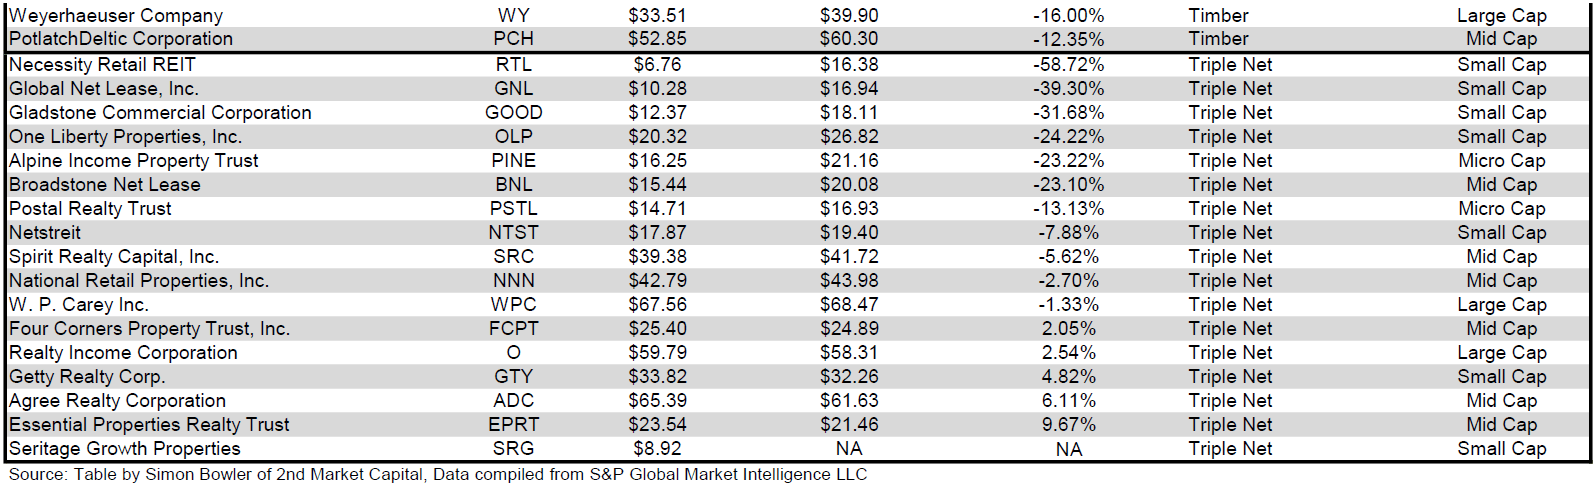
100% percent of REIT property types averaged a positive total return in June, with a 12.19% total return spread between the best and worst performing property types. Timber (+13.49%) and Advertising (+11.99%) were the best performing property types in June. Timber REITs soared in June fueled by a resurgence in new housing starts in May. Weyerhaeuser ( WY ) (+17.70%) and PotlatchDeltic ( PCH ) (+14.70%) had the biggest gains.
Land (+1.30%) and Self-Storage (+2.32%) saw the smallest gains in June. Land, Infrastructure and Casinos are the only REIT property types that had no REITs in positive territory in the first half of 2023. Farmland Partners ( FPI ) performed well in June (+8.11%), but remains slightly in the red YTD (-0.97%). Gladstone Land ( LAND ) and Safehold ( SAFE ) haven’t fared as well with double digit negative YTD total returns of -10.10% and -15.95% respectively.
Source: Table by Simon Bowler of 2nd Market Capital, Data compiled from S&P Global Market Intelligence LLC. See important notes and disclosures at the end of this article
Infrastructure (-25.39%) and Office REITs (-16.02%) continue to underperform and remain the worst performing property types thus far in 2023. Thanks to a strong June, the number of REIT property types in the black year to date increased from 5 to 10. Health Care REITs (+18.87%) lead all property types over the first half of the year, followed by double digit average returns in Single Family Housing (+18.55%), Data Centers (+17.88%), Self-Storage (+11.08%) and Timber (+10.65%).
Source: Table by Simon Bowler of 2nd Market Capital, Data compiled from S&P Global Market Intelligence LLC. See important notes and disclosures at the end of this article
The REIT sector as a whole saw the average P/FFO (2023Y) increase 0.5 turns in June from 12.6x up to 13.1x. The average FFO multiple expanded for 94.1% of property types and contracted for 5.9%. There are no recent 2023 FFO/share estimates for any of the Timber REITs. Land (31.6x), Data Centers (23.9x), Single Family Housing (20.5x) and Manufactured Housing (19.8x) currently trade at the highest average multiples among REIT property types. Malls (4.9x), Office (7.4x) and Hotels (7.7x) are the only REIT property types trading at single digit multiples.
Source: Table by Simon Bowler of 2nd Market Capital, Data compiled from S&P Global Market Intelligence LLC. See important notes and disclosures at the end of this article
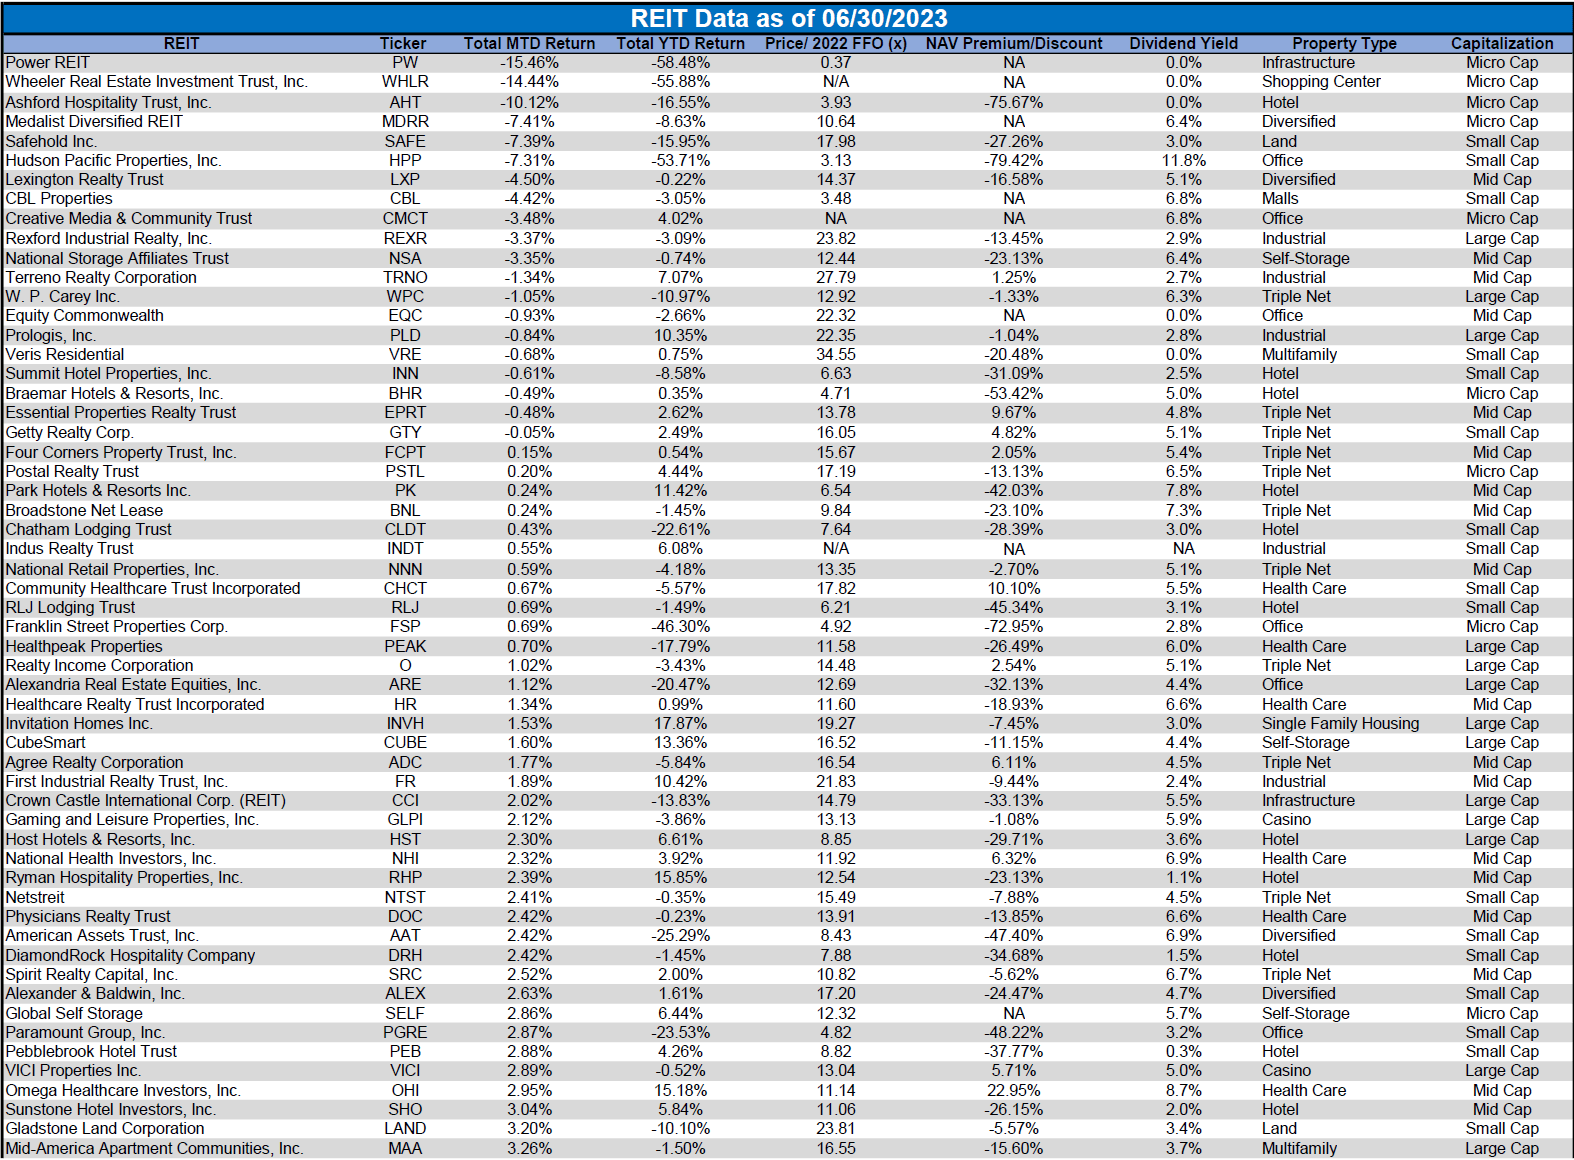
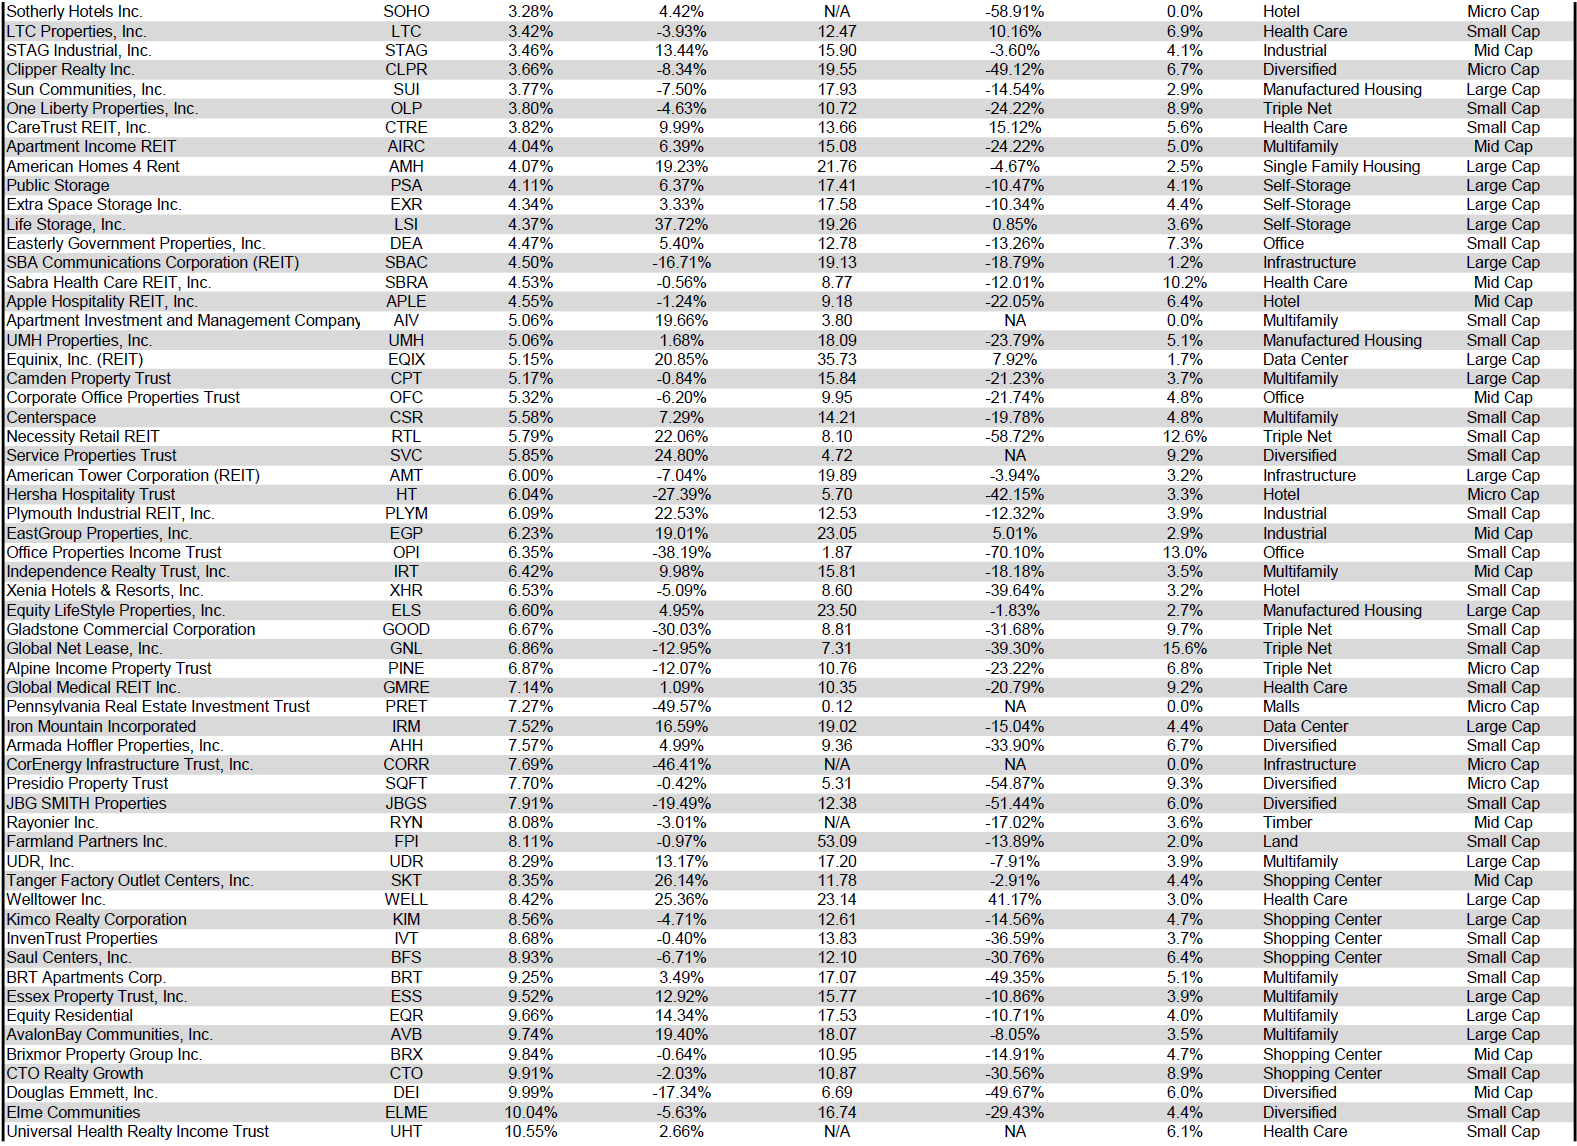
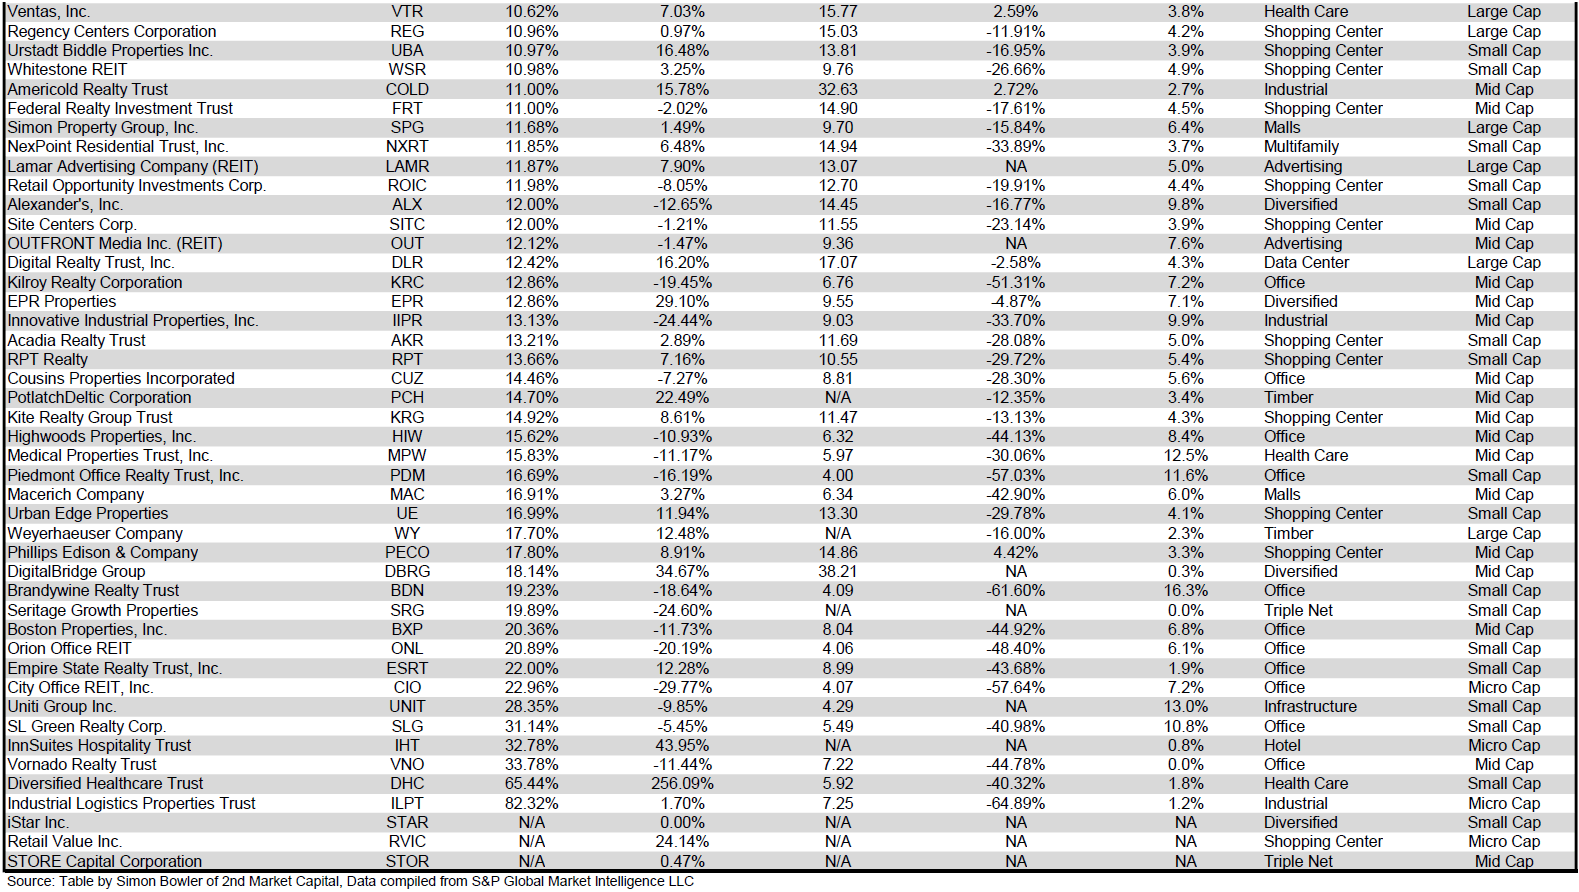
Performance of Individual Securities
Indus Realty Trust ( INDT ) was acquired on June 29 th by Centerbridge Partners and GIC Real Estate for $67/share. This was an all-cash transaction with a total purchase price of approximately $868M. Post-acquisition INDT is no longer publicly traded.
Industrial Logistics Properties Trust ( ILPT ) was one of the worst performing REITs during the February through May REIT selloff, suffering a brutal -58.74% total return during that stretch. However, ILPT fully reversed the declines from earlier in the year with a sharp rebound in June (+82.32%). This massive recovery brought ILPT to a +1.70% YTD return that is now slightly outpacing the average REIT (+0.46%).
Power REIT ( PW ) (-15.46%) continued to freefall in June, extending the slide that has driven the share price down -88.21% in the past 12 months. With no major news released for the REIT in June, there were no updates to suggest that PW’s tenant issues are being successfully resolved.
87.34% of REITs had a positive total return in June with 49.69% in the black year to date. During the first six months of last year the average REIT had a brutal -17.98% return. During the first six months of this year the average REIT has performed much better with a +0.46% total return.
Source: Table by Simon Bowler of 2nd Market Capital, Data compiled from S&P Global Market Intelligence LLC. See important notes and disclosures at the end of this article Source: Table by Simon Bowler of 2nd Market Capital, Data compiled from S&P Global Market Intelligence LLC. See important notes and disclosures at the end of this article Source: Table by Simon Bowler of 2nd Market Capital, Data compiled from S&P Global Market Intelligence LLC. See important notes and disclosures at the end of this article
For the convenience of reading this table in a larger font, the table above is available as a PDF as well .
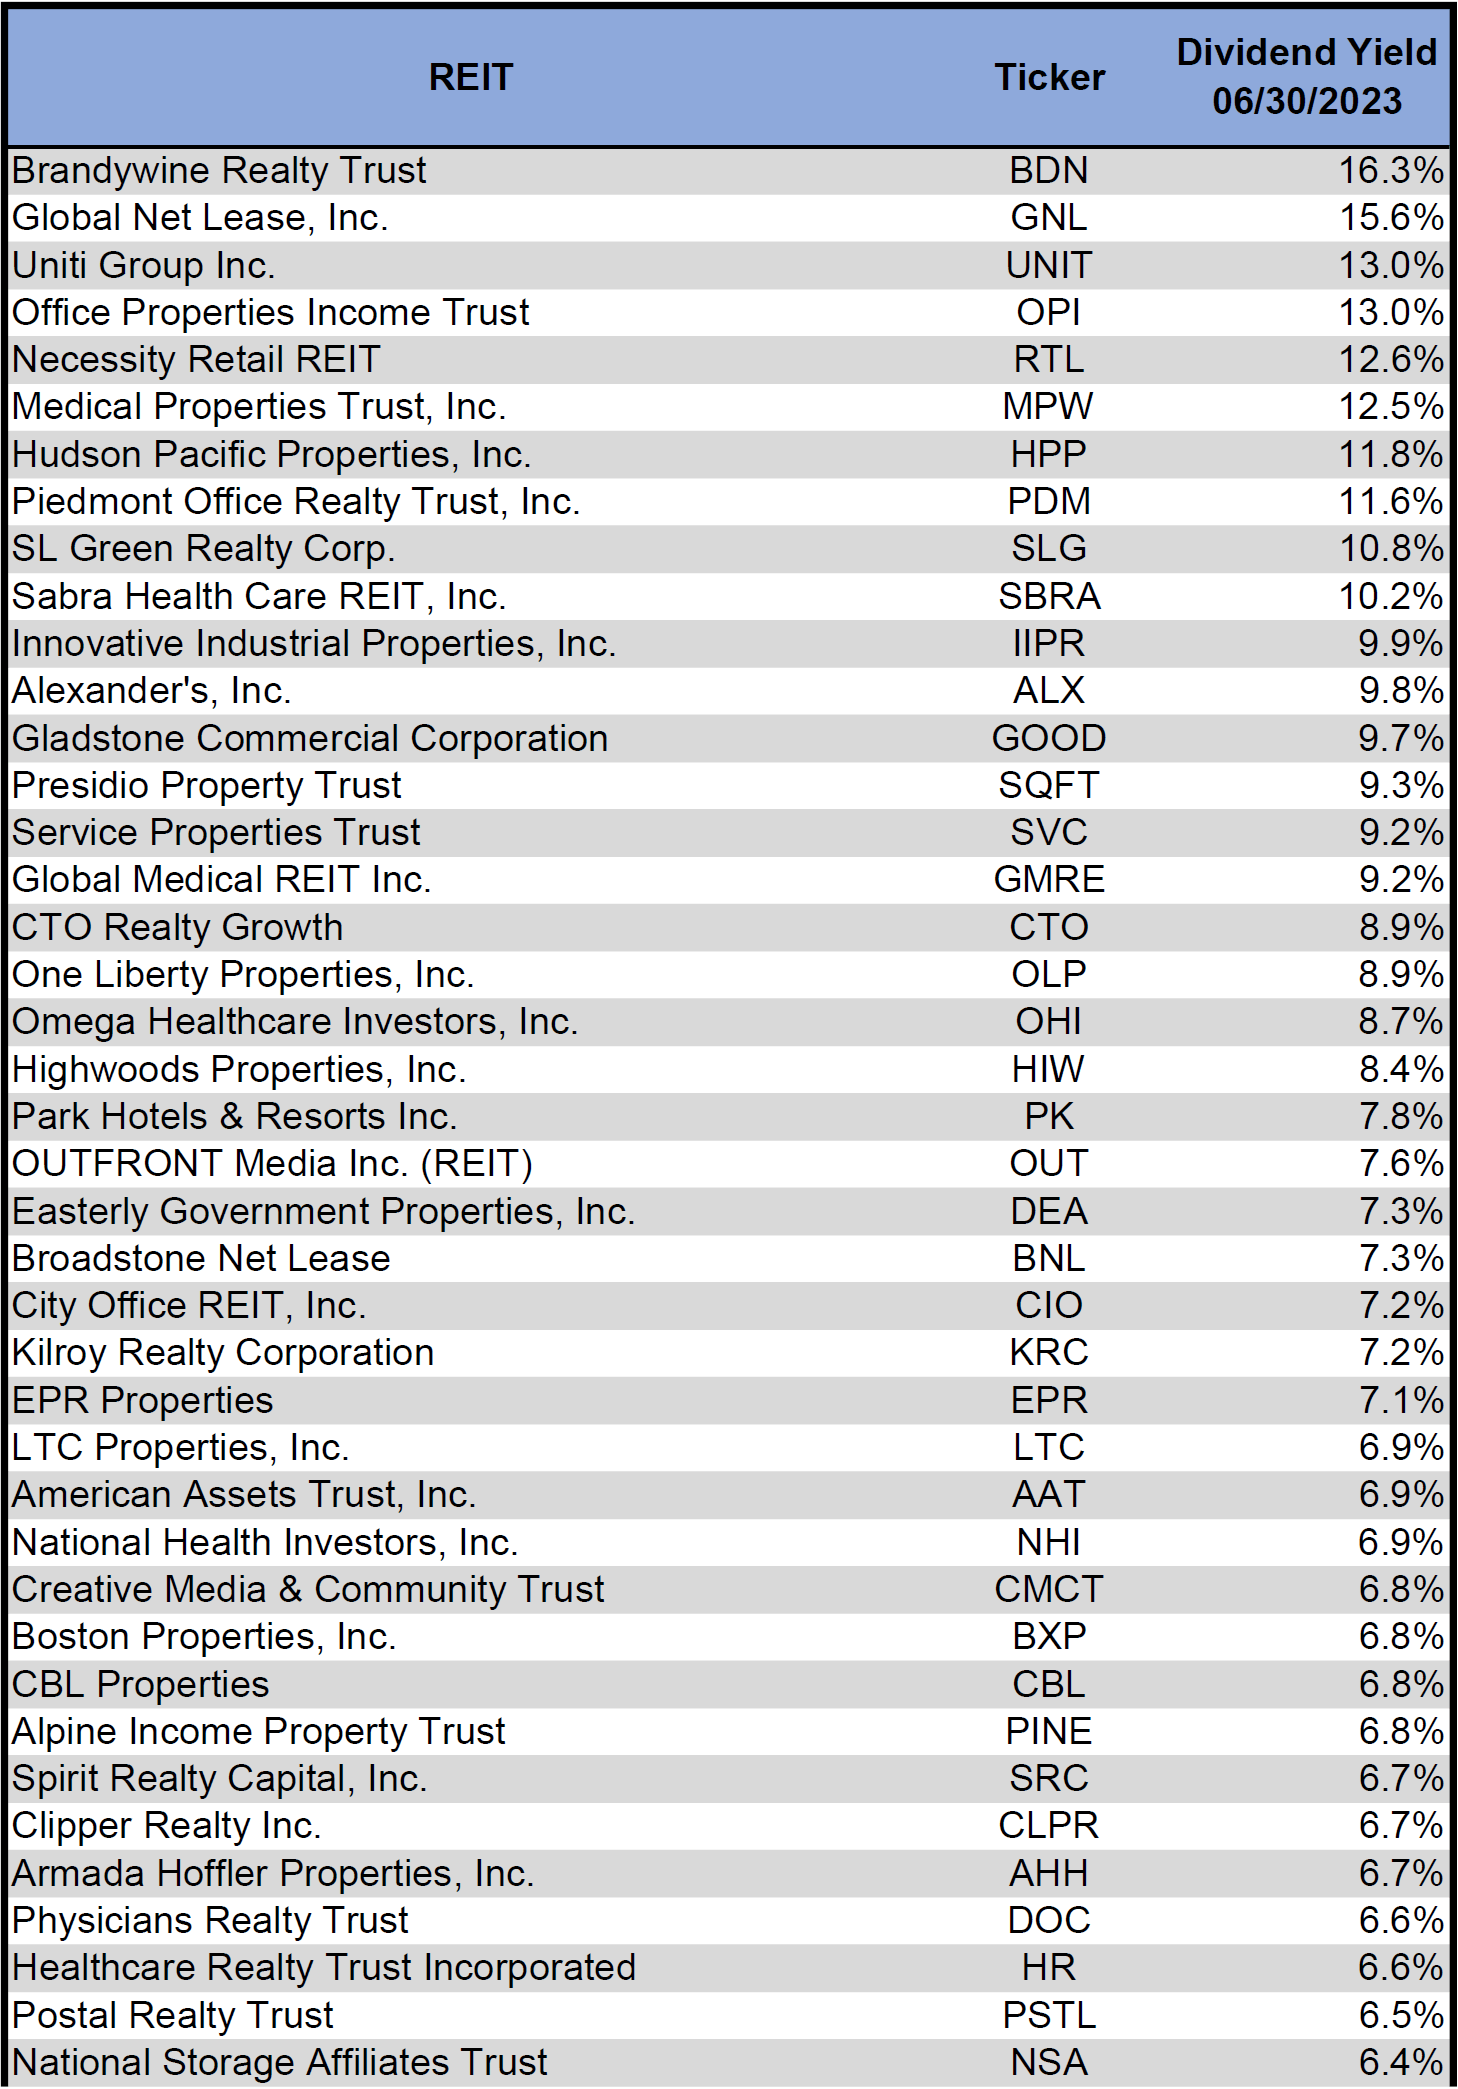
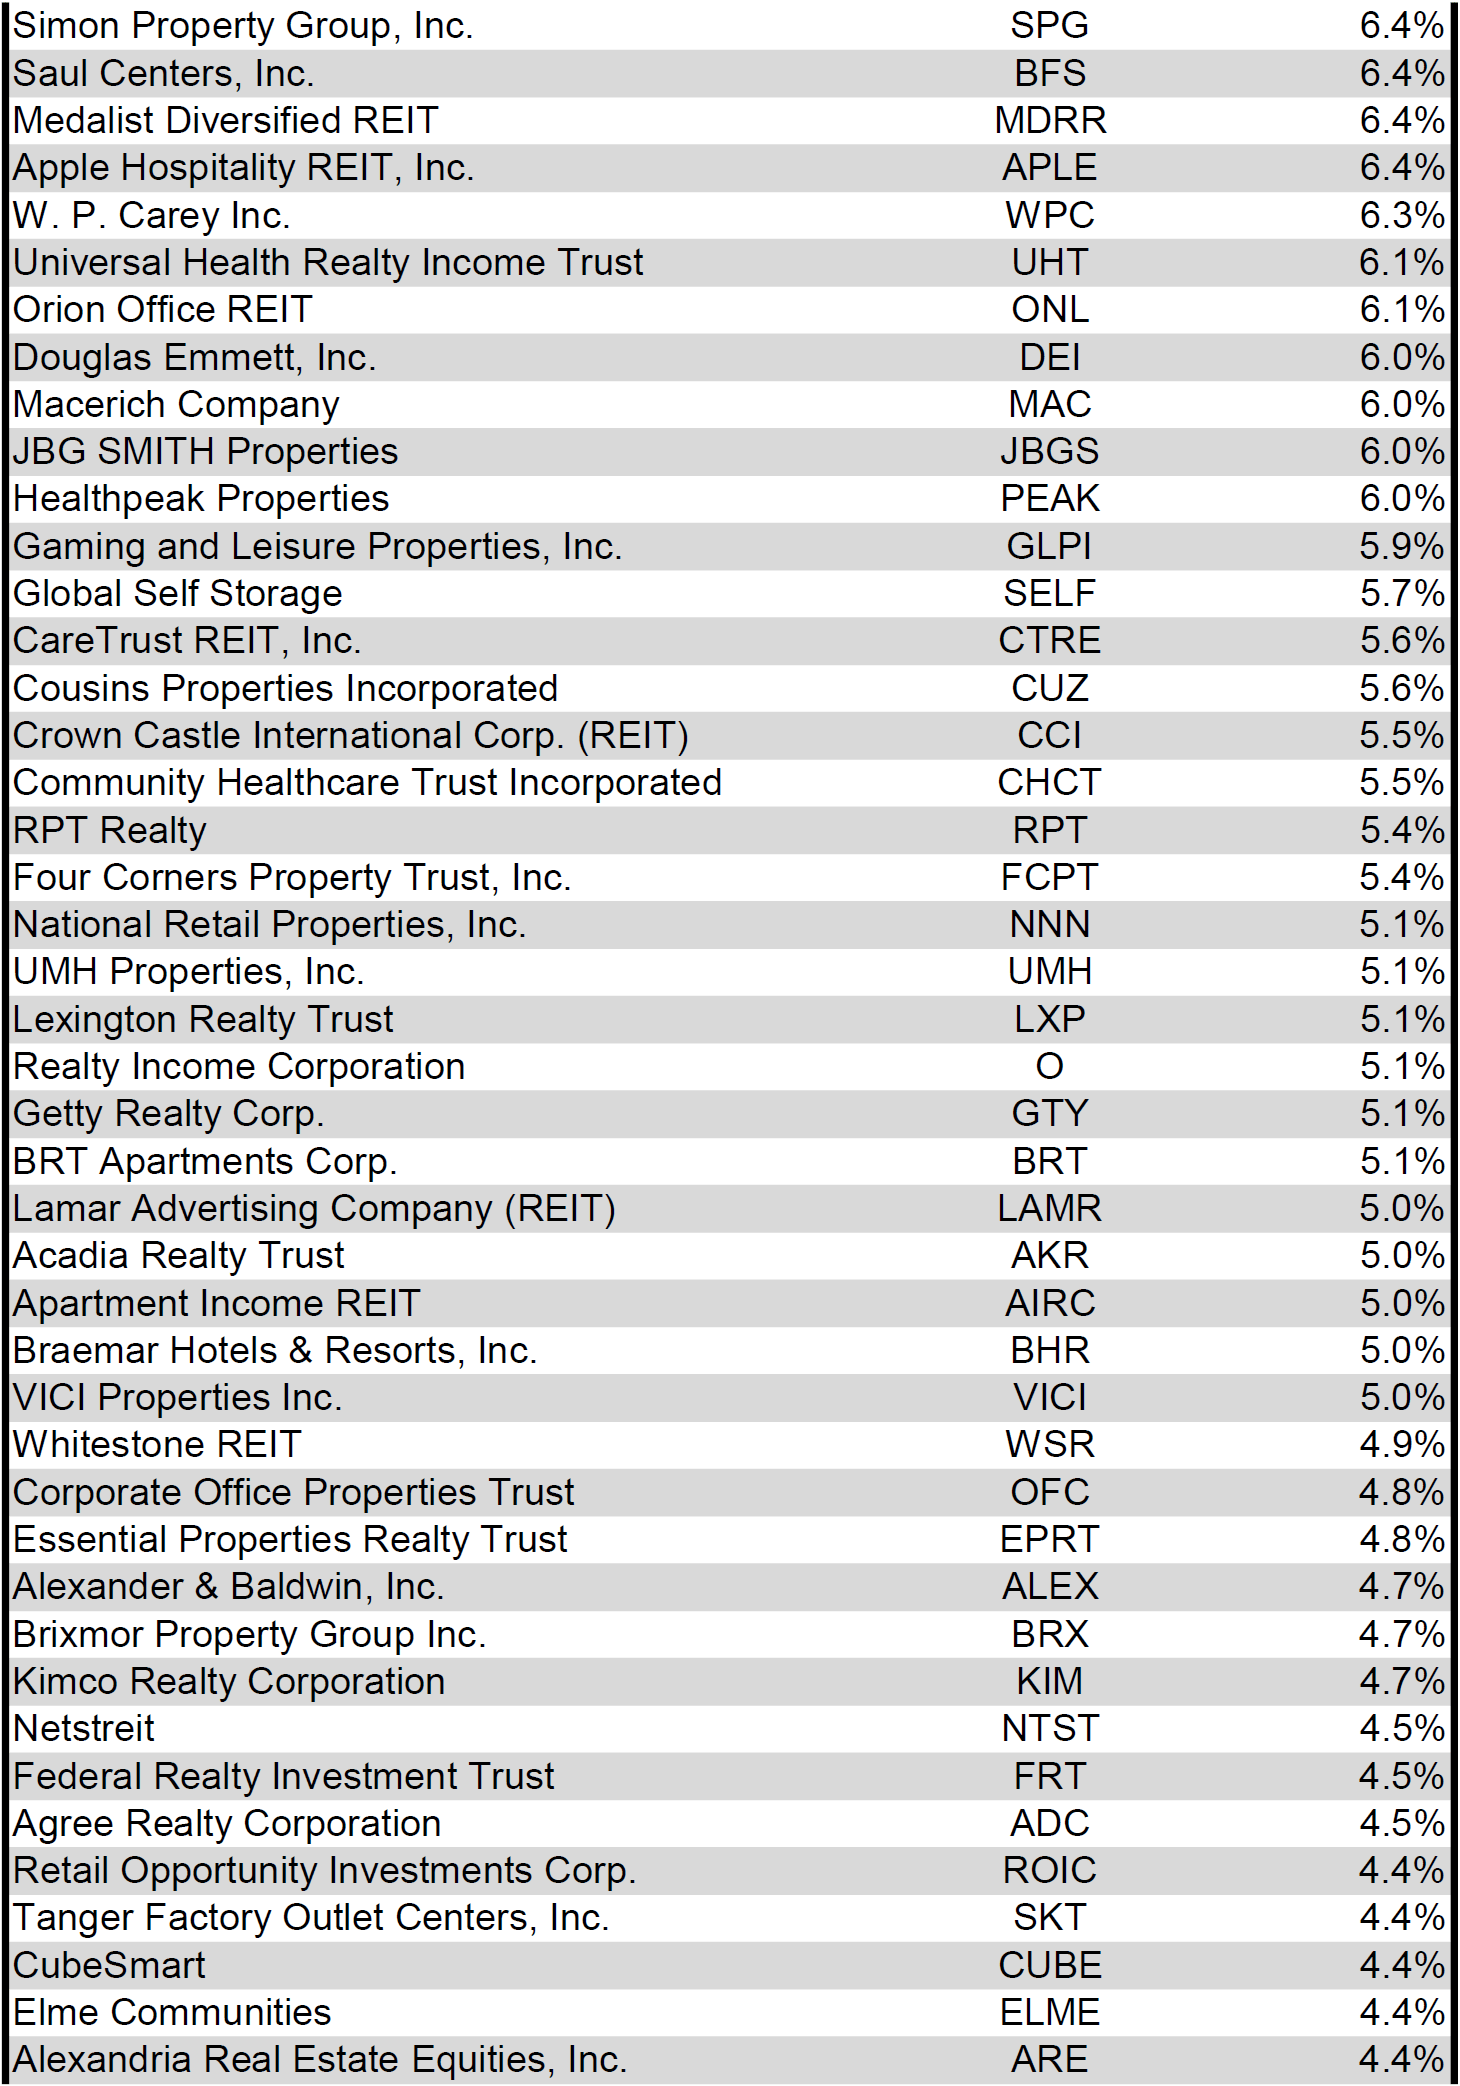
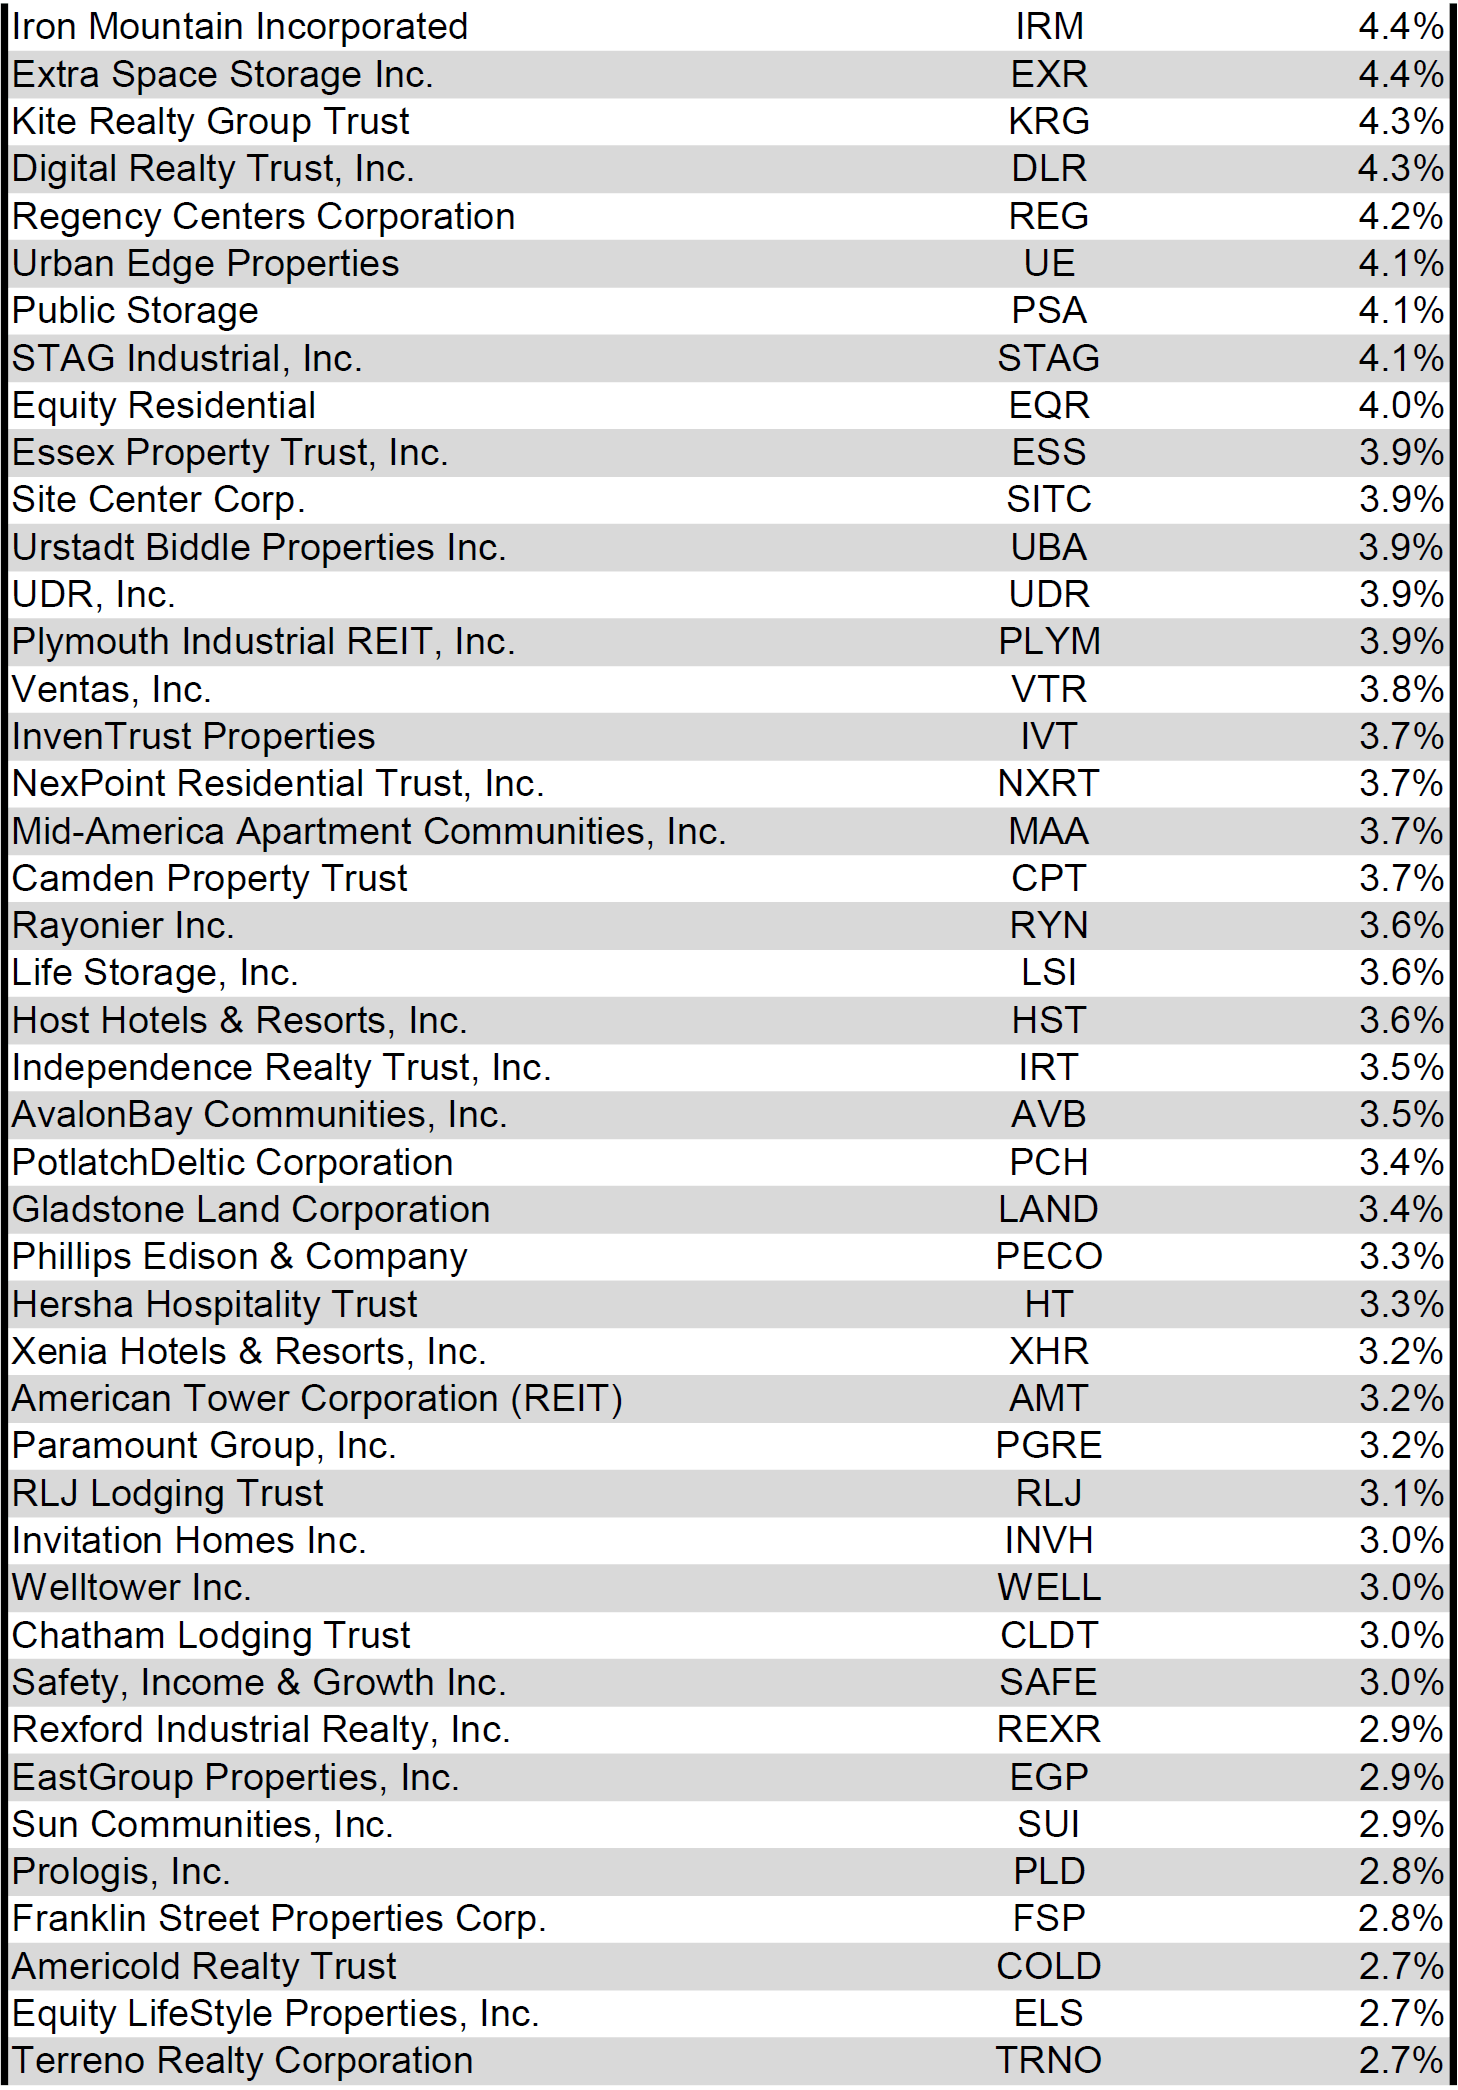
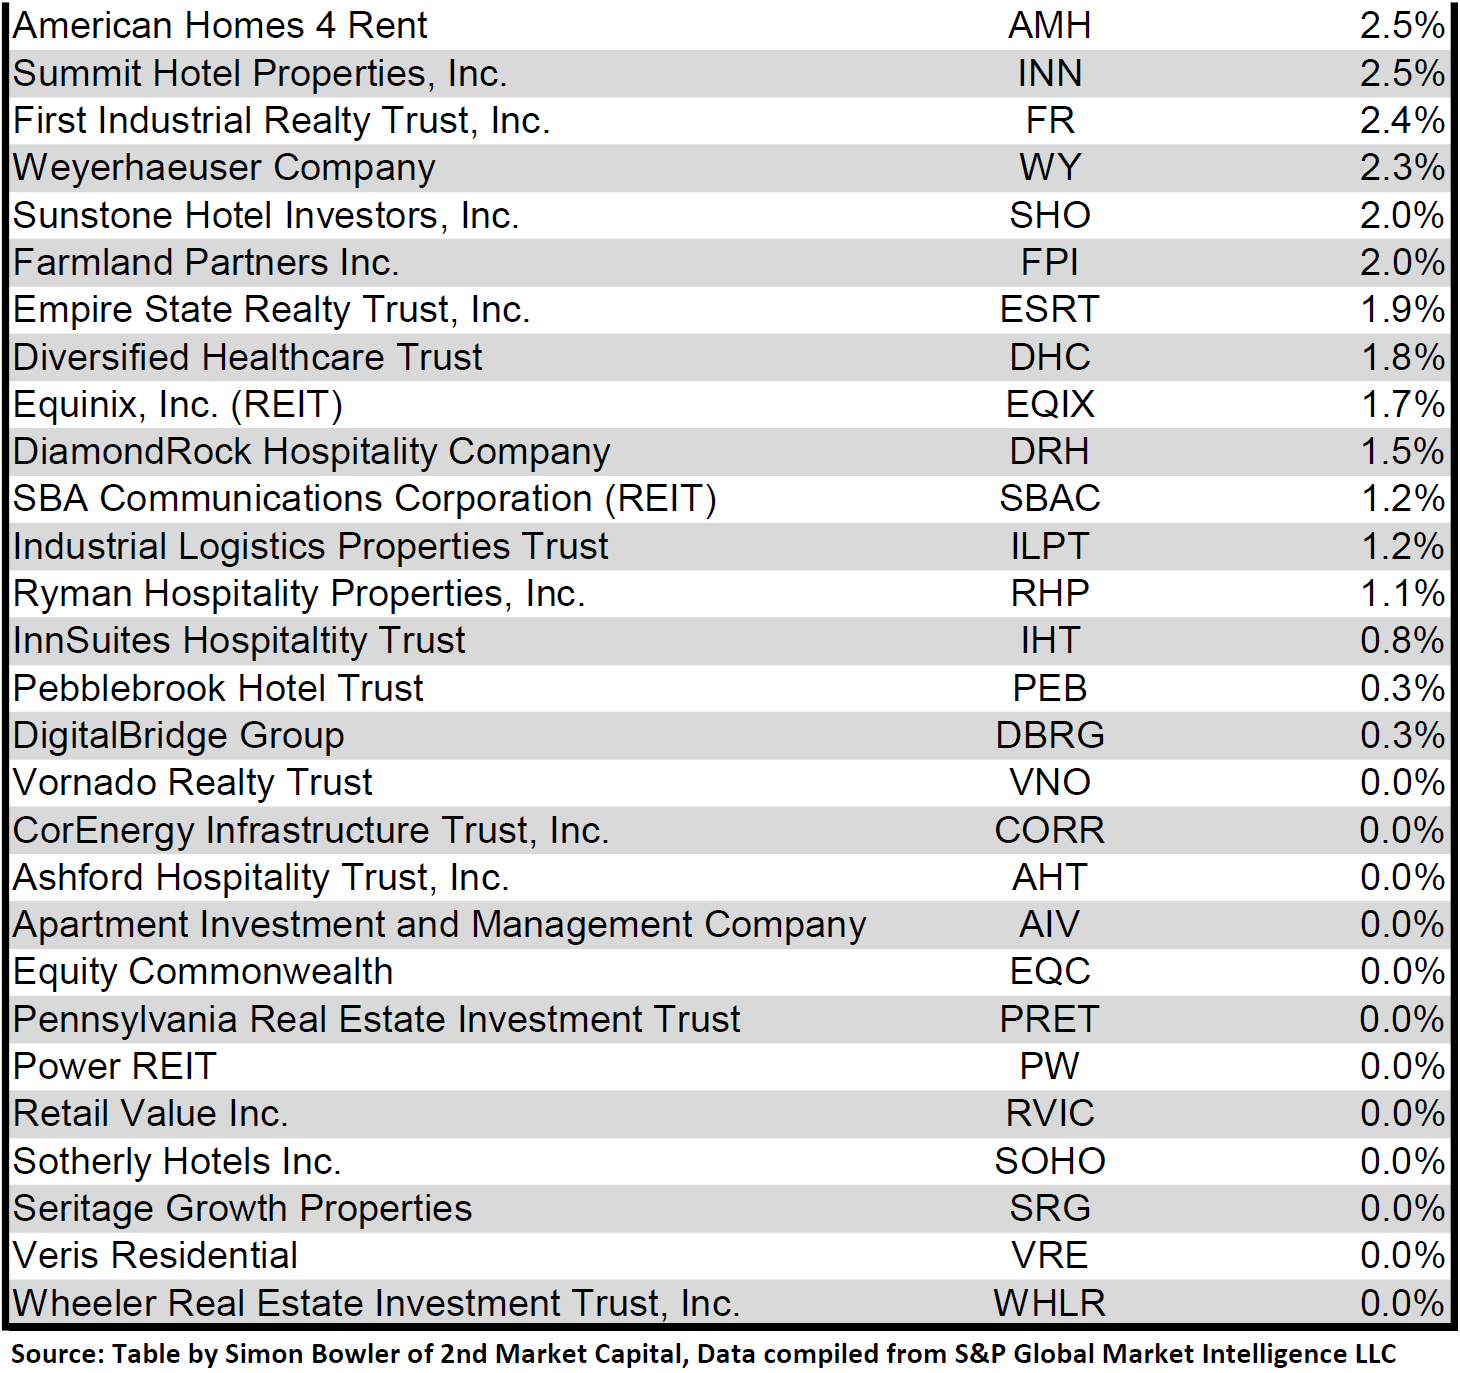
Dividend Yield
Dividend yield is an important component of a REIT's total return. The particularly high dividend yields of the REIT sector are, for many investors, the primary reason for investment in this sector. As many REITs are currently trading at share prices well below their NAV, yields are currently quite high for many REITs within the sector. Although a particularly high yield for a REIT may sometimes reflect a disproportionately high risk, there exist opportunities in some cases to capitalize on dividend yields that are sufficiently attractive to justify the underlying risks of the investment. I have included below a table ranking equity REITs from highest dividend yield (as of 06/30/2023) to lowest dividend yield.
Source: Table by Simon Bowler of 2nd Market Capital, Data compiled from S&P Global Market Intelligence LLC. See important notes and disclosures at the end of this article Source: Table by Simon Bowler of 2nd Market Capital, Data compiled from S&P Global Market Intelligence LLC. See important notes and disclosures at the end of this article Source: Table by Simon Bowler of 2nd Market Capital, Data compiled from S&P Global Market Intelligence LLC. See important notes and disclosures at the end of this article Source: Table by Simon Bowler of 2nd Market Capital, Data compiled from S&P Global Market Intelligence LLC. See important notes and disclosures at the end of this article
For the convenience of reading this table in a larger font, the table above is available as a PDF as well .
Although a REIT’s decision regarding whether to pay a quarterly dividend or a monthly dividend does not reflect on the quality of the company’s fundamentals or operations, a monthly dividend allows for a smoother cash flow to the investor. Below is a list of equity REITs that pay monthly dividends ranked from highest yield to lowest yield.
Source: Table by Simon Bowler of 2nd Market Capital, Data compiled from S&P Global Market Intelligence LLC. See important notes and disclosures at the end of this article
Valuation
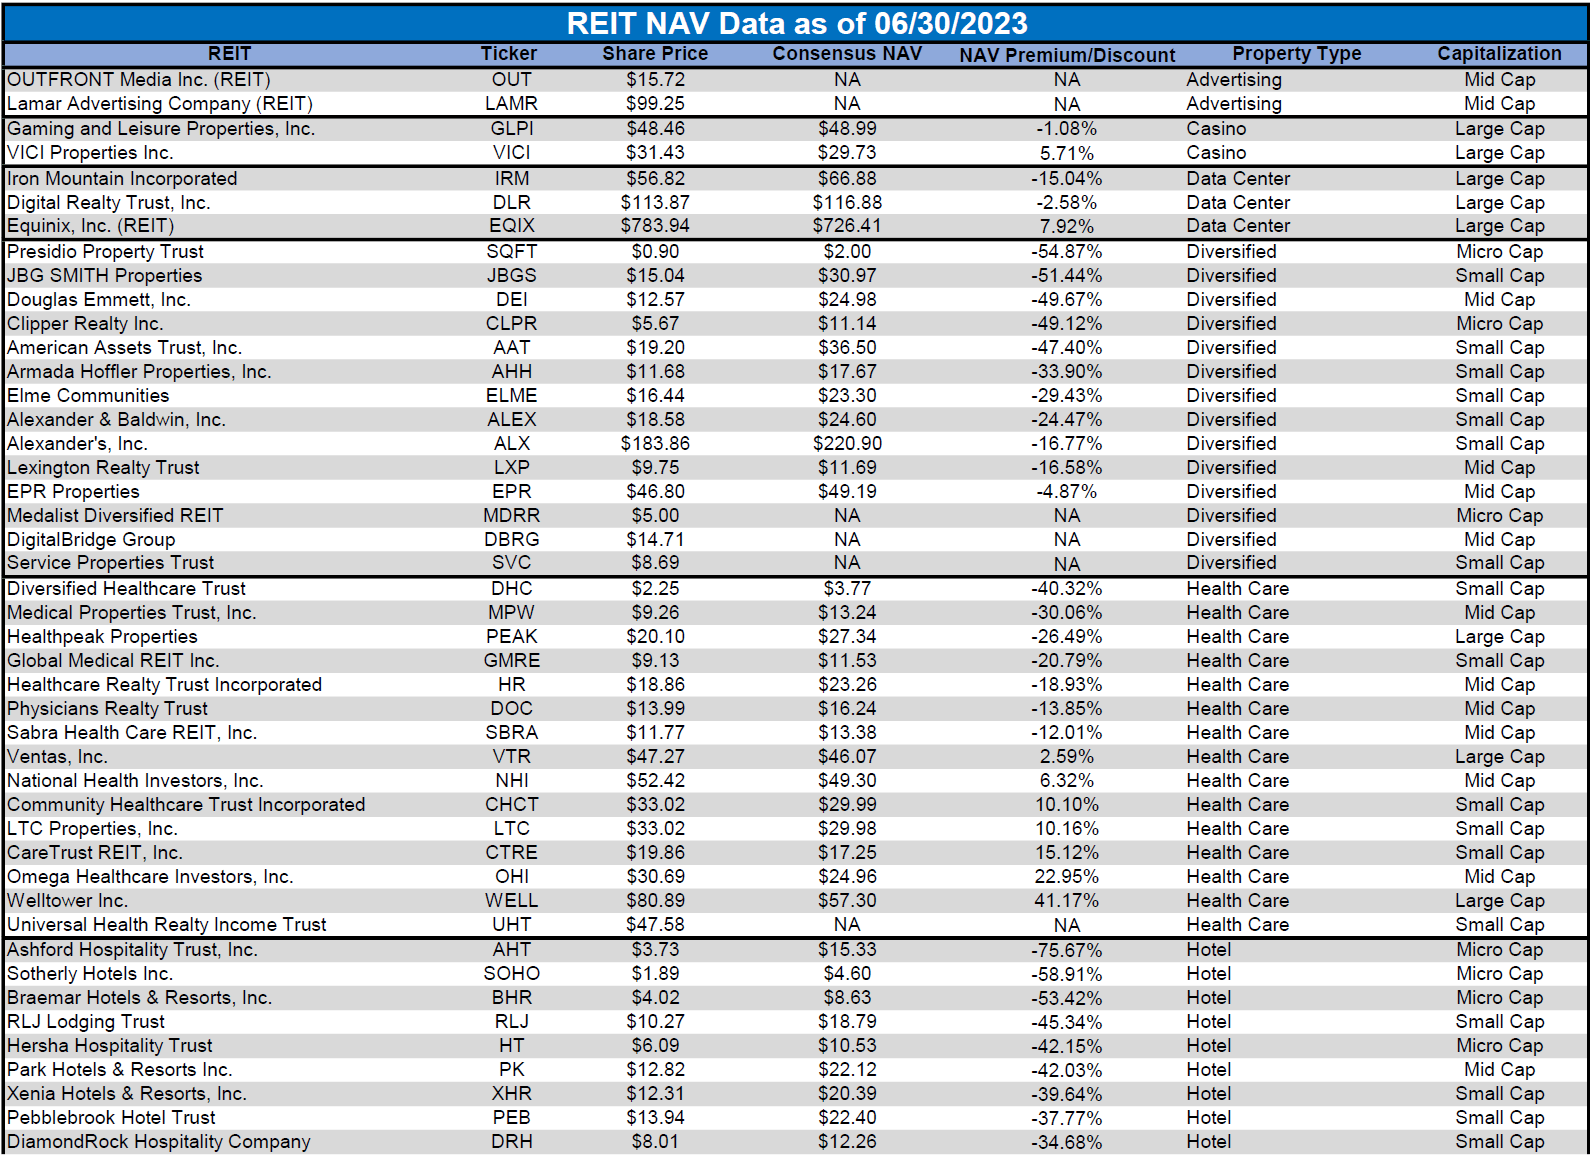
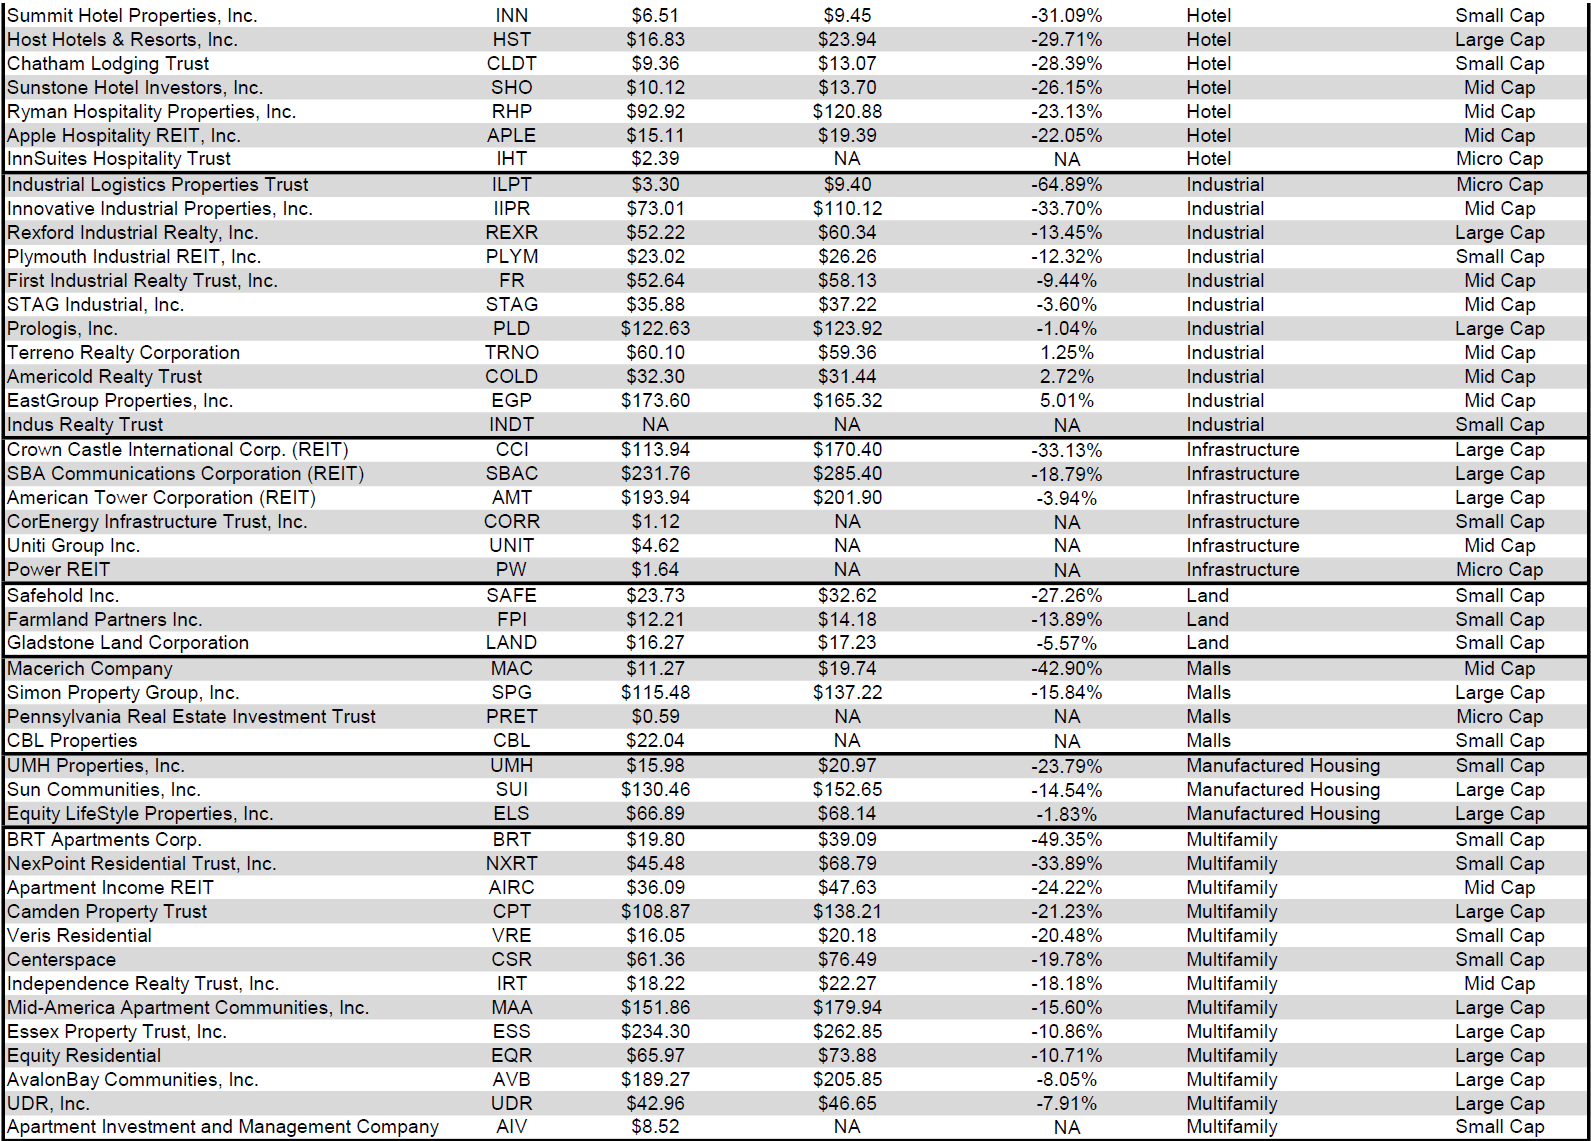
REIT Premium/Discount to NAV by Property Type
Below is a downloadable data table, which ranks REITs within each property type from the largest discount to the largest premium to NAV. The consensus NAV used for this table is the average of analyst NAV estimates for each REIT. Both the NAV and the share price will change over time, so I will continue to include this table in upcoming issues of The State of REITs with updated consensus NAV estimates for each REIT for which such an estimate is available.
Source: Table by Simon Bowler of 2nd Market Capital, Data compiled from S&P Global Market Intelligence LLC. See important notes and disclosures at the end of this article Source: Table by Simon Bowler of 2nd Market Capital, Data compiled from S&P Global Market Intelligence LLC. See important notes and disclosures at the end of this article Source: Table by Simon Bowler of 2nd Market Capital, Data compiled from S&P Global Market Intelligence LLC. See important notes and disclosures at the end of this article Source: Table by Simon Bowler of 2nd Market Capital, Data compiled from S&P Global Market Intelligence LLC. See important notes and disclosures at the end of this article
For the convenience of reading this table in a larger font, the table above is available as a PDF as well .
Takeaway
The large cap REIT premium (relative to small cap REITs) narrowed in June and investors are now paying on average about 47% more for each dollar of 2023 FFO/share to buy large cap REITs than small cap REITs (17.2x/11.7x - 1 = 47.0%). As can be seen in the table below, there is presently a strong positive correlation between market cap and FFO multiple.
Source: Table by Simon Bowler of 2nd Market Capital, Data compiled from S&P Global Market Intelligence LLC. See important notes and disclosures at the end of this article
The table below shows the average premium/discount of REITs of each market cap bucket. This data, much like the data for price/FFO, shows a strong, positive correlation between market cap and Price/NAV. The average large cap REIT (-8.89%) trades at a high single digit discount to NAV, while mid cap REITs (-16.78%) trade at double digit discount. Small cap REITs (-30.42%) trade at a little over 2/3 of NAV. Micro caps on average continue to trade at less than half of their respective NAVs (-51.45%).
Source: Table by Simon Bowler of 2nd Market Capital, Data compiled from S&P Global Market Intelligence LLC. See important notes and disclosures at the end of this article
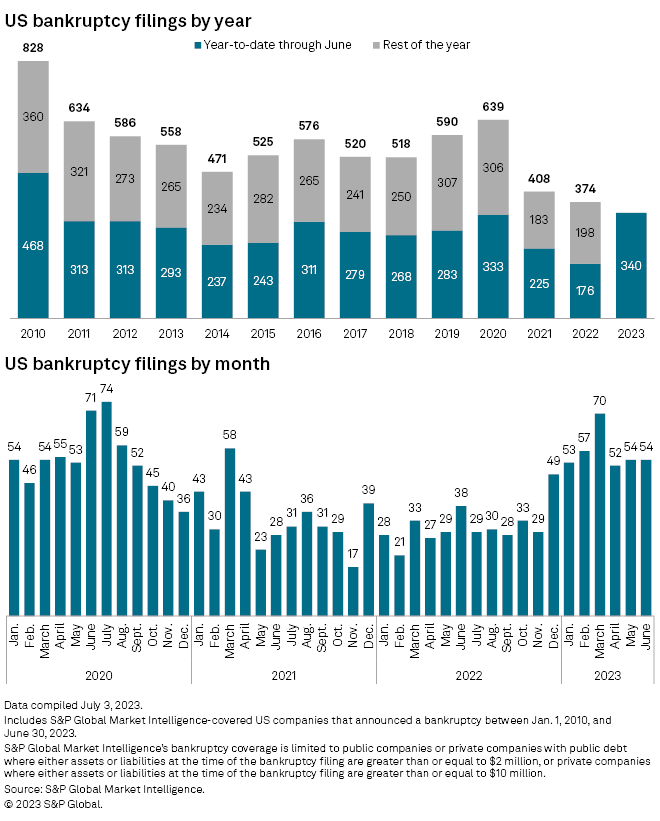
The number of bankruptcy filings in June held steady month over month and remains at an elevated level. In the first half of 2023 there have been more filings than in the first six months of any year since 2010 and almost twice as many as there were over the same period last year. With further rate hikes expected from the Fed in the 2 nd half of the year, the pace of bankruptcies is not likely to taper off yet.
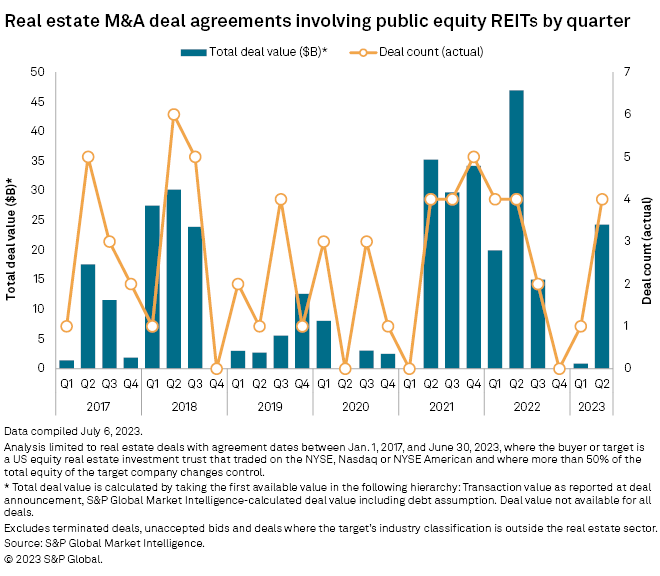
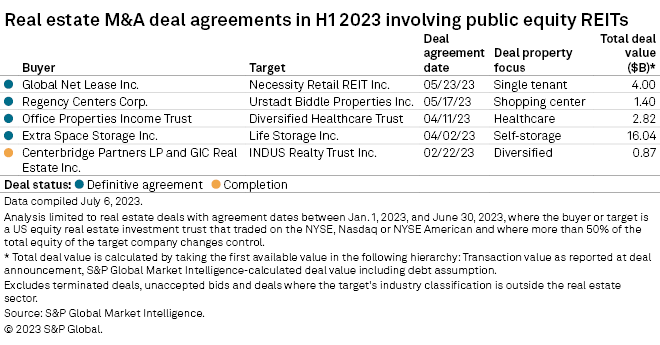
The REIT sector saw robust M&A activity from Q2 2021 through Q3 2022, but that activity completely dried up in Q4 2022 and was very muted Q1 2023 as the Fed was moving full speed ahead with interest rate hikes. However, M&A rebounded in Q2 2023 with 4 REIT mergers valued at a combined $24.27B in transaction value.
The largest of H1 2023’s M&A deals was the acquisition of Life Storage by Extra Space Storage ( EXR ) for $16.04B in April. This was followed by the acquisition of Urstadt Biddle Properties ( UBP ) by Regency Centers ( REG ) and 2 mergers involving 4 RMR Group ( RMR ) managed REITs. Global Net Lease ( GNL ) acquired Necessity Retail REIT ( RTL ) and Office Properties Income Trust ( OPI ) acquired Diversified Healthcare Trust ( DHC ).
The acquisition target typically sees strong upward price movement upon the announcement of a definitive agreement. It is even common to see prices move upward if a REIT announces that they are merely exploring the possibility of being acquired. However, Diversified Healthcare Trust has seen a disproportionately large surge with a 256.09% total return YTD fueled by the upcoming acquisition.
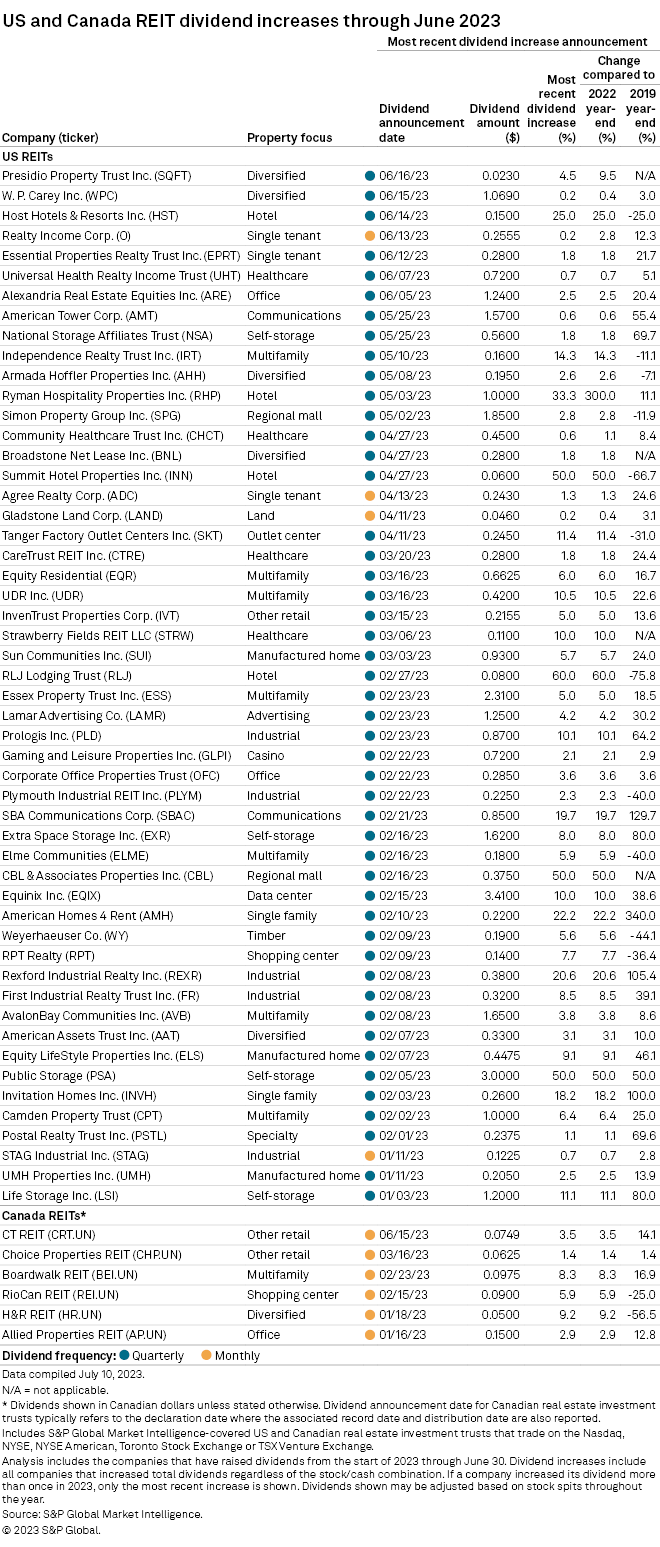
Correctly identifying potential M&A acquisition targets can certainly be a great source of alpha, but so can identifying REITs with strong fundamentals and dependable dividend growth. While dividend increases are virtually always welcome news to investors, they should certainly not all be viewed the same way given that not all hikes are the same. For example, Presidio Property Trust ( SQFT ), Host Hotels & Resorts ( HST ), and Alexandria Real Estate Equities ( ARE ) all hiked their dividends in June, but the stories behind the hikes are different for all three. SQFT raised the quarterly dividend from $0.022/share in Q1 2023 to $0.023/share in Q2 2023, but this remains a tiny fraction of the $0.106/share dividend SQFT paid a year earlier in Q2 2022. HST’s dividend was suspended from Q2 2020 through Q4 2021 and has been quickly ramping up since being reinstated in Q1 2022, but the quarterly dividend that was raised to $0.15/share in Q2 2023 has not yet fully recovered to the $0.20/share dividend paid pre-Covid. ARE’s dividend hike in June, however, tells a different and much more positive story. ARE’s Q2 2023 dividend of $1.24/share is the largest quarterly dividend the REIT has ever paid and is fueled by strong fundamentals including a remarkable rental rate increase of 48.3% in Q1 2023.
While dividend hikes always look attractive on the surface, it is worth digging deeper to identify which REITs are truly achieving sustainable dividend growth and which are merely issuing token raises that don’t reflect strong company fundamentals.
For further details see:
The State Of REITs: July 2023 Edition