DHC - The State Of REITs: June 2023 Edition
2023-06-19 04:40:41 ET
Summary
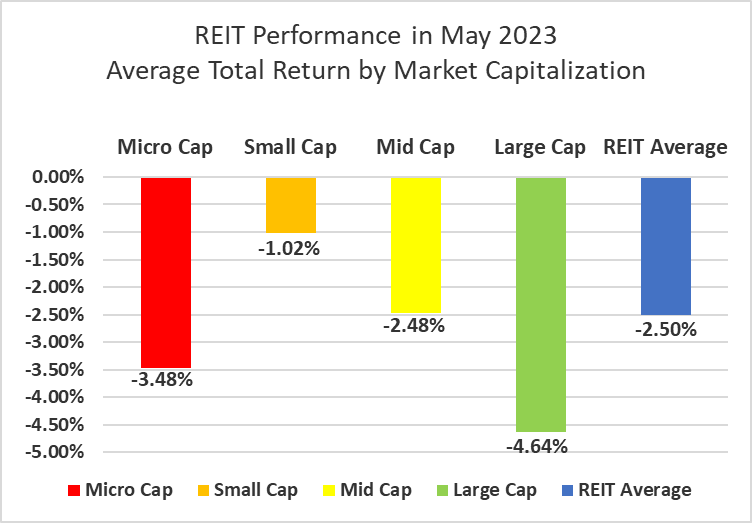
- The REIT sector declined for the 4th consecutive month with a -2.50% total return in May.
- Small cap REITs (-1.02%) outperformed in May by averaging the most modest negative total returns. Large caps (-4.64%) underperformed their smaller REIT peers.
- Only 30.38% of REIT securities had a positive total return in May with only 36.65% in the black year to date.
- Hotels (+3.40%) and Single Family Housing (+2.69%) outperformed other REIT property types in May. Advertising (-14.50%) and Mall (-14.09%) REITs averaged double digit losses.
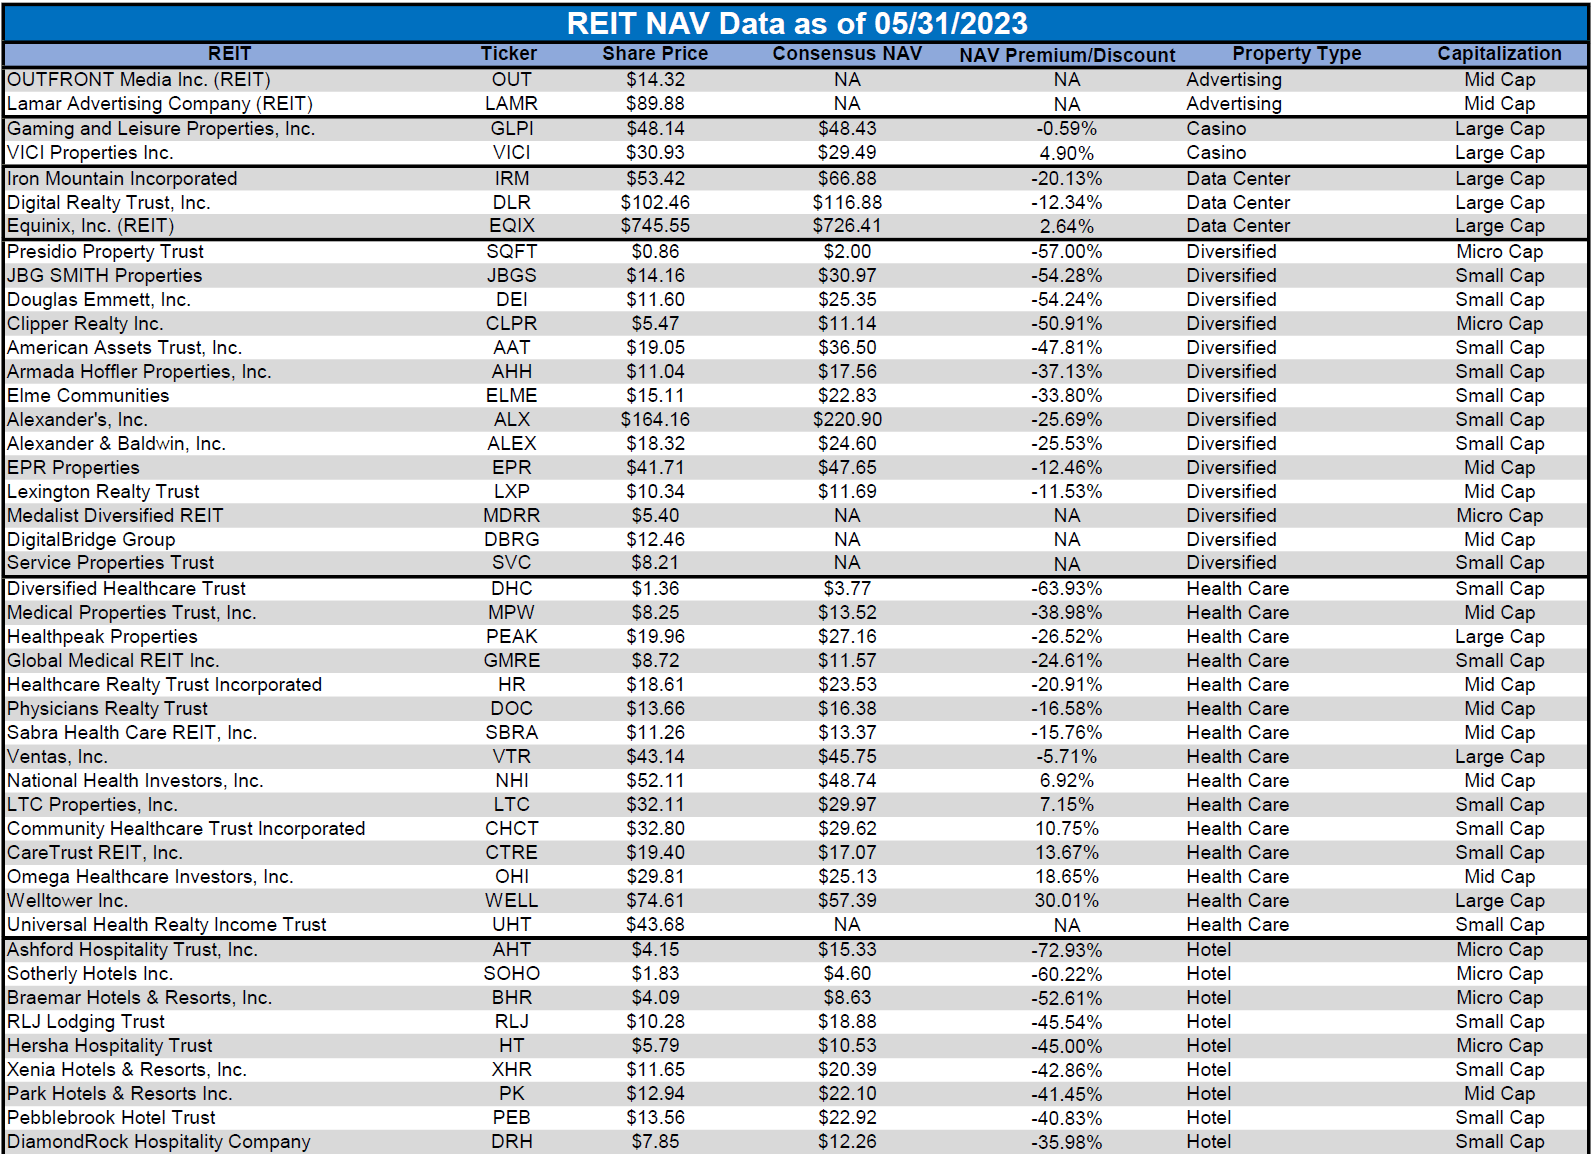
- The average REIT NAV discount widened from -24.82% to -26.57% during May. The median NAV discount widened from -20.73% to -24.41%.
REIT Performance
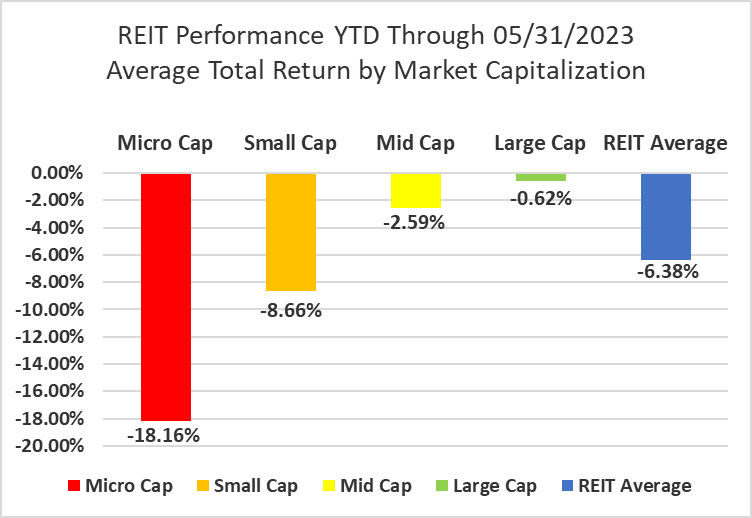
After a strong performance in January, the REIT sector has suffered 4 straight months of negative total returns. REITs (-2.50%) outperformed the Dow Jones Industrial Average (-3.2%), but badly underperformed the S&P 500 (+0.4%) and NASDAQ (+5.9%). The market cap weighted Vanguard Real Estate ETF ( VNQ ) saw a bigger decline than the average REIT in May (-3.96% vs. -2.50%), but has outperformed YTD (-2.06% vs. -6.38%). The spread between the 2023 FFO multiples of large cap REITs (16.7x) and small cap REITs (11.2x) widened again in May as multiples contracted 0.6 turns for large caps and 0.7 turns for small caps. Investors currently need to pay an average of 49.1% more for each dollar of FFO from large cap REITs relative to small cap REITs. In this monthly publication, I will provide REIT data on numerous metrics to help readers identify which property types and individual securities currently offer the best opportunities to achieve their investment goals.
Source: Graph by Simon Bowler of 2nd Market Capital, Data compiled from S&P Global Market Intelligence LLC. See important notes and disclosures at the end of this article
After outperforming their smaller peers earlier in the year, large cap REITs (-4.64%) struggled in May. Small caps (-1.02%) averaged the most modest negative total returns, followed by mid cap (-2.48%) and micro cap (-3.48%) REITs. Even after a tough May, Large cap REITs (-0.62%) are outperforming small caps (-8.66%) by 804 basis points on YTD 2023 total return.
Source: Graph by Simon Bowler of 2nd Market Capital, Data compiled from S&P Global Market Intelligence LLC. See important notes and disclosures at the end of this article
5 out of 18 Property Types Yielded Positive Total Returns in May
Only 27.78% percent of REIT property types averaged a positive total return in May, with a 17.9% total return spread between the best and worst performing property types. Hotels (+3.40%) and Single Family Housing (+2.69%) were the best performing property types in May. Hotels were boosted in May by the outsized returns of two very volatile micro cap REITs, InnSuites Hospitality Trust ( IHT ) (+41.73%) and Ashford Hospitality Trust ( AHT ) (+22.06%).
Advertising (-14.50%) and Mall (-14.09%) REITs were the only property types that averaged double digit declines in May. Two of the four Mall REITs, CBL Properties ( CBL ) (-0.30%) and Macerich ( MAC ) (-1.74%), actually outperformed in May, but the Mall REIT average was dragged down by the -47.12% collapse of Pennsylvania REIT ( PRET ).
Source: Table by Simon Bowler of 2nd Market Capital, Data compiled from S&P Global Market Intelligence LLC. See important notes and disclosures at the end of this article
Infrastructure (-29.84%) and Office REITs (-24.67%) continue to underperform and remain the worst performing property types thus far in 2023. Only 5 of the 18 REIT property types are in the black YTD, led by strong positive total returns for Single Family Housing (+15.33%), Data Centers (+8.91%) and Self-Storage (+8.48%).
Source: Table by Simon Bowler of 2nd Market Capital, Data compiled from S&P Global Market Intelligence LLC. See important notes and disclosures at the end of this article
The REIT sector as a whole saw the average P/FFO (2023Y) decrease 0.6 turns in May from 13.2x down to 12.6x. The average FFO multiple expanded for 11.8% of property types, contracted for 82.4% and held steady for 5.9%. There are no recent 2023 FFO/share estimates for any of the Timber REITs. Land (29.9x), Data Centers (22.4x), Single Family Housing (20.0x) and Industrial (19.9x) currently trade at the highest average multiples among REIT property types. Malls (4.5x), Office (6.8x) and Hotels (7.6x) are the only REIT property types trading at single digit multiples.
Source: Table by Simon Bowler of 2nd Market Capital, Data compiled from S&P Global Market Intelligence LLC. See important notes and disclosures at the end of this article
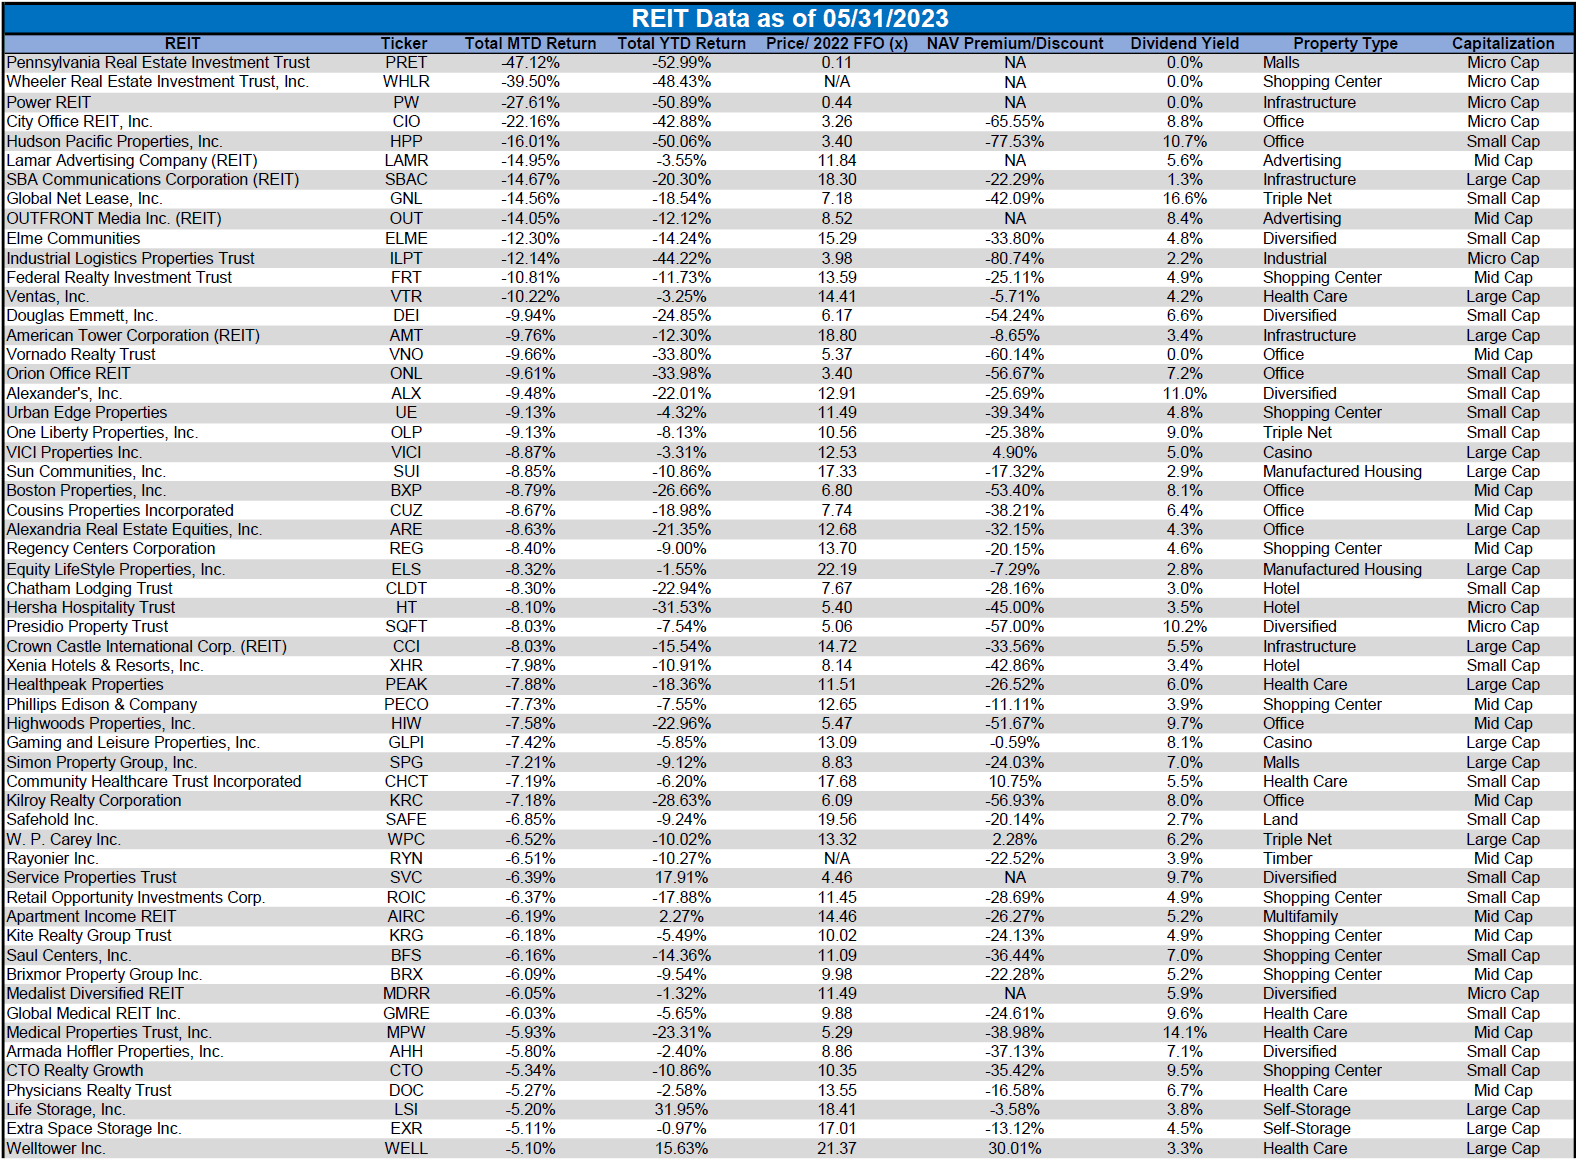
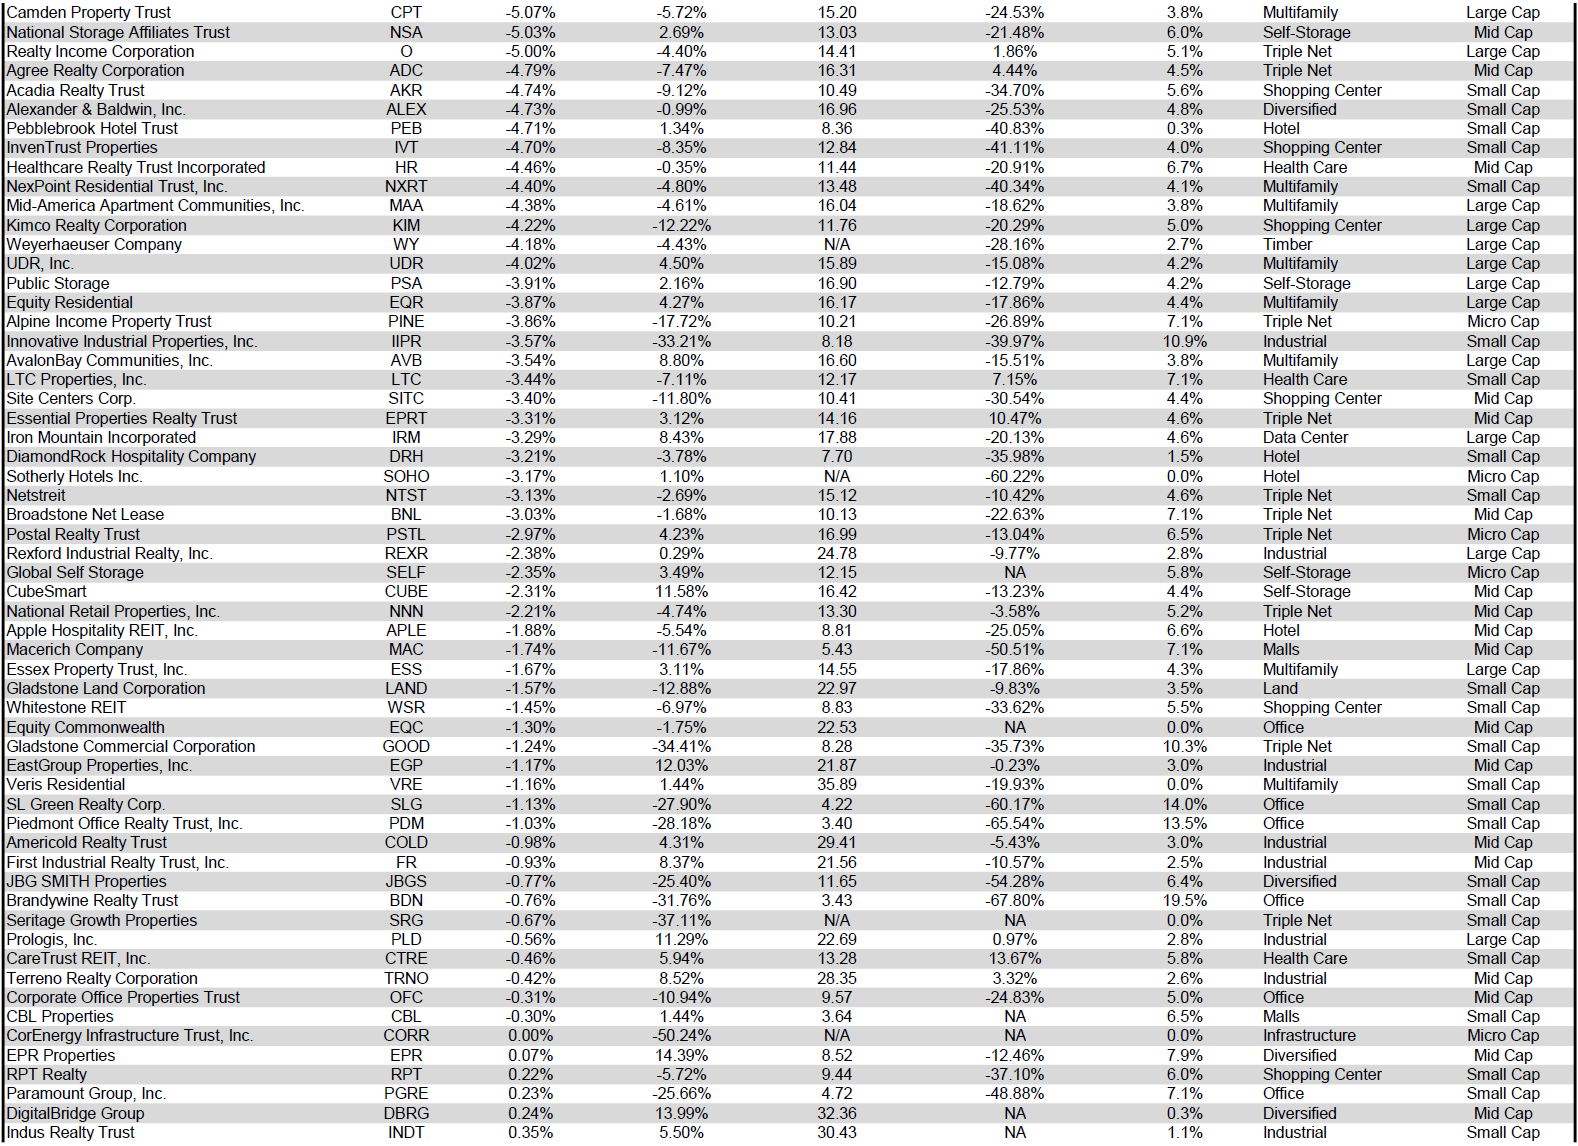
Performance of Individual Securities
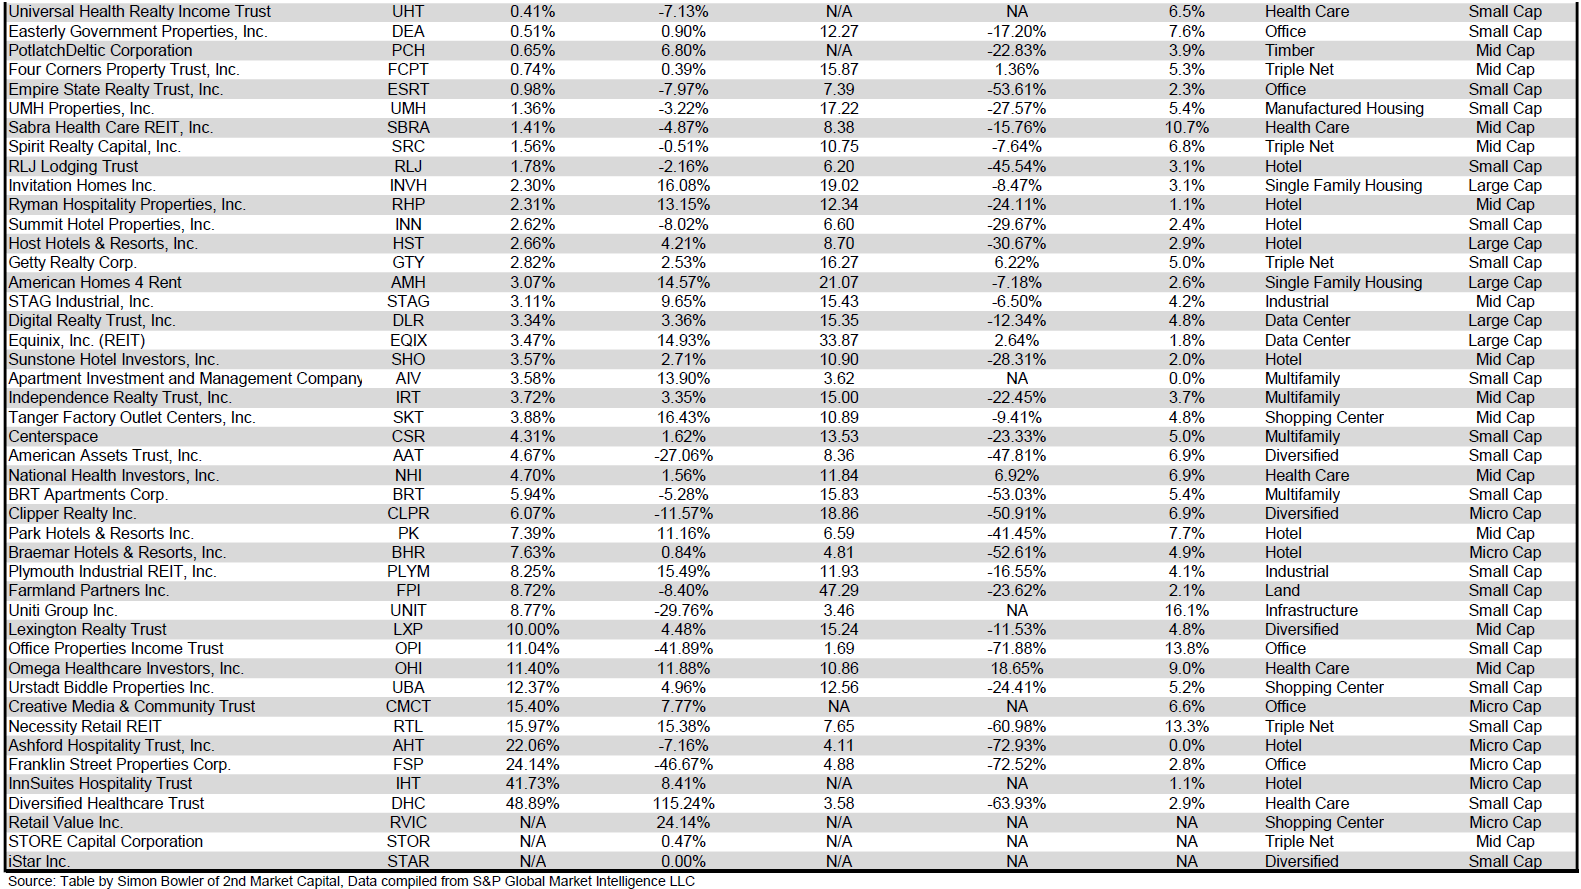
Diversified Healthcare Trust ( DHC ) (+48.89%) bounced back sharply from a brutal -31.64% return in April and is now the top performing REIT in 2023 by a wide margin with a +115.24% YTD total return. DHC posted a Q1 earnings beat on May 8 th , fueled in part by a 390 basis point improvement in SHOP occupancy. DHC saw further gains later in the month after a large DHC shareholder stated it intends to oppose the proposed merger of DHC with fellow RMR-managed Office Properties Income Trust ( OPI ).
Pennsylvania Real Estate Investment Trust (-47.12%) fell sharply after posting a brutal -$3.05/share FFO in Q1 2023. PREIT’s failure to turn around the business or materially reduce debt has left the Mall REIT with declining revenue and overwhelming debt obligations. This has fueled investor concern that PREIT is increasingly likely to end up in bankruptcy court again.
Only 30.38% of REITs had a positive total return in May with 36.65% in the black year to date. During the first five months of last year, the average REIT had a -10.18% return. During the first five months of this year, the average REIT has performed slightly less poorly with a -6.38% total return.
Source: Table by Simon Bowler of 2nd Market Capital, Data compiled from S&P Global Market Intelligence LLC. See important notes and disclosures at the end of this article Source: Table by Simon Bowler of 2nd Market Capital, Data compiled from S&P Global Market Intelligence LLC. See important notes and disclosures at the end of this article Source: Table by Simon Bowler of 2nd Market Capital, Data compiled from S&P Global Market Intelligence LLC. See important notes and disclosures at the end of this article
For the convenience of reading this table in a larger font, the table above is available as a PDF as well .
Dividend Yield
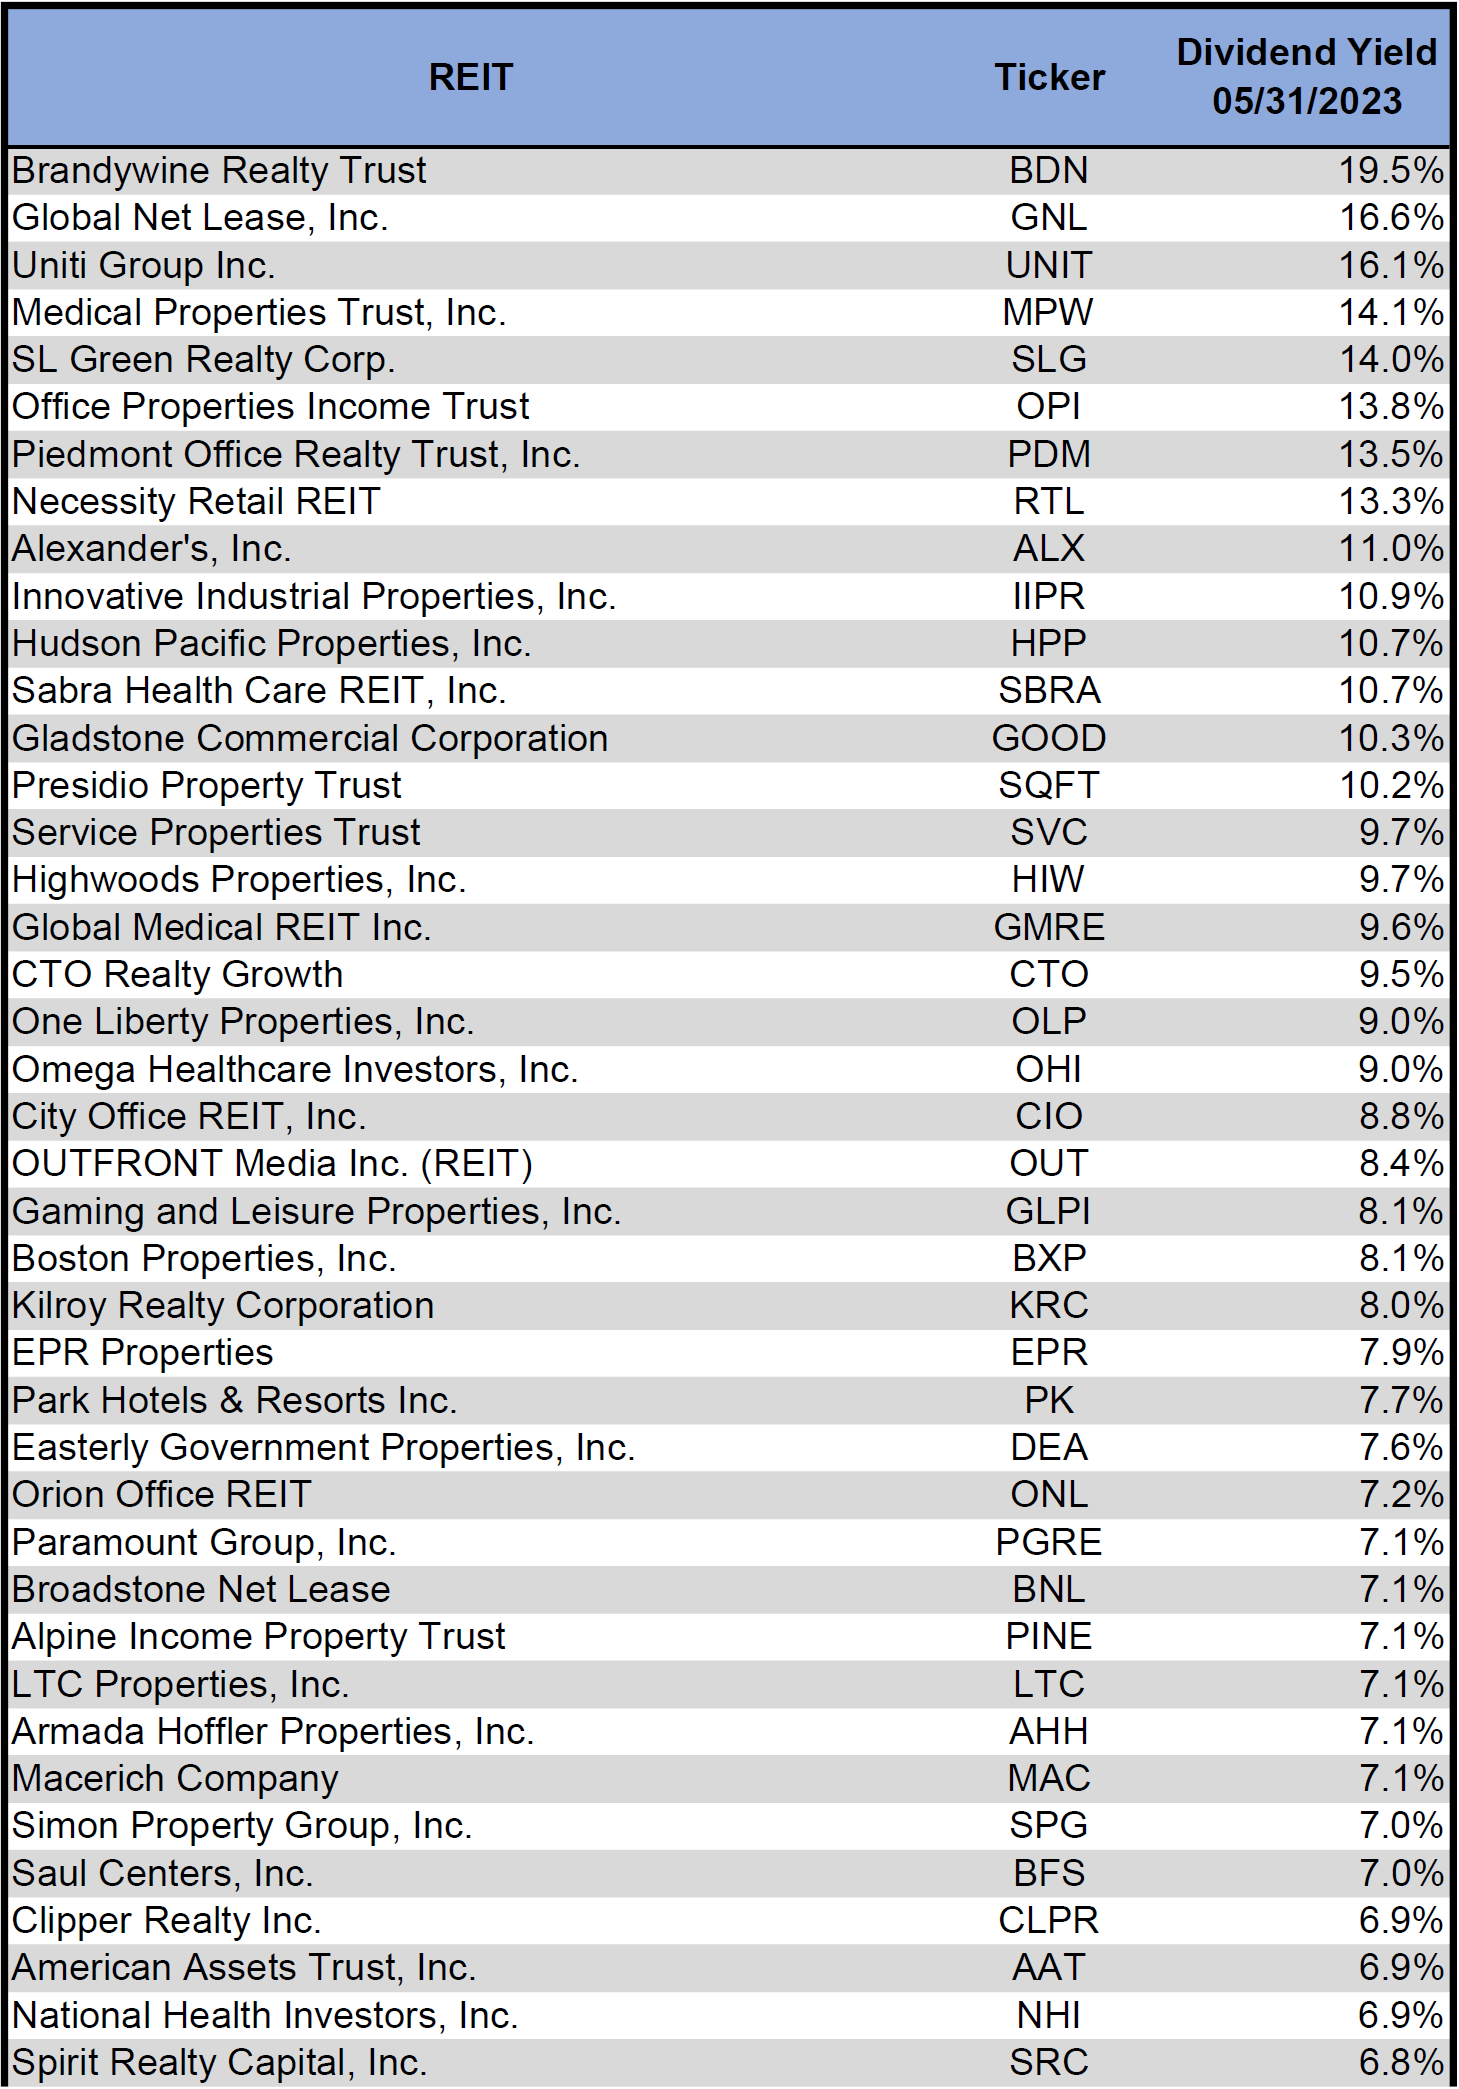
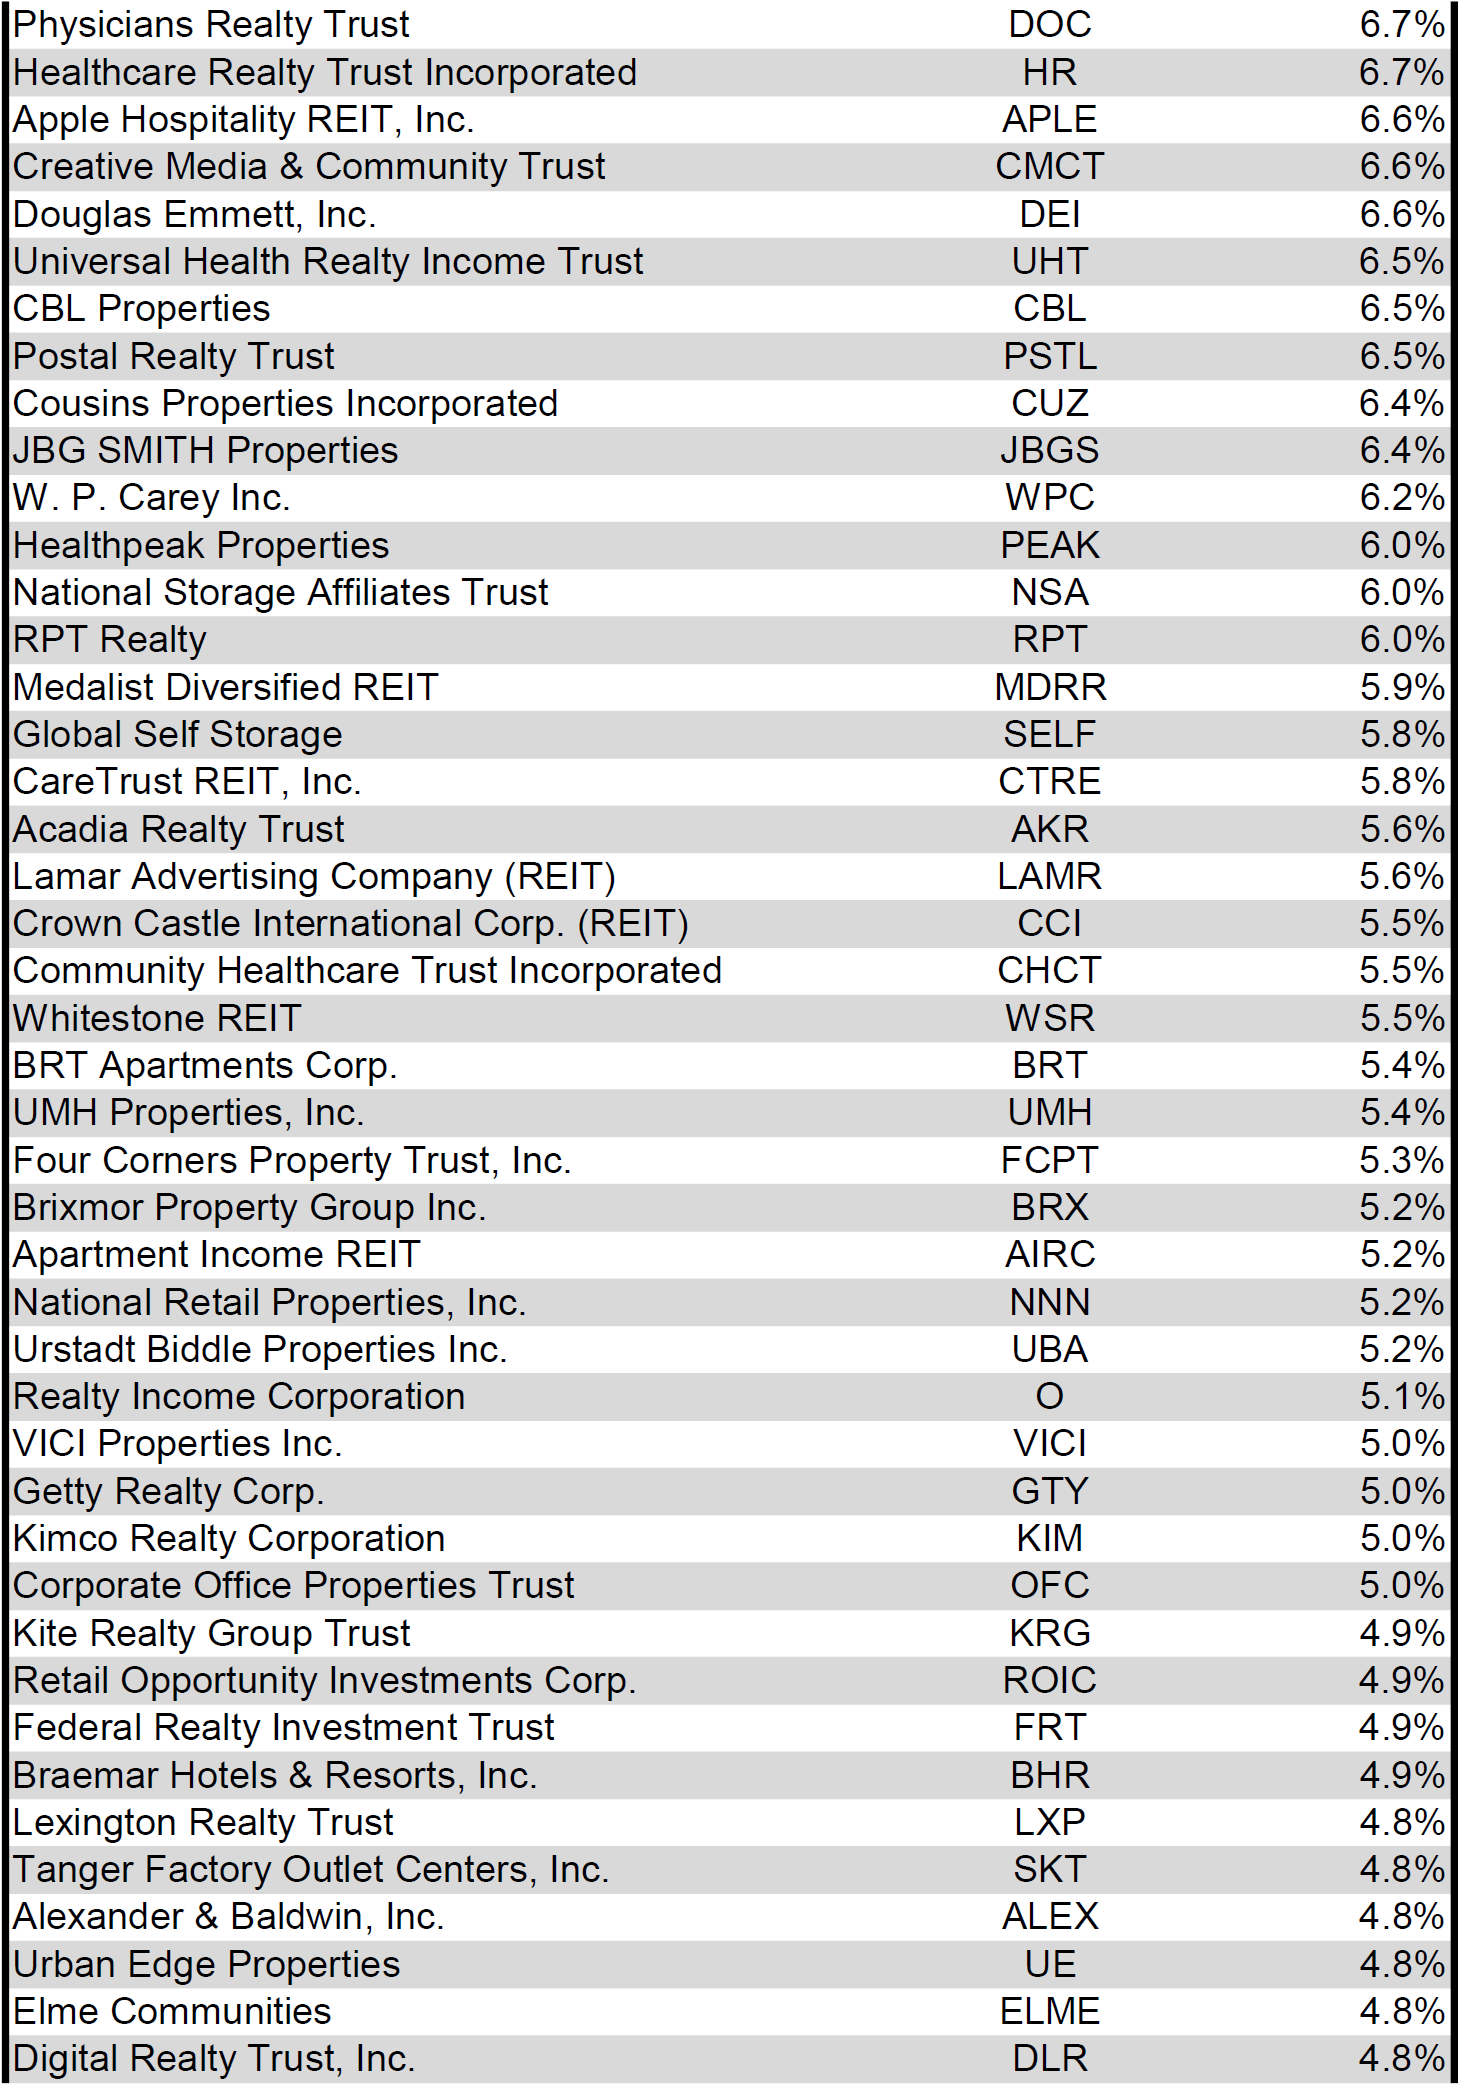
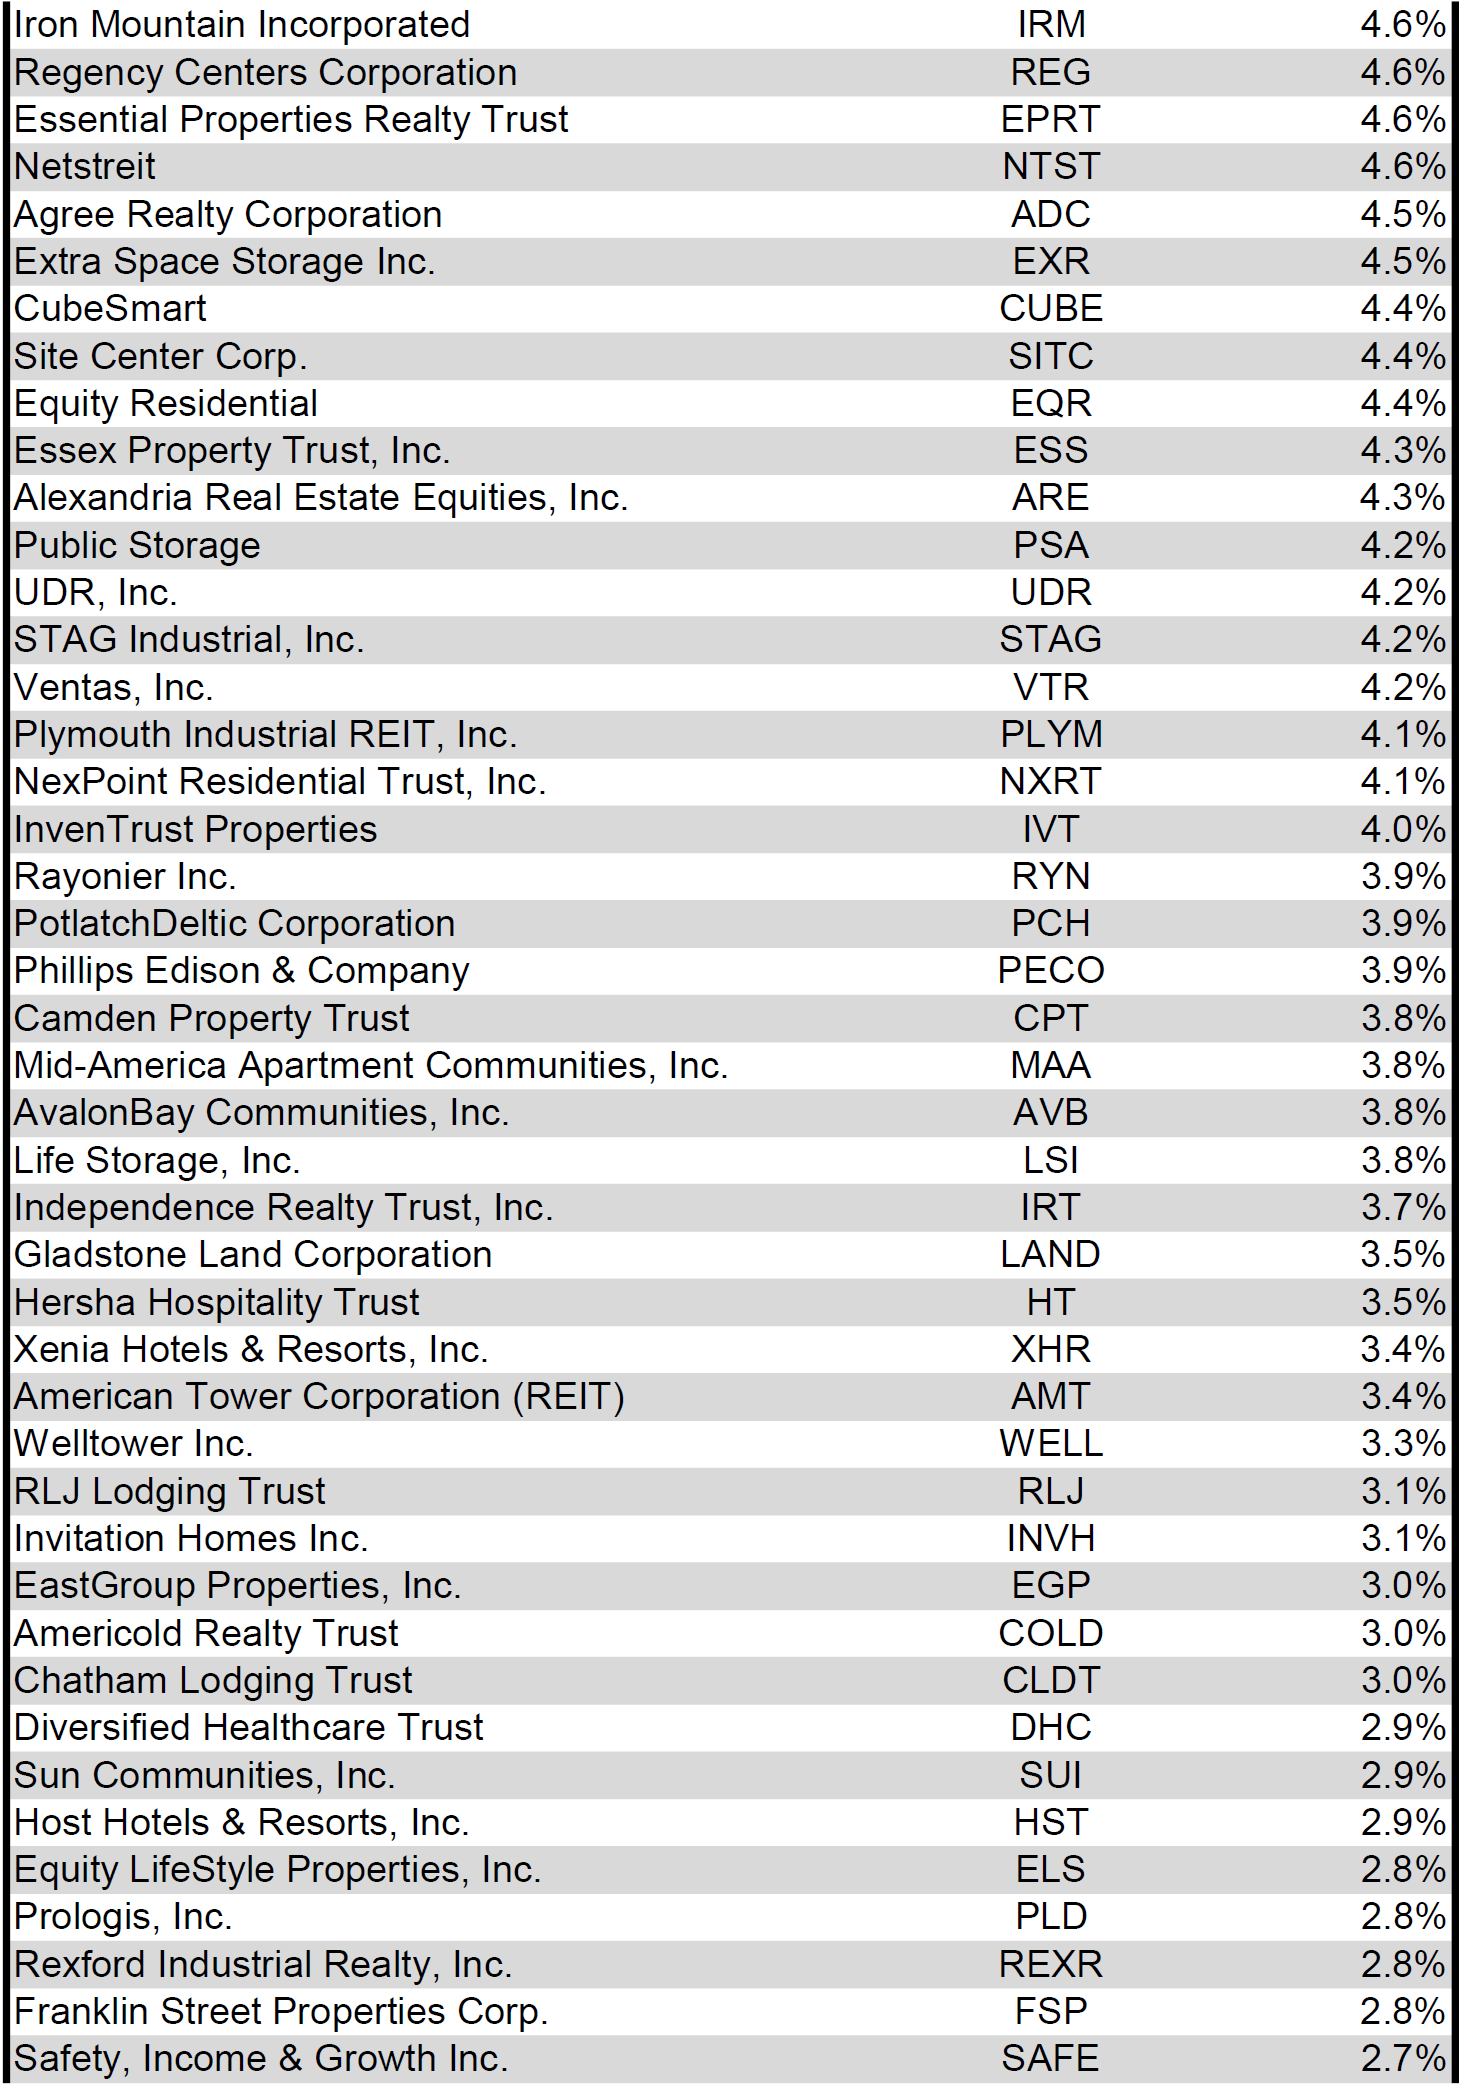
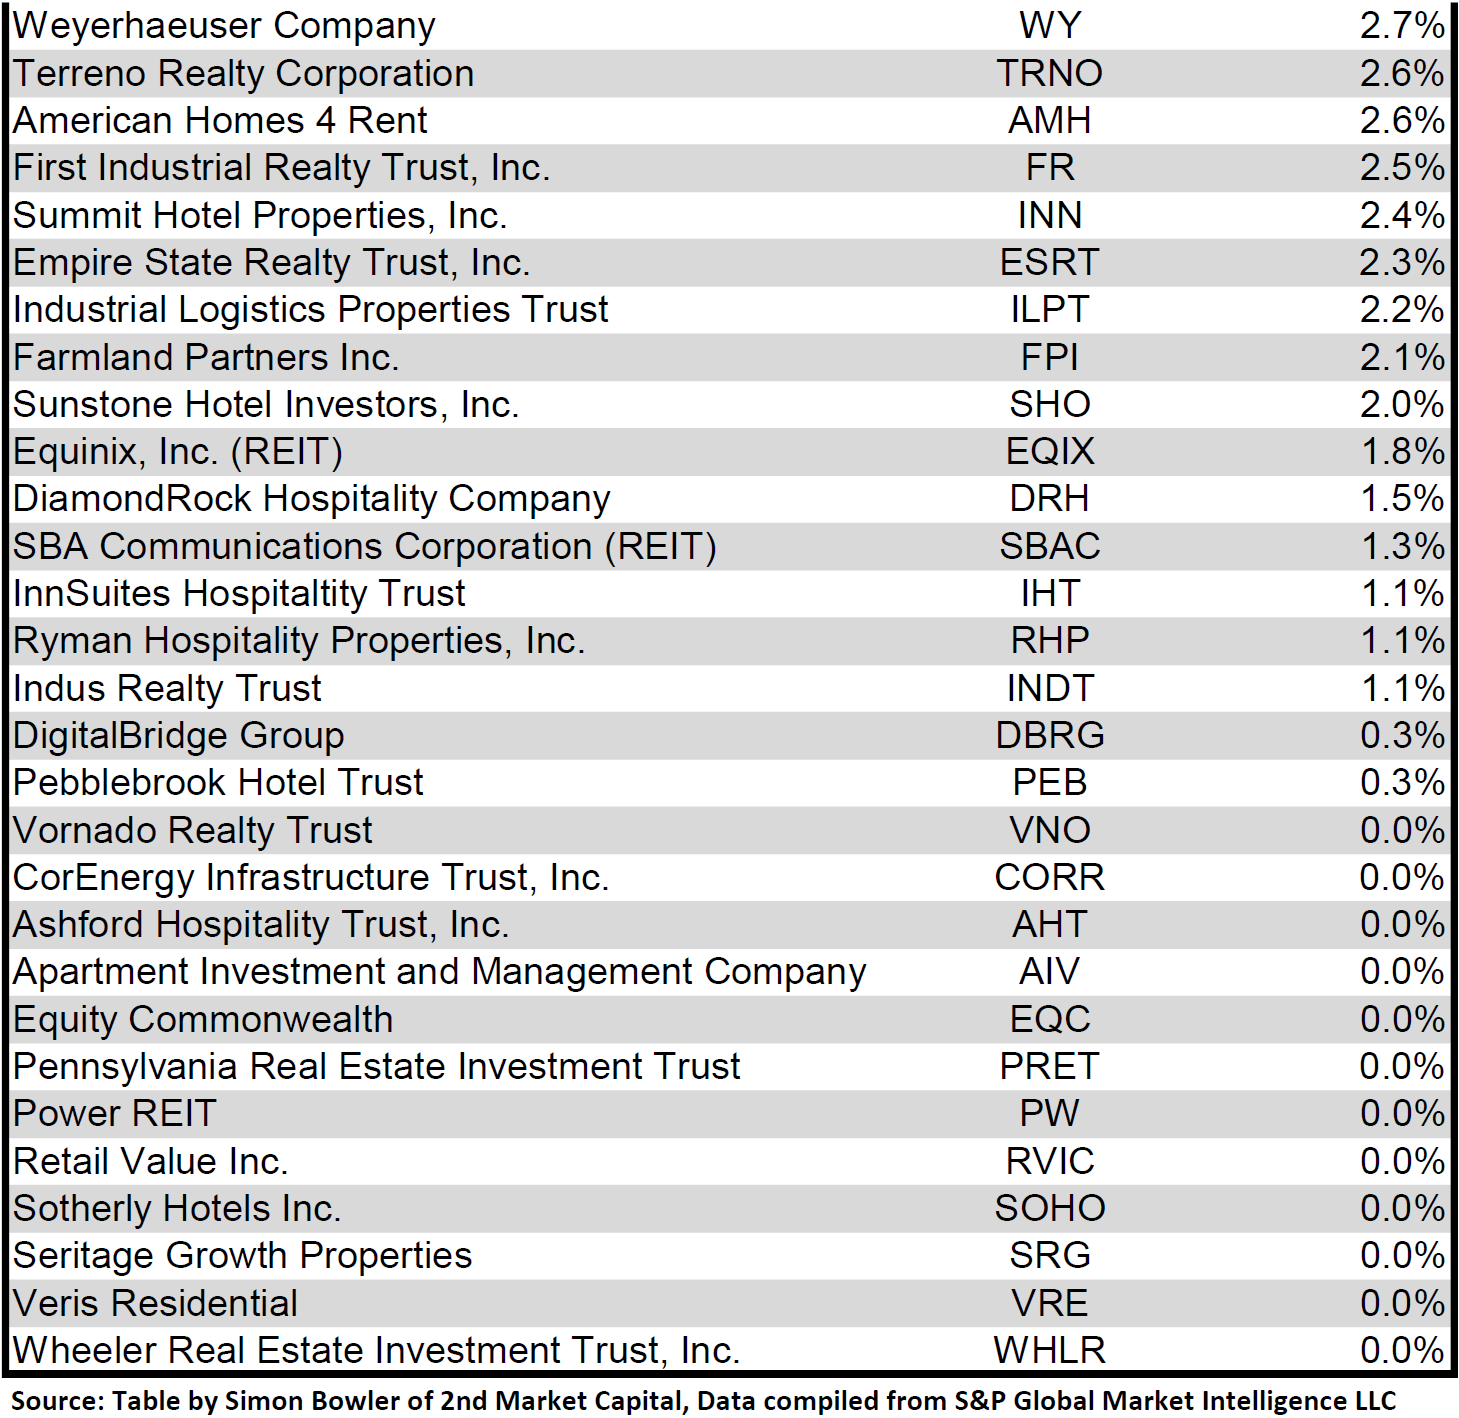
Dividend yield is an important component of a REIT's total return. The particularly high dividend yields of the REIT sector are, for many investors, the primary reason for investment in this sector. As many REITs are currently trading at share prices well below their NAV, yields are currently quite high for many REITs within the sector. Although a particularly high yield for a REIT may sometimes reflect a disproportionately high risk, there exist opportunities in some cases to capitalize on dividend yields that are sufficiently attractive to justify the underlying risks of the investment. I have included below a table ranking equity REITs from highest dividend yield (as of 05/31/2023) to lowest dividend yield.
Source: Table by Simon Bowler of 2nd Market Capital, Data compiled from S&P Global Market Intelligence LLC. See important notes and disclosures at the end of this article Source: Table by Simon Bowler of 2nd Market Capital, Data compiled from S&P Global Market Intelligence LLC. See important notes and disclosures at the end of this article Source: Table by Simon Bowler of 2nd Market Capital, Data compiled from S&P Global Market Intelligence LLC. See important notes and disclosures at the end of this article Source: Table by Simon Bowler of 2nd Market Capital, Data compiled from S&P Global Market Intelligence LLC. See important notes and disclosures at the end of this article
For the convenience of reading this table in a larger font, the table above is available as a PDF as well .
Although a REIT’s decision regarding whether to pay a quarterly dividend or a monthly dividend does not reflect on the quality of the company’s fundamentals or operations, a monthly dividend allows for a smoother cash flow to the investor. Below is a list of equity REITs that pay monthly dividends ranked from highest yield to lowest yield.
Source: Table by Simon Bowler of 2nd Market Capital, Data compiled from S&P Global Market Intelligence LLC. See important notes and disclosures at the end of this article
Valuation
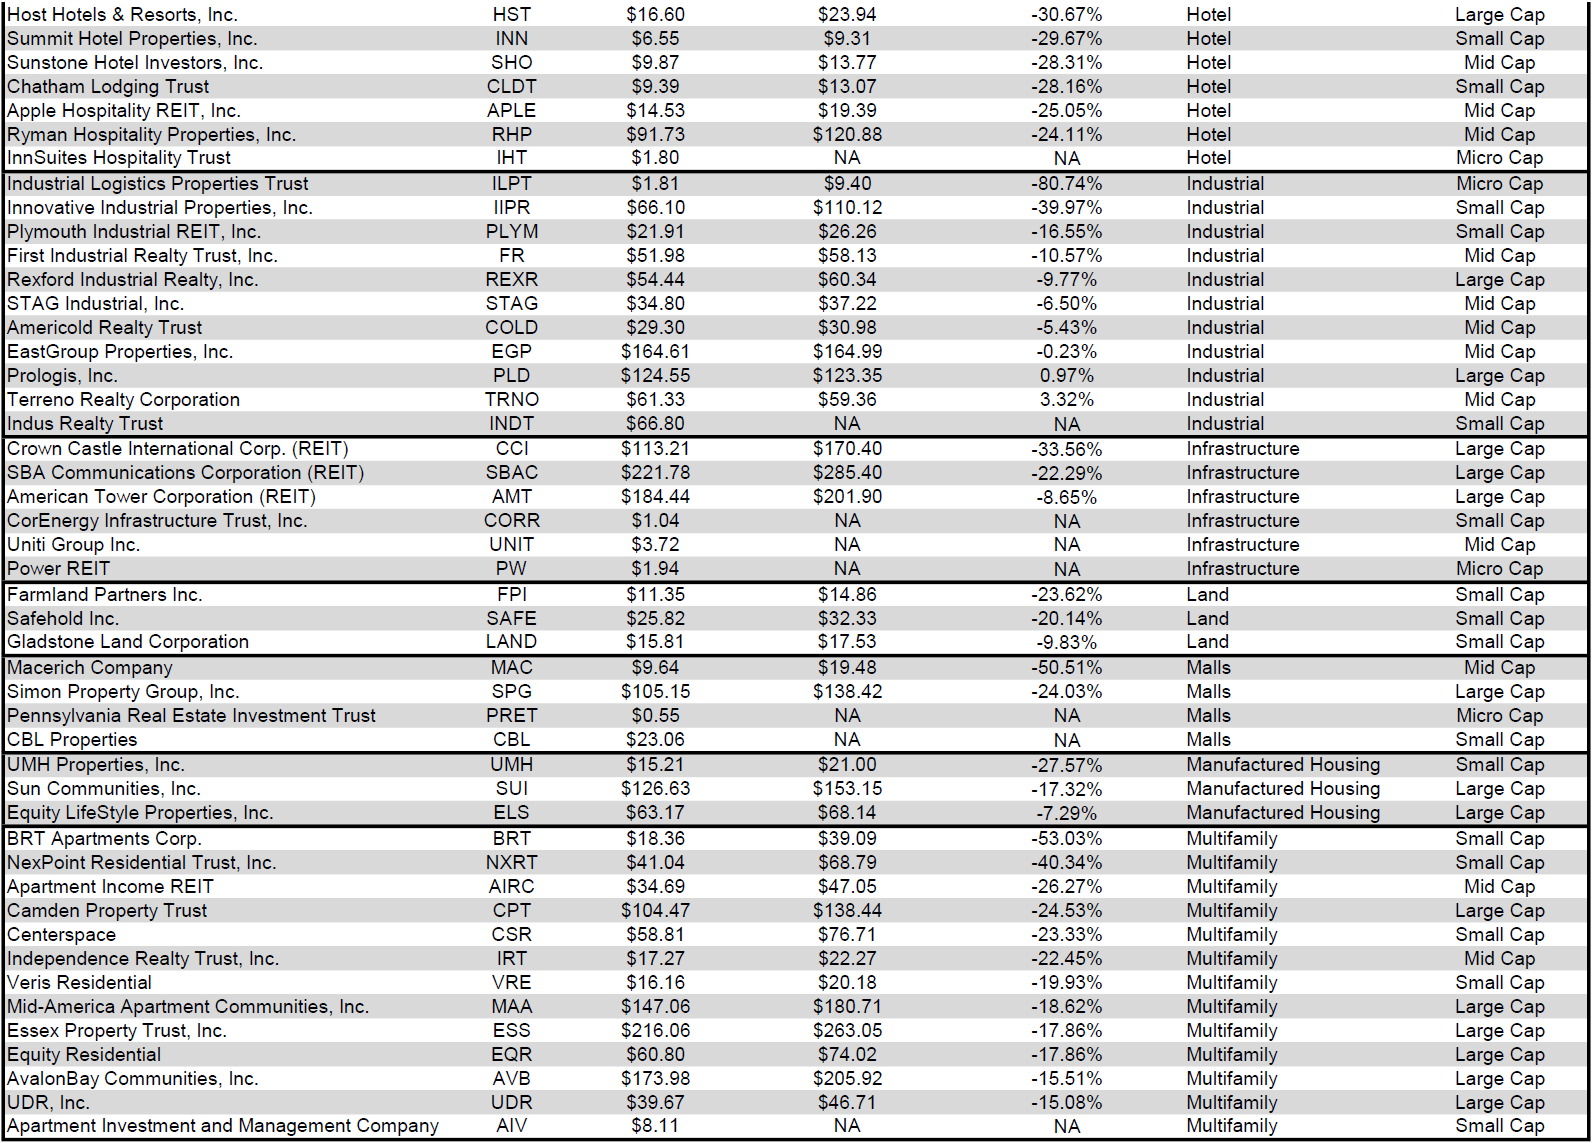
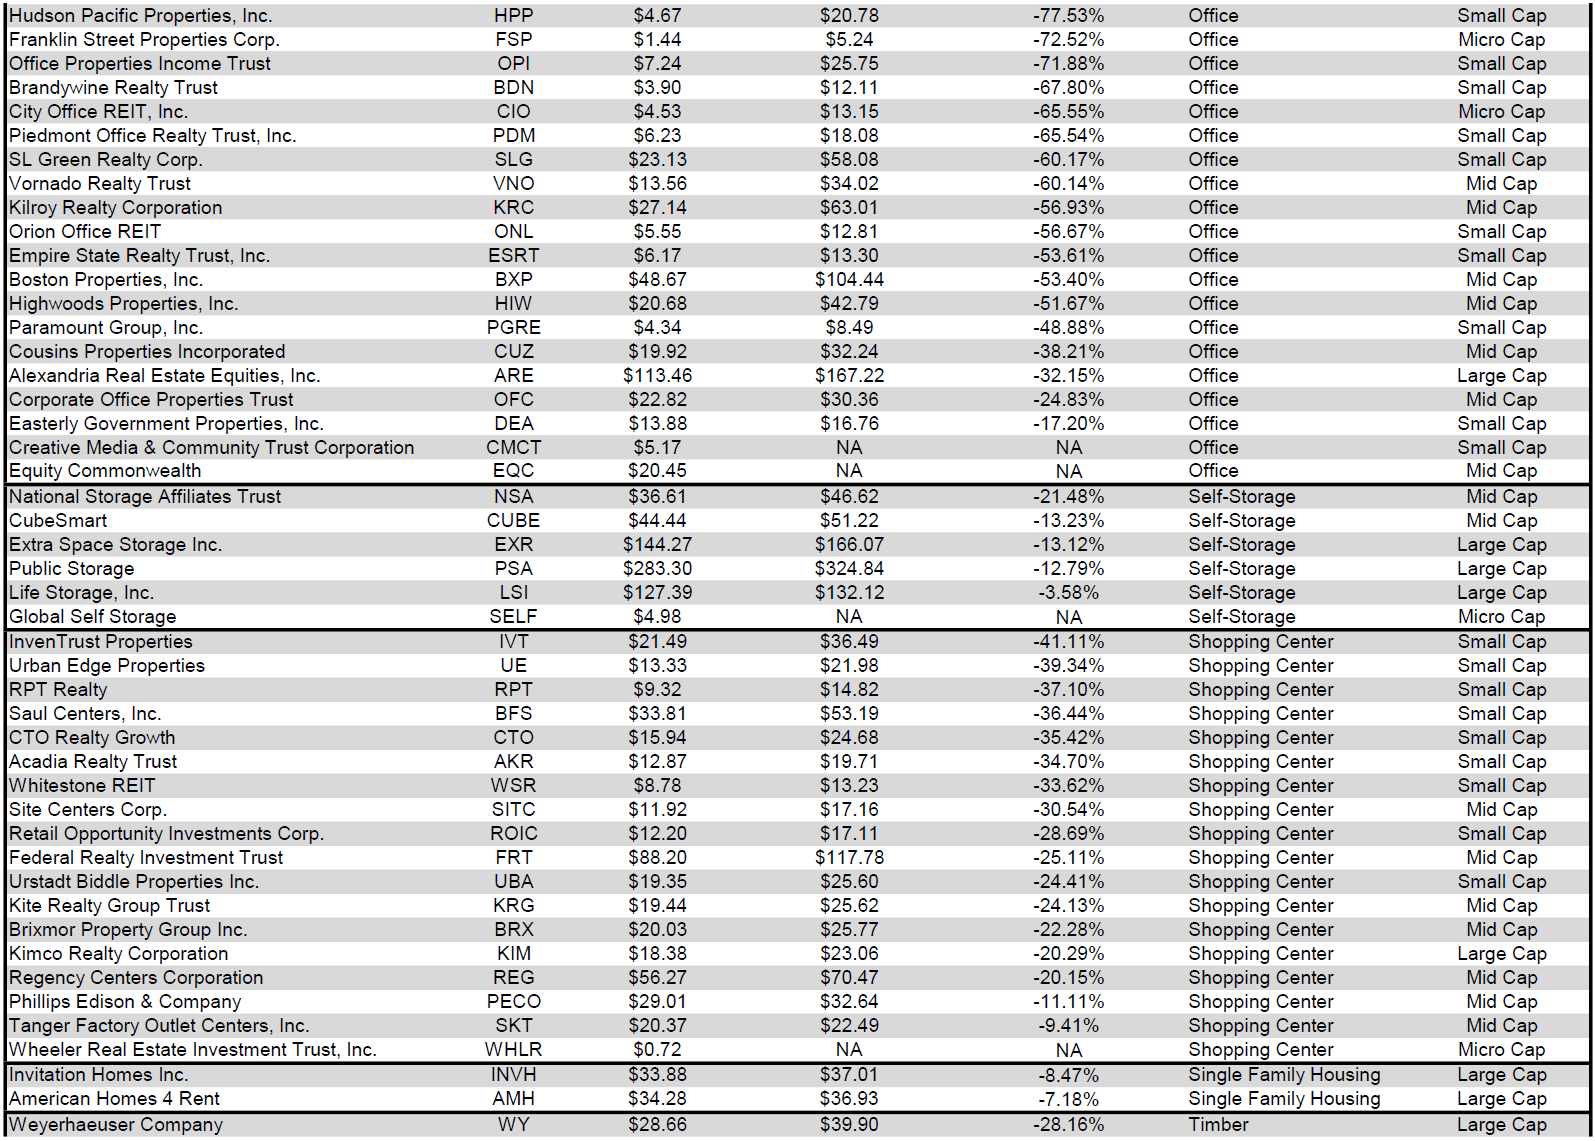
REIT Premium/Discount to NAV by Property Type
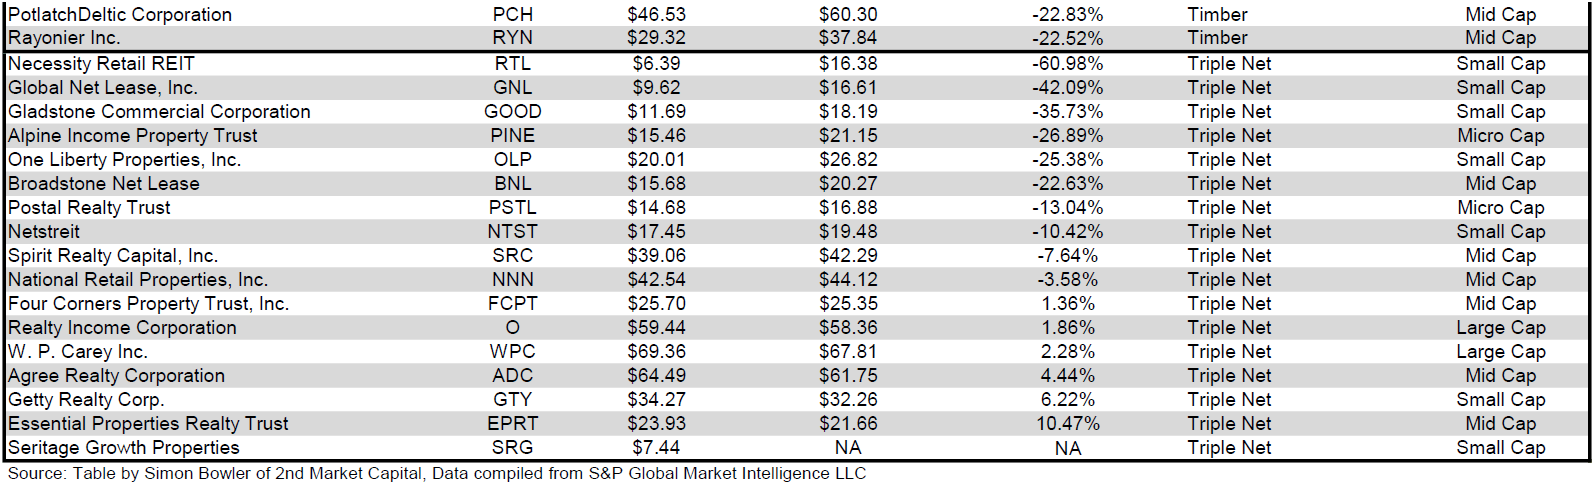
Below is a downloadable data table, which ranks REITs within each property type from the largest discount to the largest premium to NAV. The consensus NAV used for this table is the average of analyst NAV estimates for each REIT. Both the NAV and the share price will change over time, so I will continue to include this table in upcoming issues of The State of REITs with updated consensus NAV estimates for each REIT for which such an estimate is available.
Source: Table by Simon Bowler of 2nd Market Capital, Data compiled from S&P Global Market Intelligence LLC. See important notes and disclosures at the end of this article Source: Table by Simon Bowler of 2nd Market Capital, Data compiled from S&P Global Market Intelligence LLC. See important notes and disclosures at the end of this article Source: Table by Simon Bowler of 2nd Market Capital, Data compiled from S&P Global Market Intelligence LLC. See important notes and disclosures at the end of this article Source: Table by Simon Bowler of 2nd Market Capital, Data compiled from S&P Global Market Intelligence LLC. See important notes and disclosures at the end of this article
For the convenience of reading this table in a larger font, the table above is available as a PDF as well .
Takeaway
The large cap REIT premium (relative to small cap REITs) widened again in May and investors are now paying on average about 49% more for each dollar of 2023 FFO/share to buy large cap REITs than small cap REITs (16.7x/11.2x - 1 = 49.1%). As can be seen in the table below, there is presently a strong positive correlation between market cap and FFO multiple.
Source: Table by Simon Bowler of 2nd Market Capital, Data compiled from S&P Global Market Intelligence LLC. See important notes and disclosures at the end of this article
The table below shows the average premium/discount of REITs of each market cap bucket. This data, much like the data for price/FFO, shows a strong, positive correlation between market cap and Price/NAV. The average large cap REIT (-12.47%) trades at a low double digit discount to NAV, while mid cap REITs (-19.85%) trade at about 4/5 of NAV. Small cap REITs (-35.22%) trade at a little below 2/3 of NAV. Micro caps on average trade at less than half of their respective NAVs (-54.31%).
Source: Table by Simon Bowler of 2nd Market Capital, Data compiled from S&P Global Market Intelligence LLC. See important notes and disclosures at the end of this article
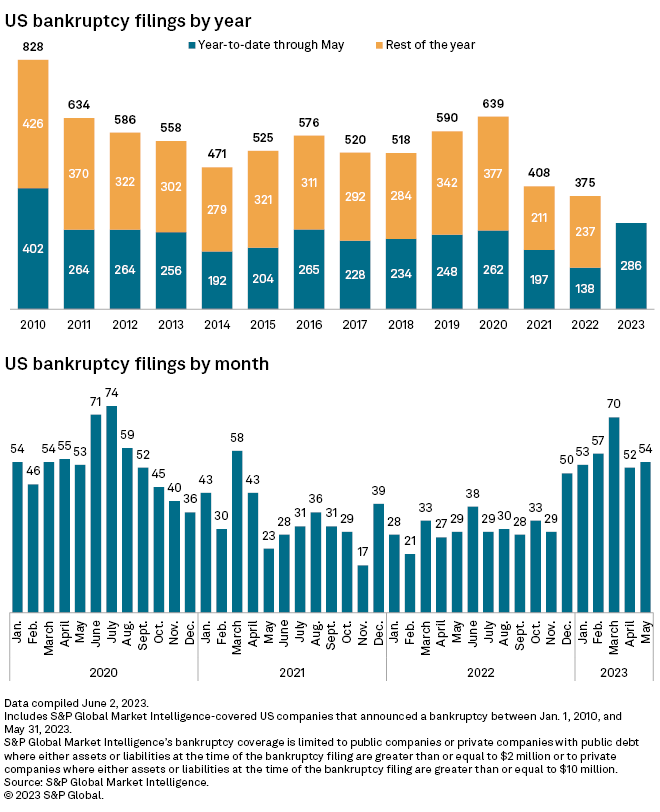
The number of bankruptcy filings in May increased month over month. In the first five months of 2023, there have been more filings than in the first five months of any year since 2010 and more than twice as many as there were over the same period last year. As the impact of higher interest rates continues to ripple through the economy, bankruptcies are likely to remain elevated and may even grow more severe in the 2 nd half of the year.
Source: S&P Global Market Intelligence
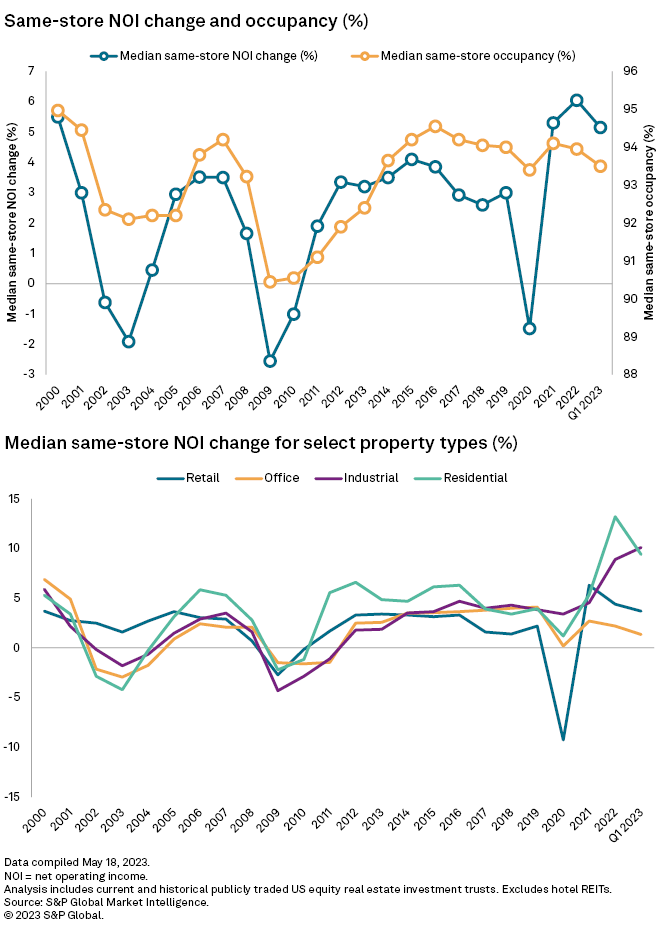
REITs are continuing to see strong positive same-store NOI growth (+5.2% in Q1 2023), albeit a bit lower than in full year 2022 (+6.1%) or Q4 2022 (+5.6%). Median REIT occupancy remained pretty stable at 93.5%, declining only 10 basis points from 93.6% in Q4 2022. However, this remains lower than the 94.1% in full year 2021 and 94% in full year 2022.
Source: S&P Global Market Intelligence
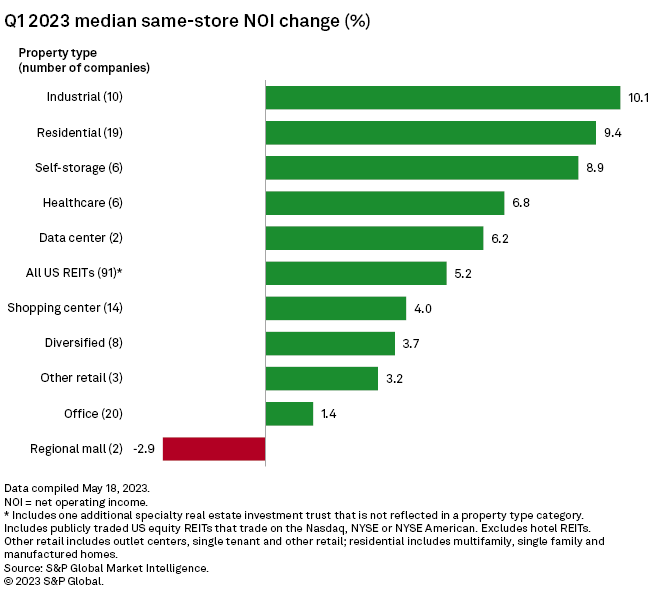
In Q1 2023, Industrial overtook Residential as the property type with the strongest median same-store NOI growth with an impressive 10.1% year over year increase. This was nearly double the overall REIT median SS-NOI growth of 5.2%. Malls were the only property type with a negative median SS-NOI growth (-2.9%).
Source: S&P Global Market Intelligence
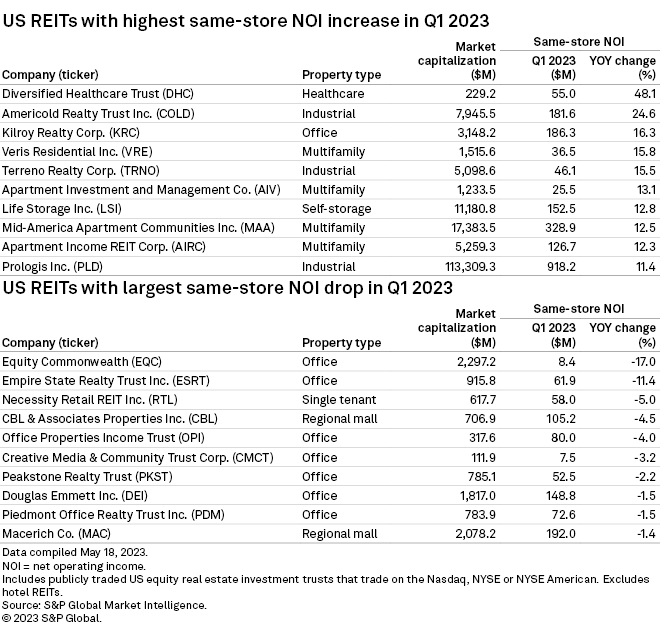
Office fundamentals remain poor as the shift to working from home continues to have a significant impact on the sector. Office REITs accounted for 7 out of the 10 REITs with the most severe SS-NOI declines in Q1 2023. Equity Commonwealth ( EQC ) and Empire State Realty Trust ( ESRT ) saw the biggest negative impact in Q1 with double digit SS-NOI declines of -17% and -11.4% respectively.
Source: S&P Global Market Intelligence
Multifamily and Industrial dominated the list of REITs with the highest SS-NOI growth in Q1 2023. Americold Realty Trust ( COLD ) led all Industrial REITs with 24.6% SS-NOI growth, followed by Terreno Realty ( TRNO ) and Prologis ( PLD ). Prologis’ inclusion on this list is remarkable given that Prologis’ market cap is more than double that of the other 9 REITs on the list combined, demonstrating that tremendous growth can be achieved at any size with the right management team and strategy. Regardless of market cap or property type, it is very important for investors to understand a REIT’s quality of management and portfolio strategy before investing any money. A property portfolio led by a strong management team is very likely to outperform in the long-run over a similar portfolio led by a poor management team. Careful research can help investors identify strong REIT management teams that will outperform in the long-run.
For further details see:
The State Of REITs: June 2023 Edition