RDOG - The State Of REITs: May 2023 Edition
2023-05-16 18:52:52 ET
Summary
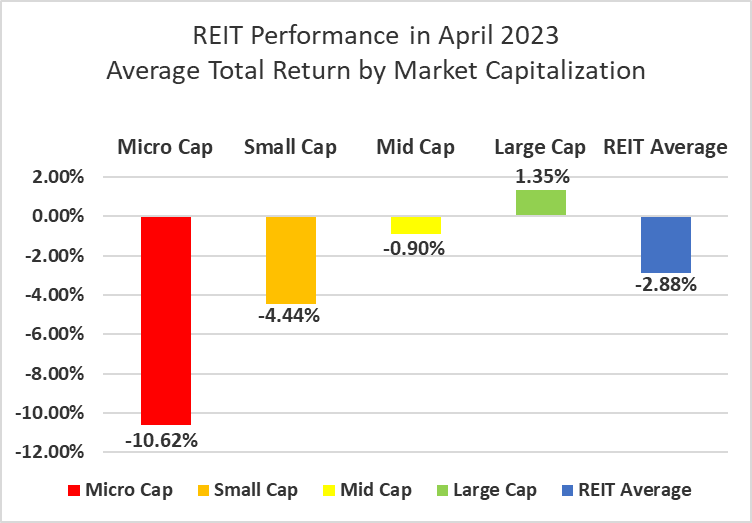
- The REIT sector declined for the 3rd month in a row with a -2.88% total return in April.
- Large-cap REITs (+1.35%) saw gains, while mid caps (-0.90%), small caps (-4.44%) and micro caps (-10.62%) all finished April in the red.
- 34.18% of REIT securities had a positive total return in April.
- Single Family Housing (+6.30%) and Advertising (+4.22%) REITs saw strong gains in April. Infrastructure (-9.67%) and Office (-7.24%) REITs underperformed their REIT peers.
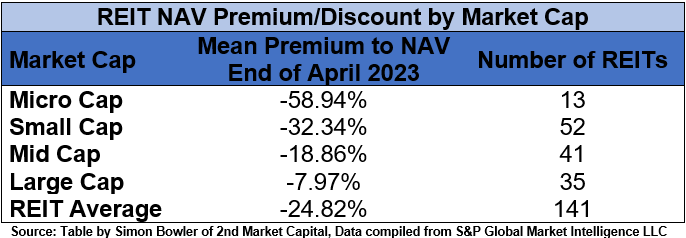
- The average REIT NAV discount widened from -23.51% to -24.82% during April. The median NAV discount narrowed from -22.22% to -20.73%.
REIT Performance
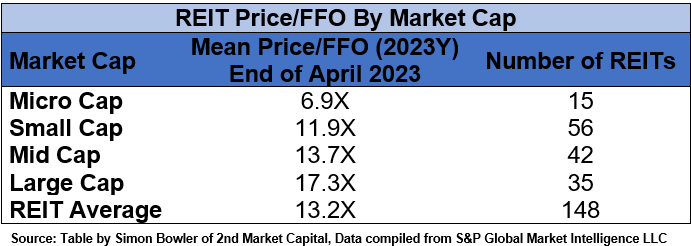
The REIT sector continues to feel the pain of rising interest rates with equity REITs averaging a negative total return for the 3 rd straight month (-2.88%). REITs underperformed the Dow Jones Industrial Average (+2.6%), S&P 500 (+1.6%) and NASDAQ (+0.1%). The market cap weighted Vanguard Real Estate ETF ( VNQ ) had a much better total return than the average REIT in April (+0.31% vs. -2.88%) and is significantly outperforming YTD (+1.98% vs. -4.13%). The spread between the 2023 FFO multiples of large cap REITs (17.3x) and small cap REITs (11.9x) widened in April as multiples held steady for large caps and contracted 0.2 turns for small caps. Investors currently need to pay an average of 45.4% more for each dollar of FFO from large cap REITs relative to small cap REITs. In this monthly publication, I will provide REIT data on numerous metrics to help readers identify which property types and individual securities currently offer the best opportunities to achieve their investment goals.
Source: Graph by Simon Bowler of 2nd Market Capital, Data compiled from S&P Global Market Intelligence LLC. See important notes and disclosures at the end of this article
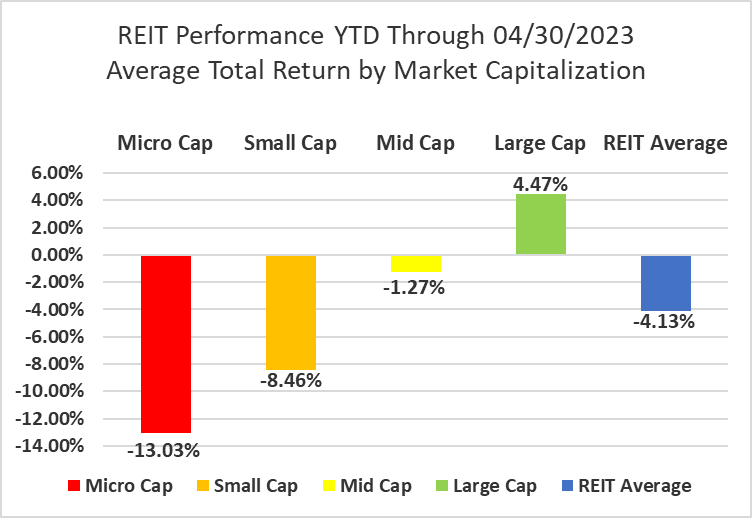
There was a strong positive correlation between total return and market cap in April. Large cap REITs (+1.35%) outperformed their smaller peers, with mid cap (-0.90%), small cap (-4.44%) and micro cap (-10.62%) REITs all averaging negative returns. Large cap REITs (+4.47%) are outperforming small caps (-8.46%) by 1293 basis points on YTD 2023 total return.
Source: Graph by Simon Bowler of 2nd Market Capital, Data compiled from S&P Global Market Intelligence LLC. See important notes and disclosures at the end of this article
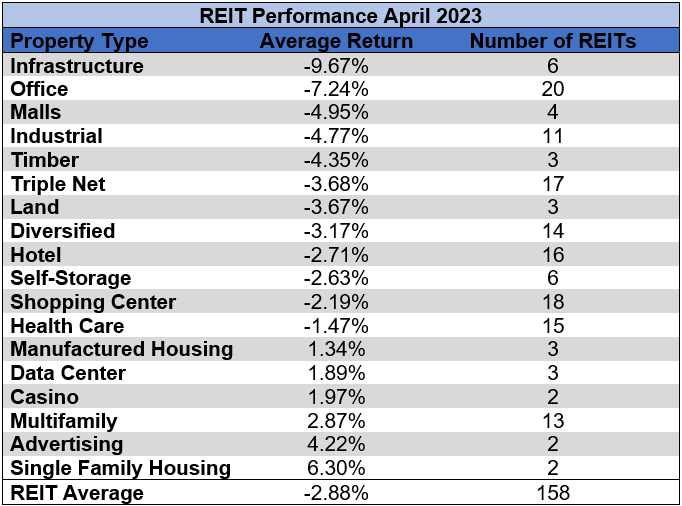
6 out of 18 Property Types Yielded Positive Total Returns in April
33.33% percent of REIT property types averaged a positive total return in April, with a 15.97% total return spread between the best and worst performing property types. Single Family Housing (+6.30%) and Advertising (+4.22%) were the best performing property types in April. Both of the Single Family Housing REITs, Invitation Homes ( INVH ) (+6.85%) and American Homes 4 Rent ( AMH ) (+5.76%), built upon the gains they achieved in Q1 2023.
Infrastructure (-9.67%) and Office (-7.24%) REITs continued to underperform their REIT peers in April. These troubled property types accounted for 7 of the 10 worst performing REITs in April.
Source: Table by Simon Bowler of 2nd Market Capital, Data compiled from S&P Global Market Intelligence LLC. See important notes and disclosures at the end of this article
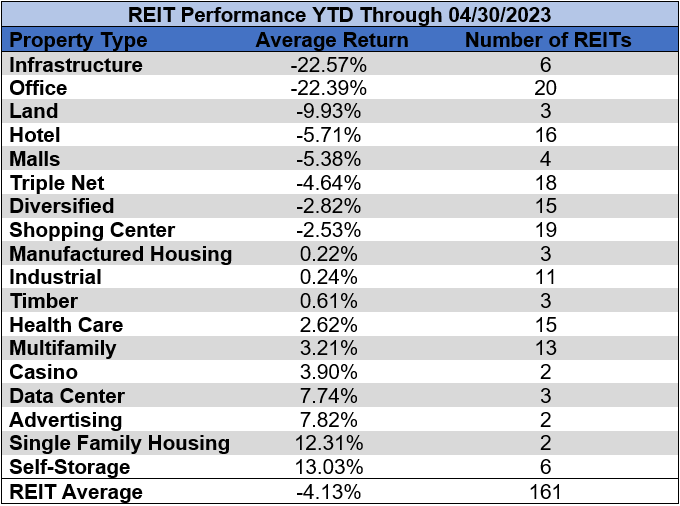
Infrastructure (-22.57%) and Office REITs (-22.39%) have severely underperformed over the first third of 2023 with both property types averaging losses more than 5X that of the average REIT. 10 of the 18 REIT property types are in the black YTD led by double digit positive total returns for Self Storage (+13.03%) and Single Family Housing (+12.31%).
Source: Table by Simon Bowler of 2nd Market Capital, Data compiled from S&P Global Market Intelligence LLC. See important notes and disclosures at the end of this article
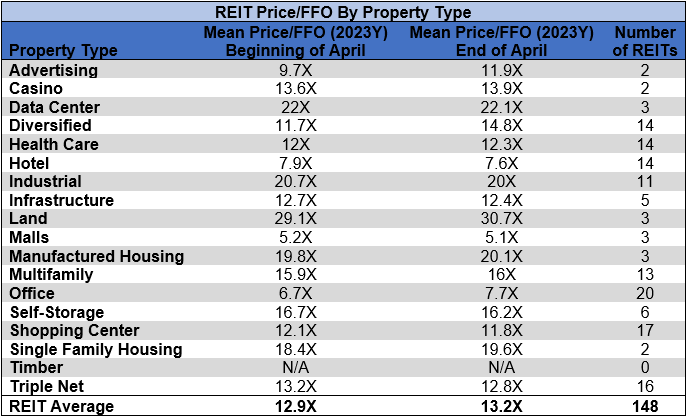
The REIT sector as a whole saw the average P/FFO (2023Y) increase 0.3 turns in April from 12.9x up to 13.2x. The average FFO multiple expanded for 58.8% of property types and contracted for 41.2%. There are no recent 2023 FFO/share estimates for any of the Timber REITs. Land (30.7x), Data Centers (22.1x), Manufactured Housing (20.1x) and Industrial (20.0x) continue to trade at the highest multiples among REIT property types. Mall (5.1x), Hotel (7.6x) and Office (7.7x) REITs are the only REITs currently trading at single digit multiples.
Source: Table by Simon Bowler of 2nd Market Capital, Data compiled from S&P Global Market Intelligence LLC. See important notes and disclosures at the end of this article
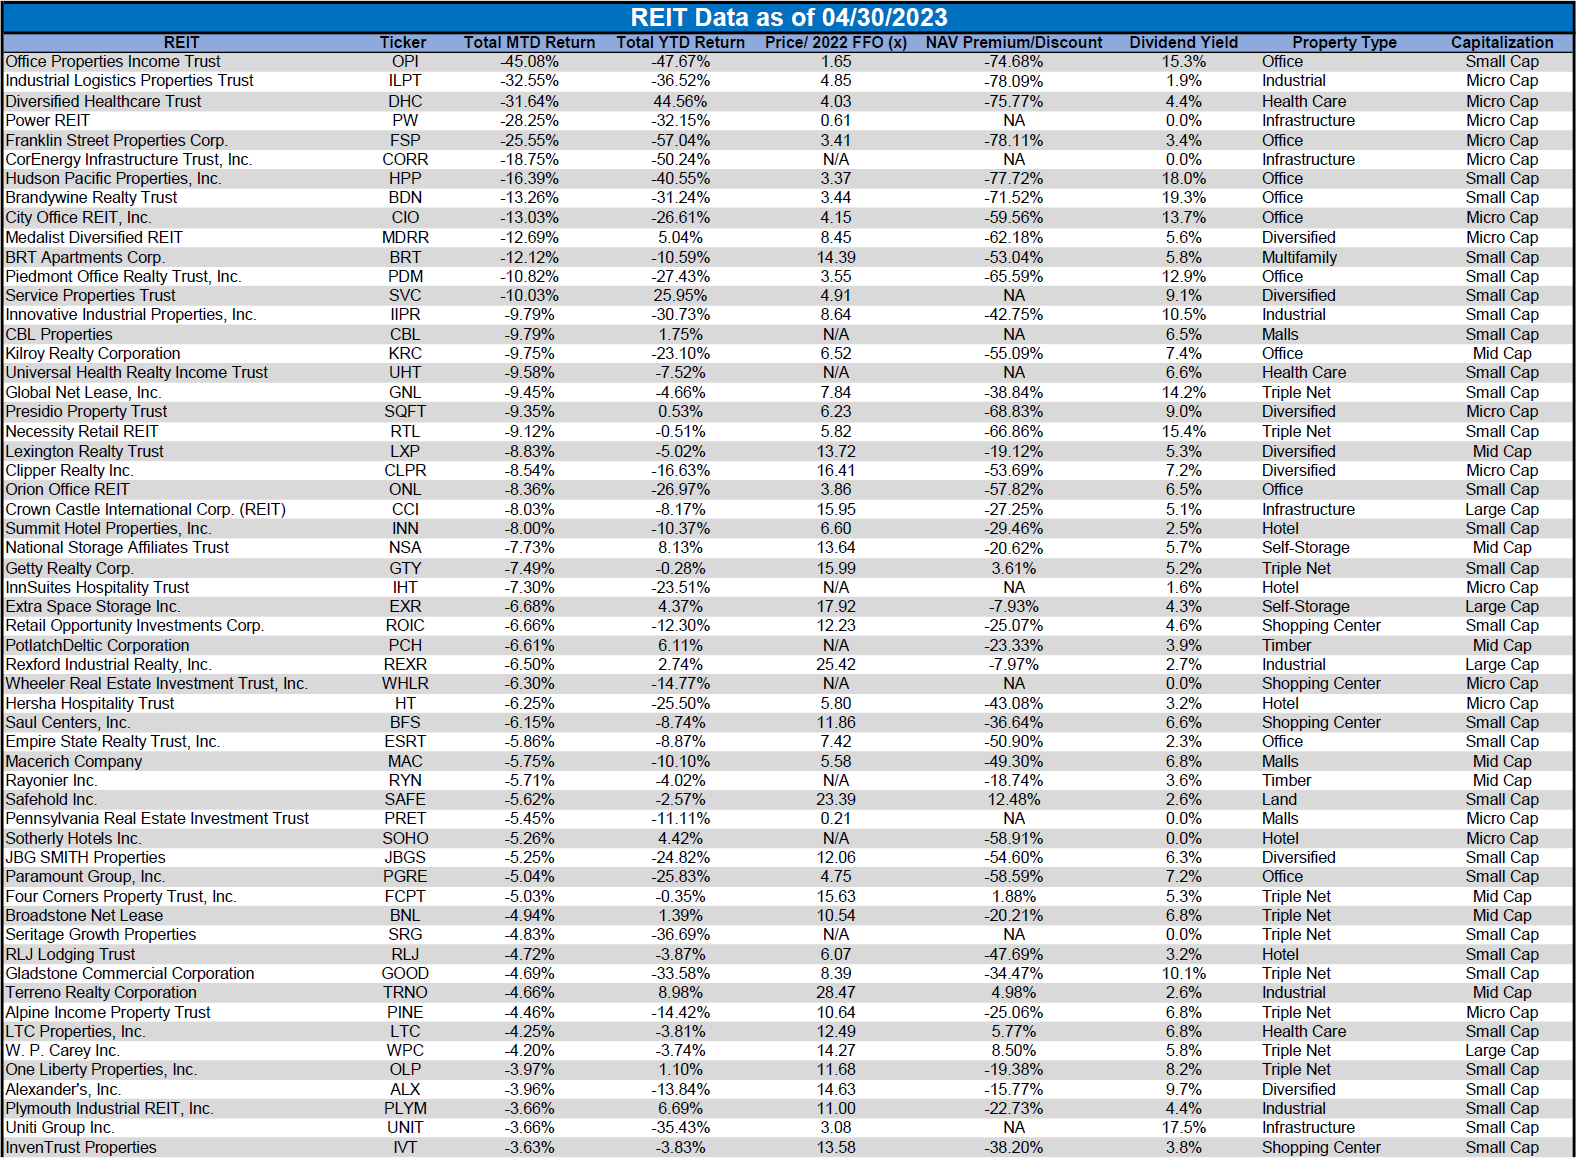
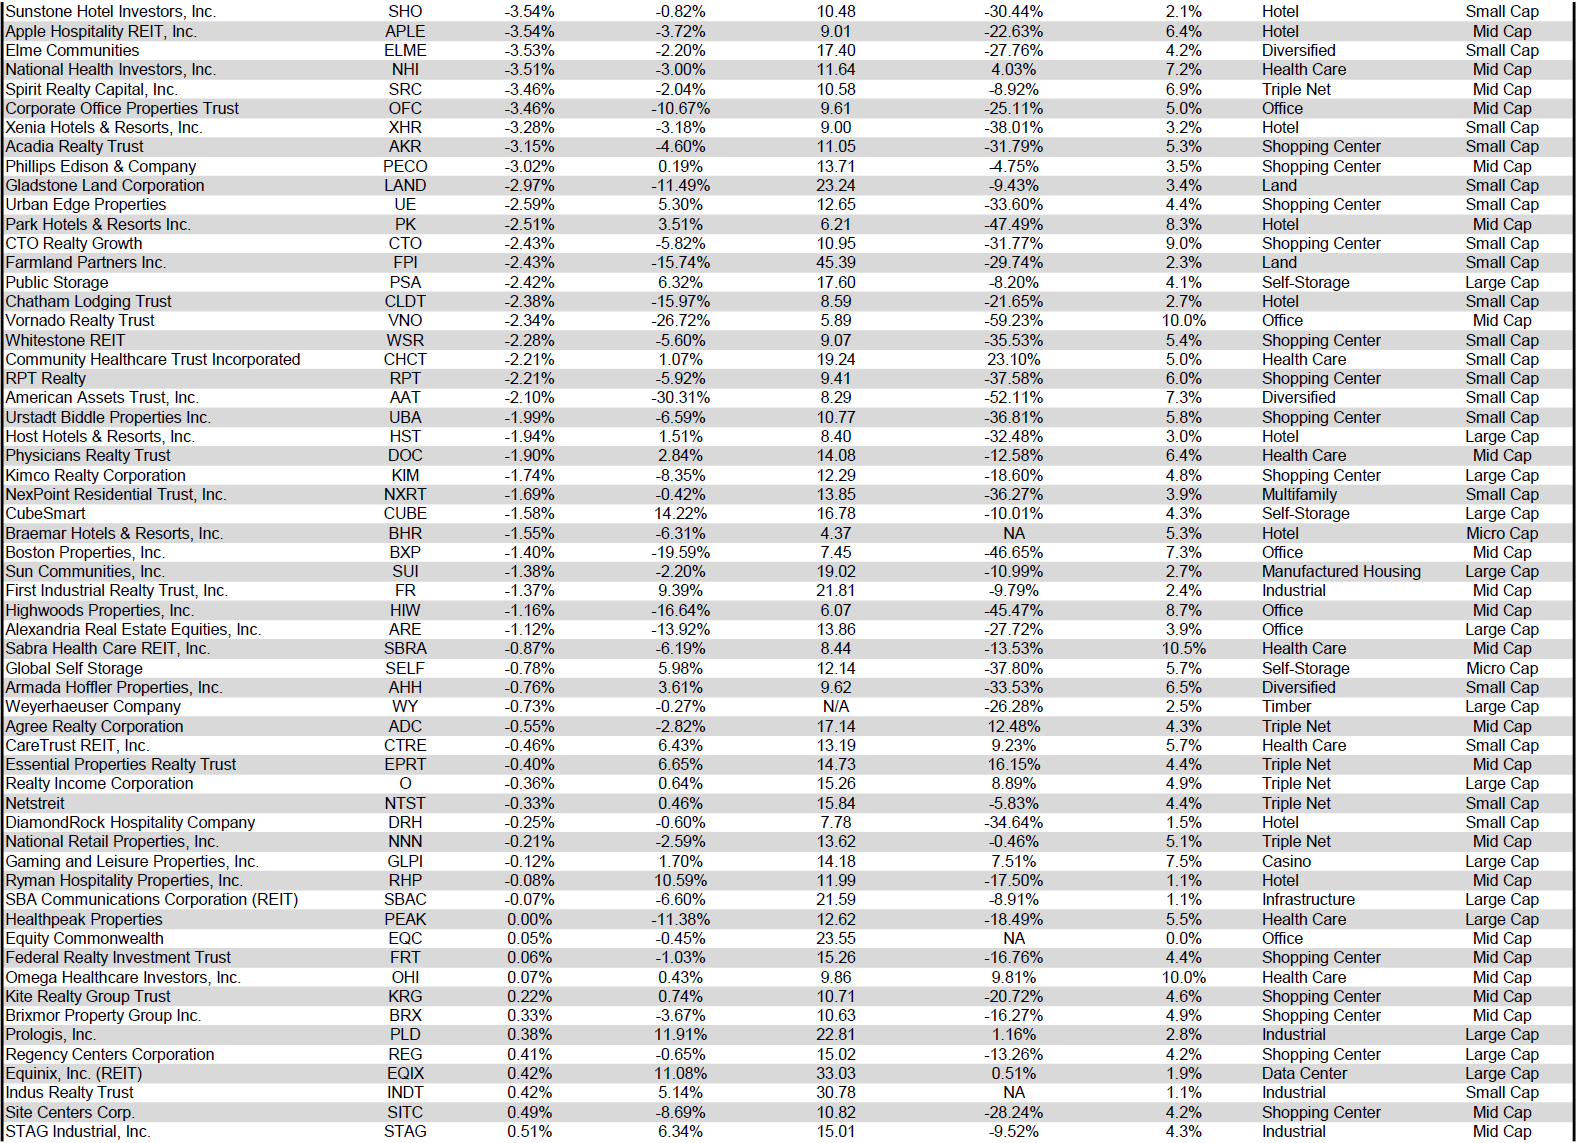
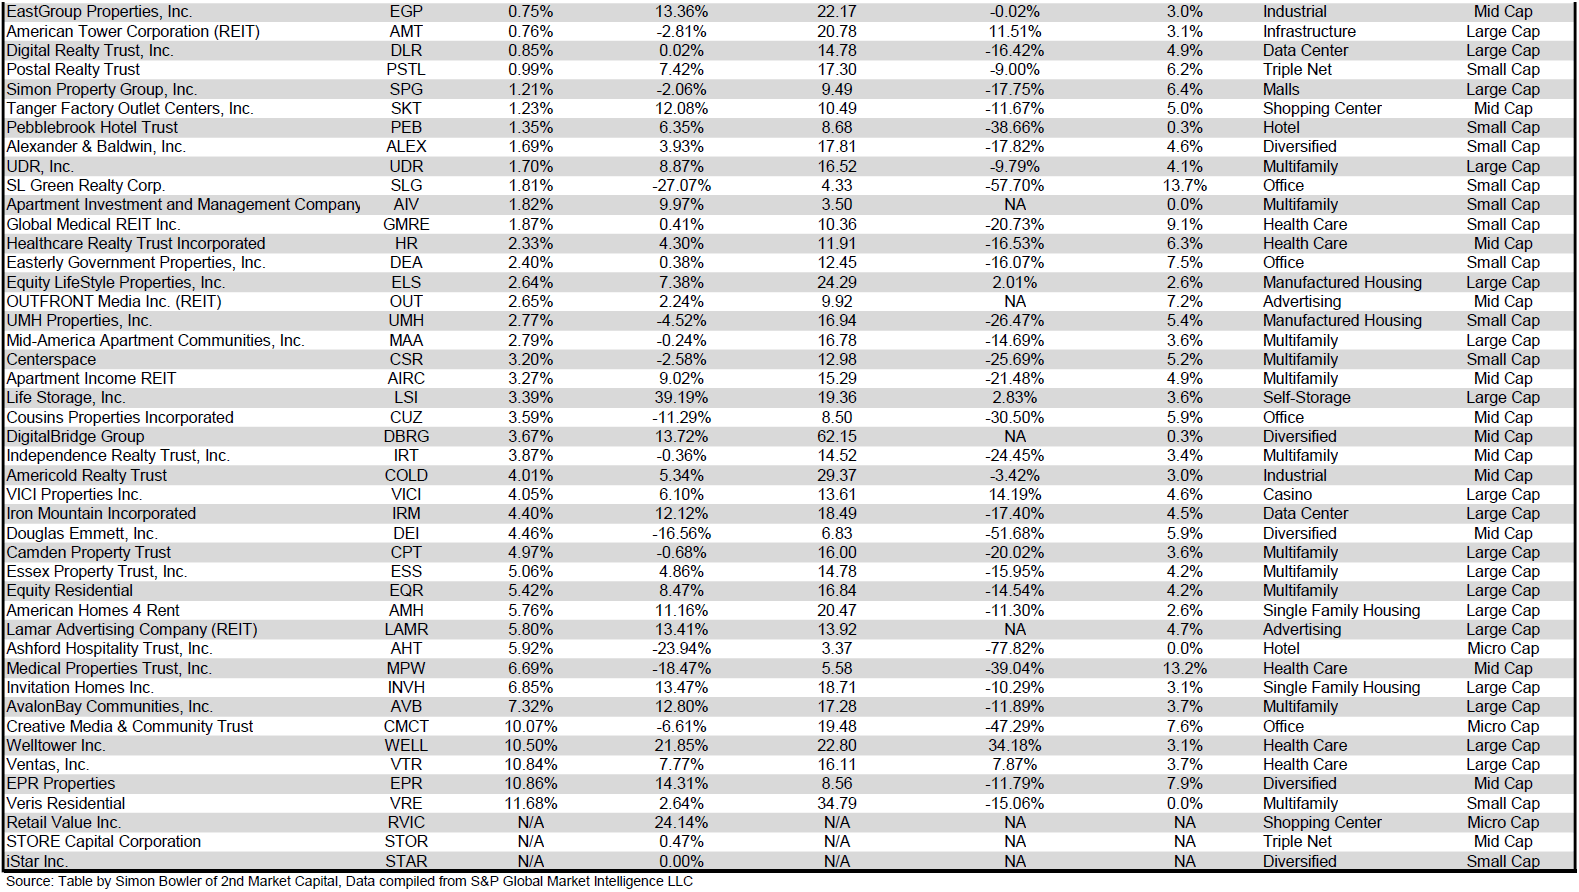
Performance of Individual Securities
Veris Residential ( VRE ) (+11.68%) was the top performing REIT in April, fueled in part by a strong Q1 earnings beat. On April 26 th Veris reported better than expected FFO/share as well as year over year improvement on multiple key metrics. VRE was one of only 5 equity REITs that achieved double digit positive returns in April.
A trio of RMR Group ( RMR ) managed REITs rounded out the worst performing REITs in April: Office Properties Income Trust ( OPI ) (-45.08%), Industrial Logistics Properties Trust ( ILPT ) (-32.55%) and Diversified Healthcare Trust ( DHC ) (-31.64%). RMR managed REITs are notorious for having historically delivered significantly worse investor returns than internally managed REITs or other externally managed REITs. April’s disproportionately brutal share price declines were driven by the announcement of a merger of OPI and DHC that is expected to close in Q3 2023. The combined entity will rebrand as Diversified Properties Trust and will continue to be managed by RMR.
34.18% of REITs had a positive total return in April with 42.86% in the black year to date. During the first four months of last year, the average REIT had a -7.01% return. During the first four months of this year, the average REIT has had a slightly less rough start with a -4.13% total return.
Source: Table by Simon Bowler of 2nd Market Capital, Data compiled from S&P Global Market Intelligence LLC. See important notes and disclosures at the end of this article Source: Table by Simon Bowler of 2nd Market Capital, Data compiled from S&P Global Market Intelligence LLC. See important notes and disclosures at the end of this article Source: Table by Simon Bowler of 2nd Market Capital, Data compiled from S&P Global Market Intelligence LLC. See important notes and disclosures at the end of this article
For the convenience of reading this table in a larger font, the table above is available as a PDF as well .
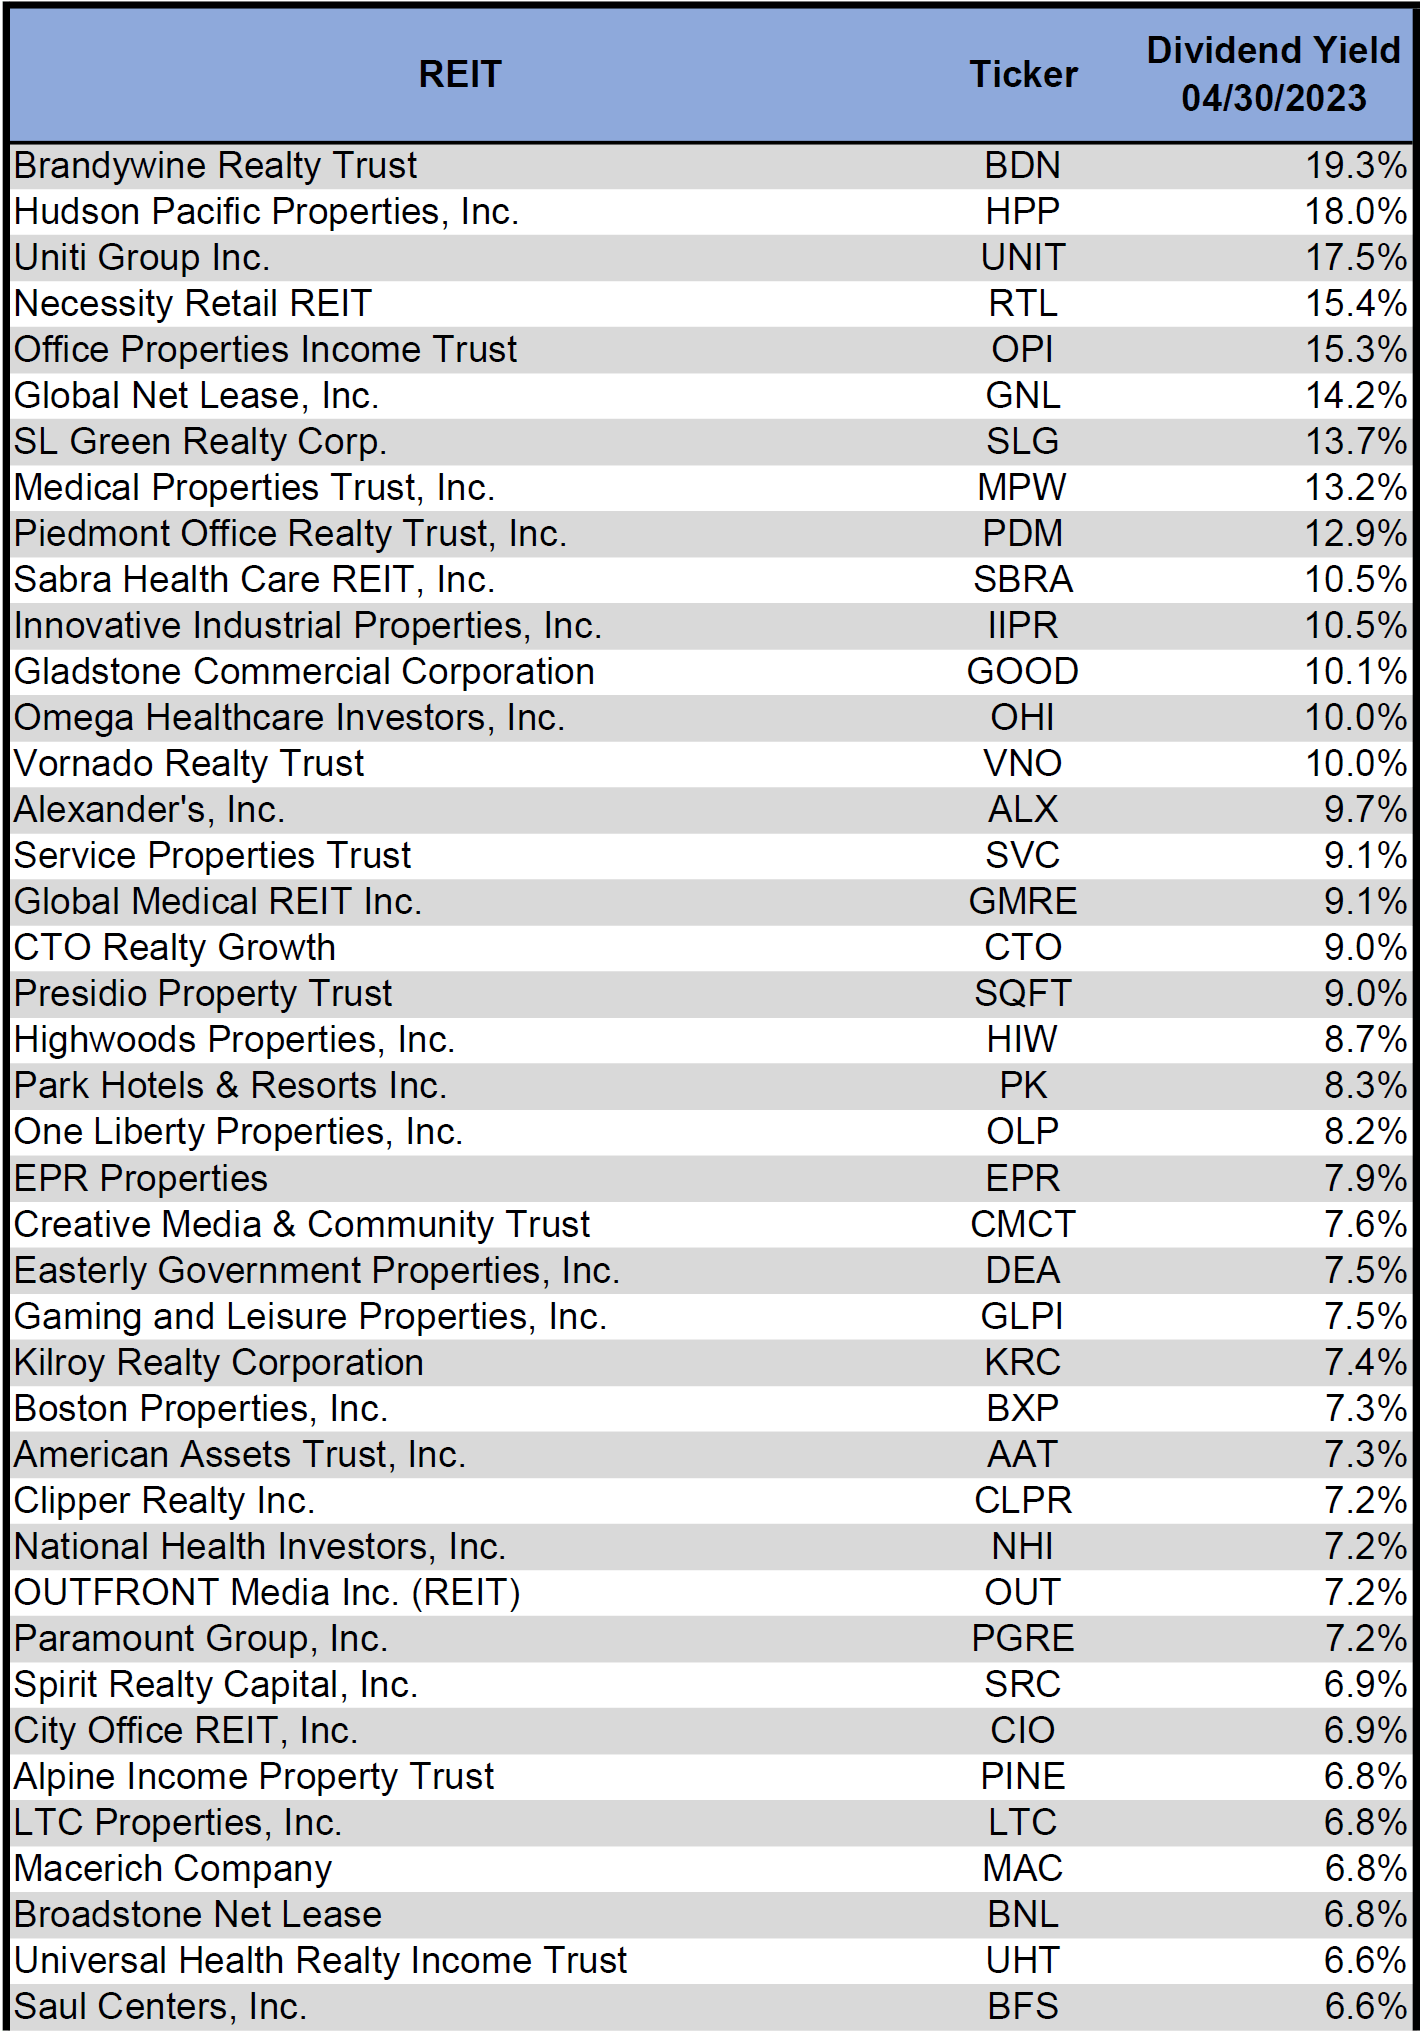
Dividend Yield
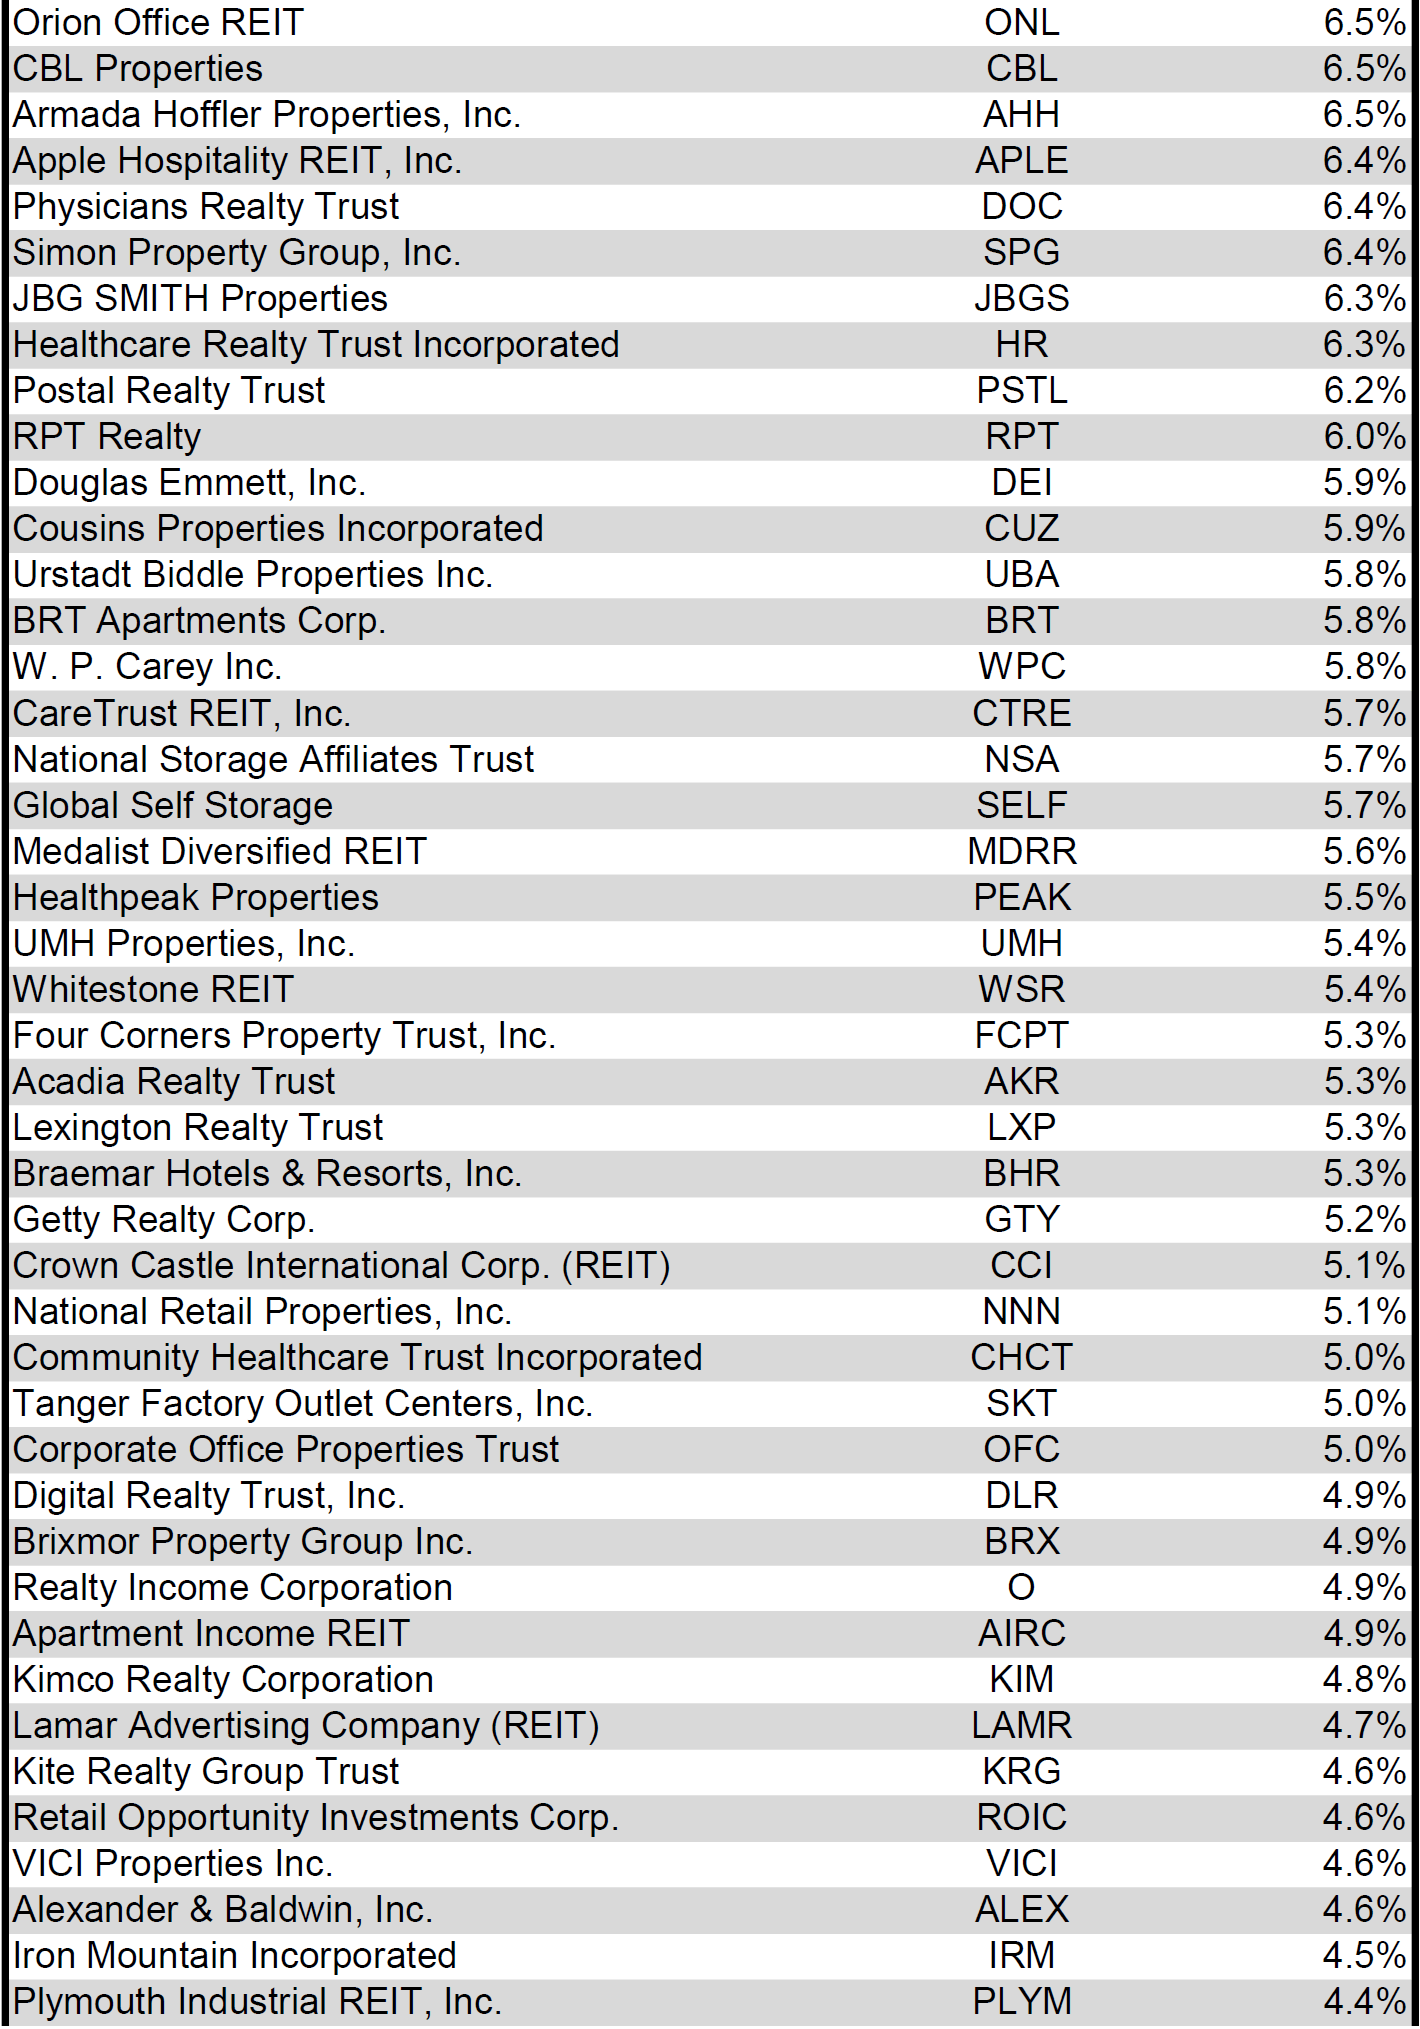
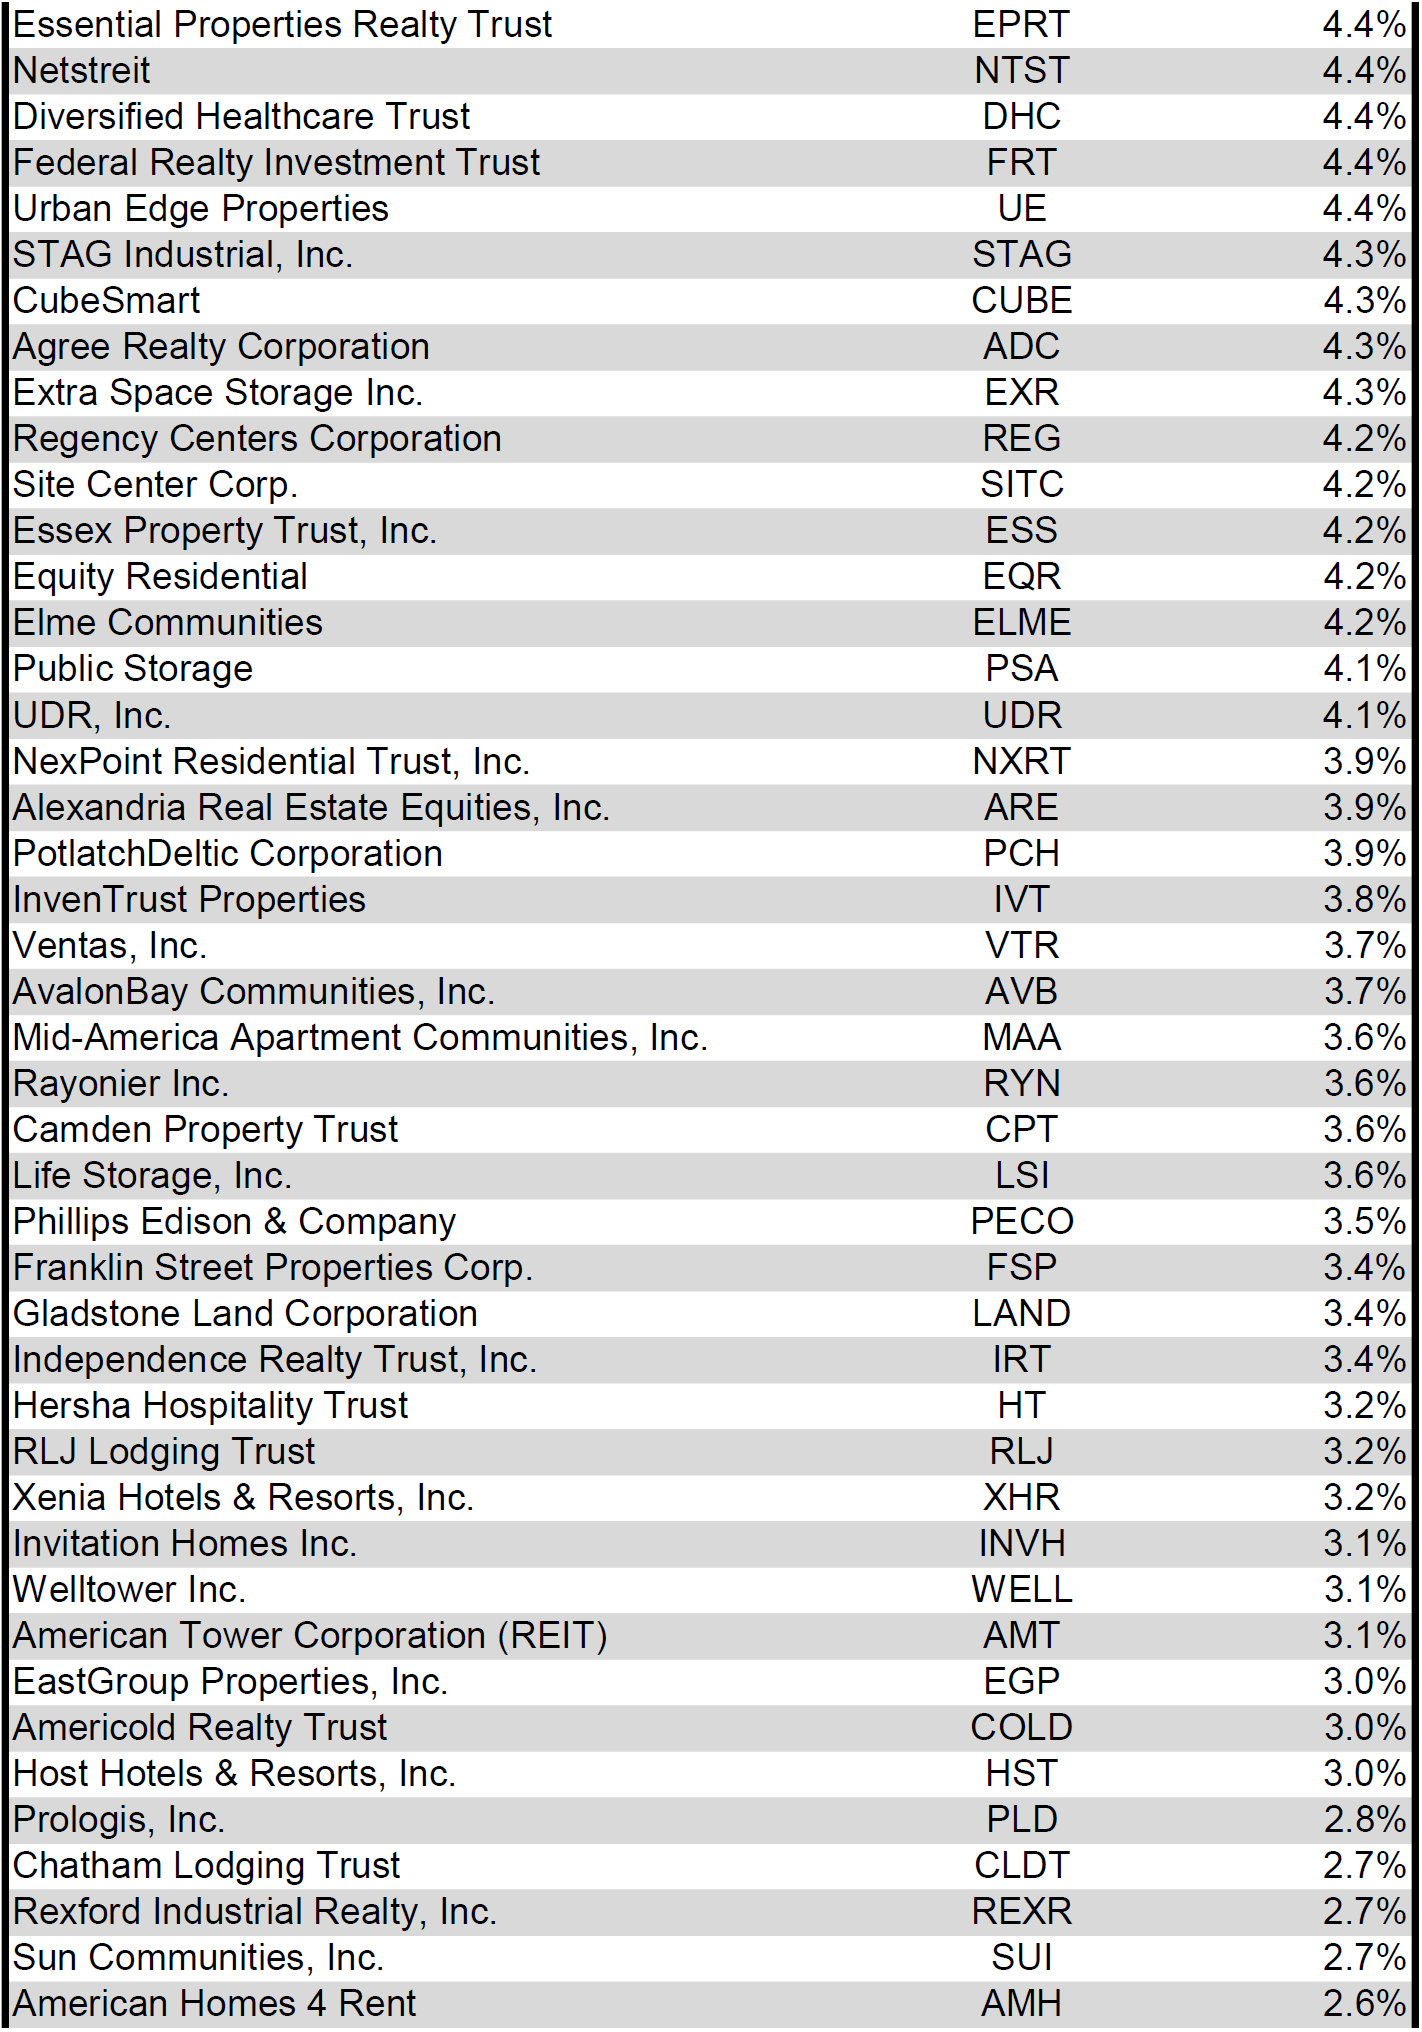
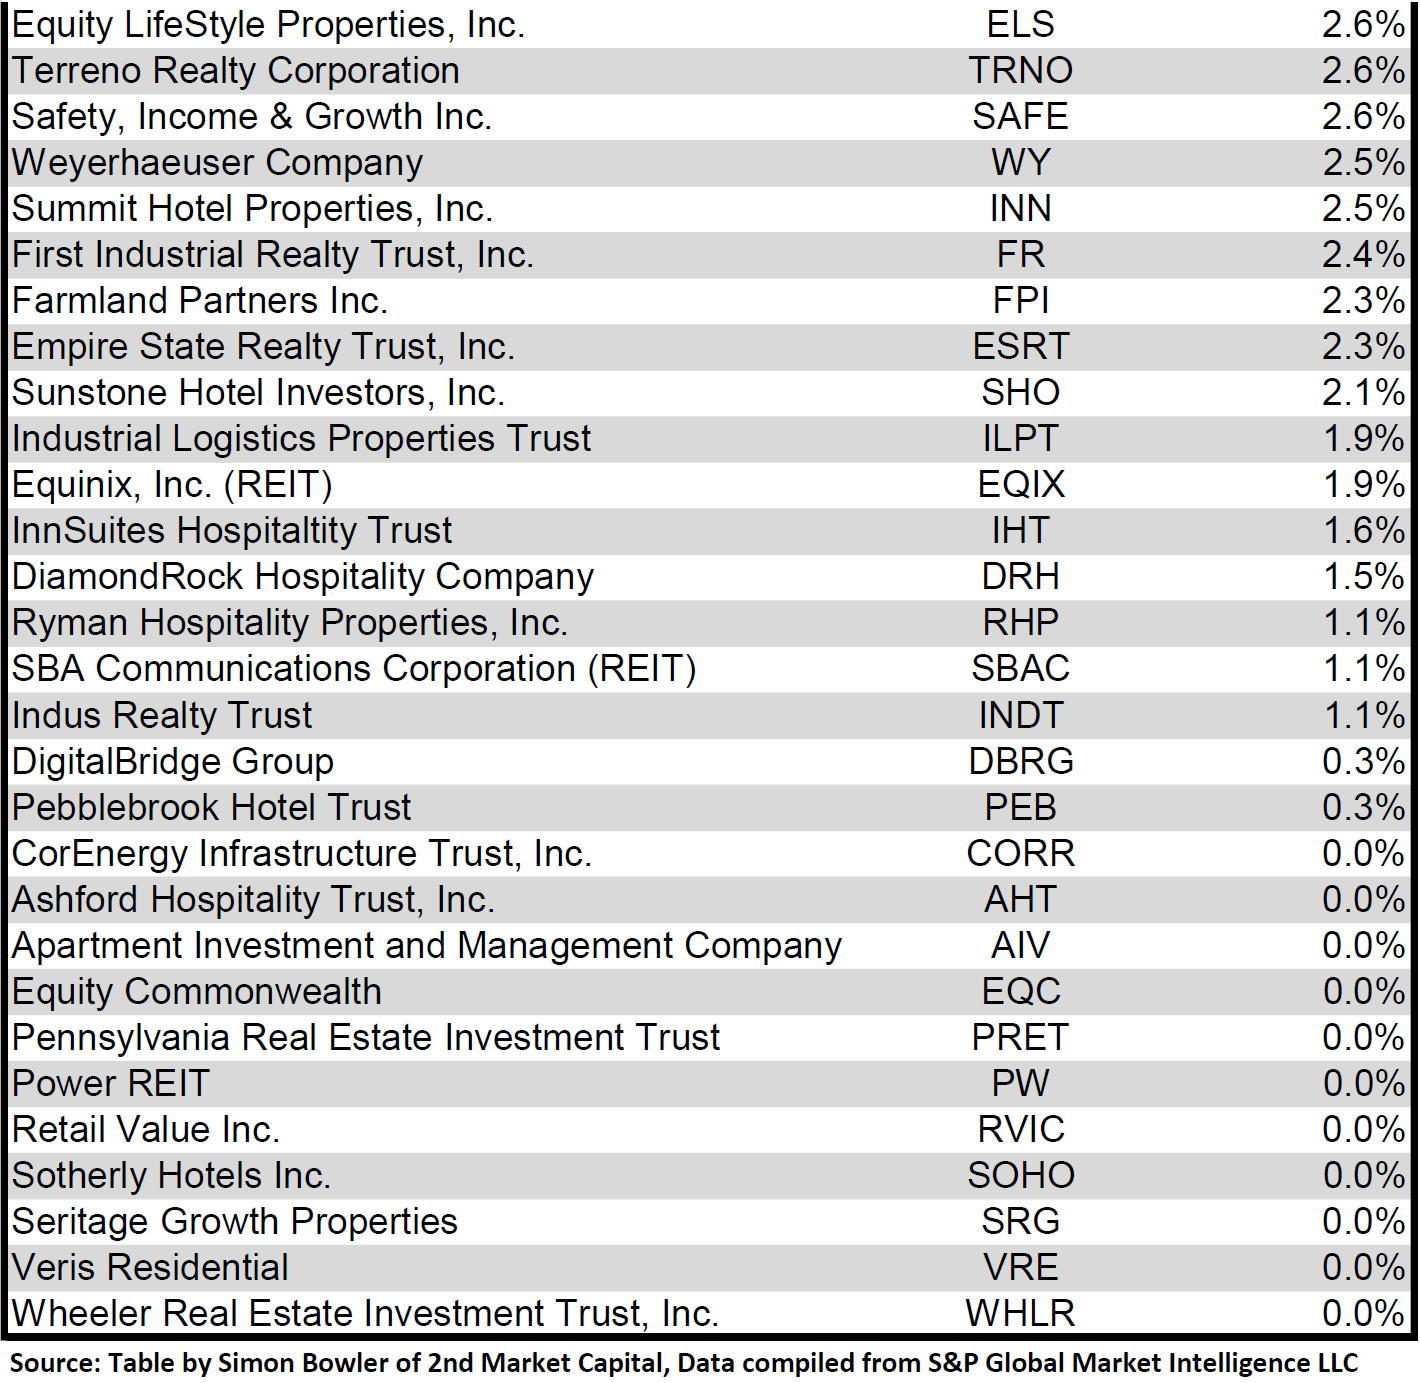
Dividend yield is an important component of a REIT's total return. The particularly high dividend yields of the REIT sector are, for many investors, the primary reason for investment in this sector. As many REITs are currently trading at share prices well below their NAV, yields are currently quite high for many REITs within the sector. Although a particularly high yield for a REIT may sometimes reflect a disproportionately high risk, there exist opportunities in some cases to capitalize on dividend yields that are sufficiently attractive to justify the underlying risks of the investment. I have included below a table ranking equity REITs from highest dividend yield (as of 04/30/2023) to lowest dividend yield.
Source: Table by Simon Bowler of 2nd Market Capital, Data compiled from S&P Global Market Intelligence LLC. See important notes and disclosures at the end of this article Source: Table by Simon Bowler of 2nd Market Capital, Data compiled from S&P Global Market Intelligence LLC. See important notes and disclosures at the end of this article Source: Table by Simon Bowler of 2nd Market Capital, Data compiled from S&P Global Market Intelligence LLC. See important notes and disclosures at the end of this article Source: Table by Simon Bowler of 2nd Market Capital, Data compiled from S&P Global Market Intelligence LLC. See important notes and disclosures at the end of this article
For the convenience of reading this table in a larger font, the table above is available as a PDF as well .
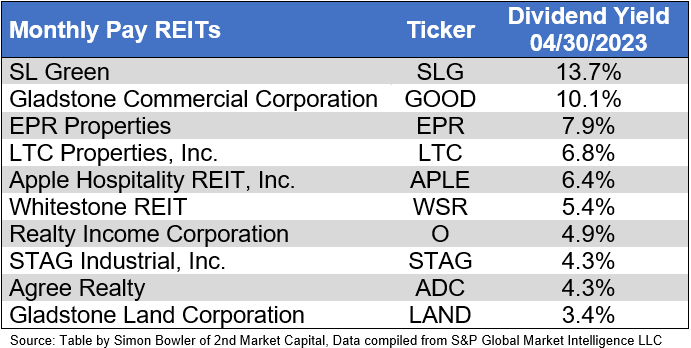
Although a REIT’s decision regarding whether to pay a quarterly dividend or a monthly dividend does not reflect on the quality of the company’s fundamentals or operations, a monthly dividend allows for a smoother cash flow to the investor. Below is a list of equity REITs that pay monthly dividends ranked from highest yield to lowest yield.
Source: Table by Simon Bowler of 2nd Market Capital, Data compiled from S&P Global Market Intelligence LLC. See important notes and disclosures at the end of this article
Valuation
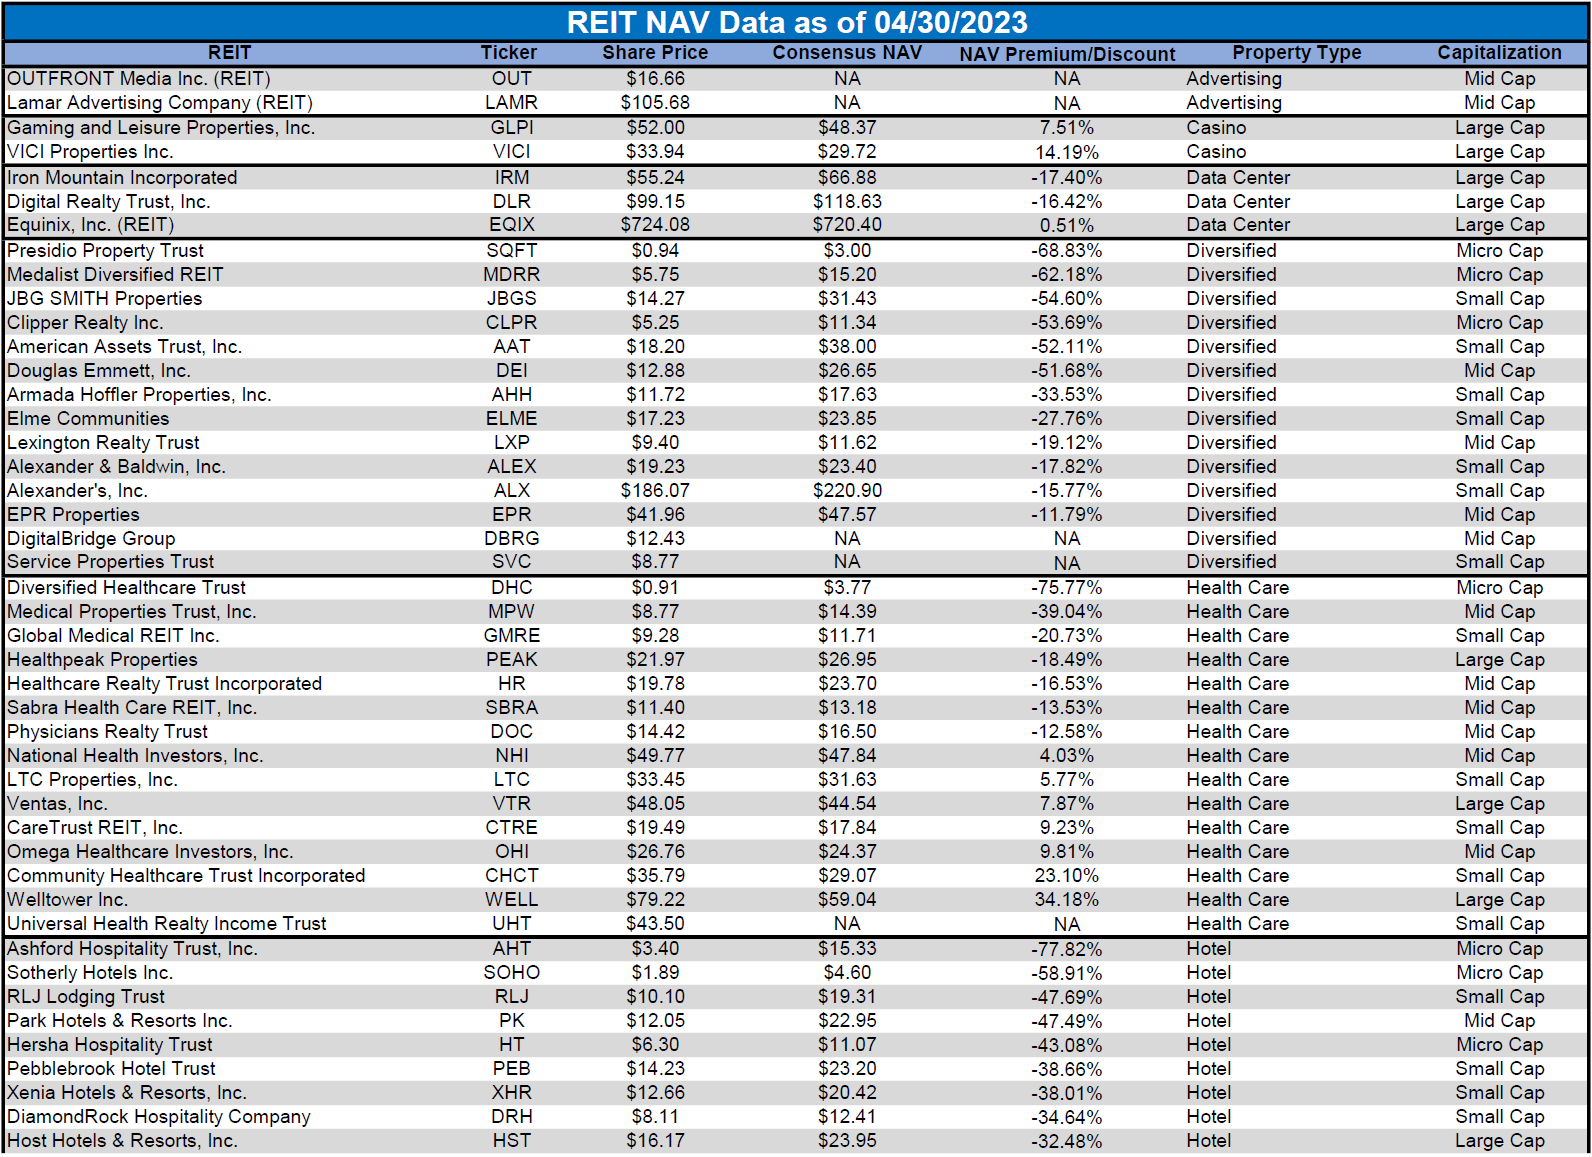
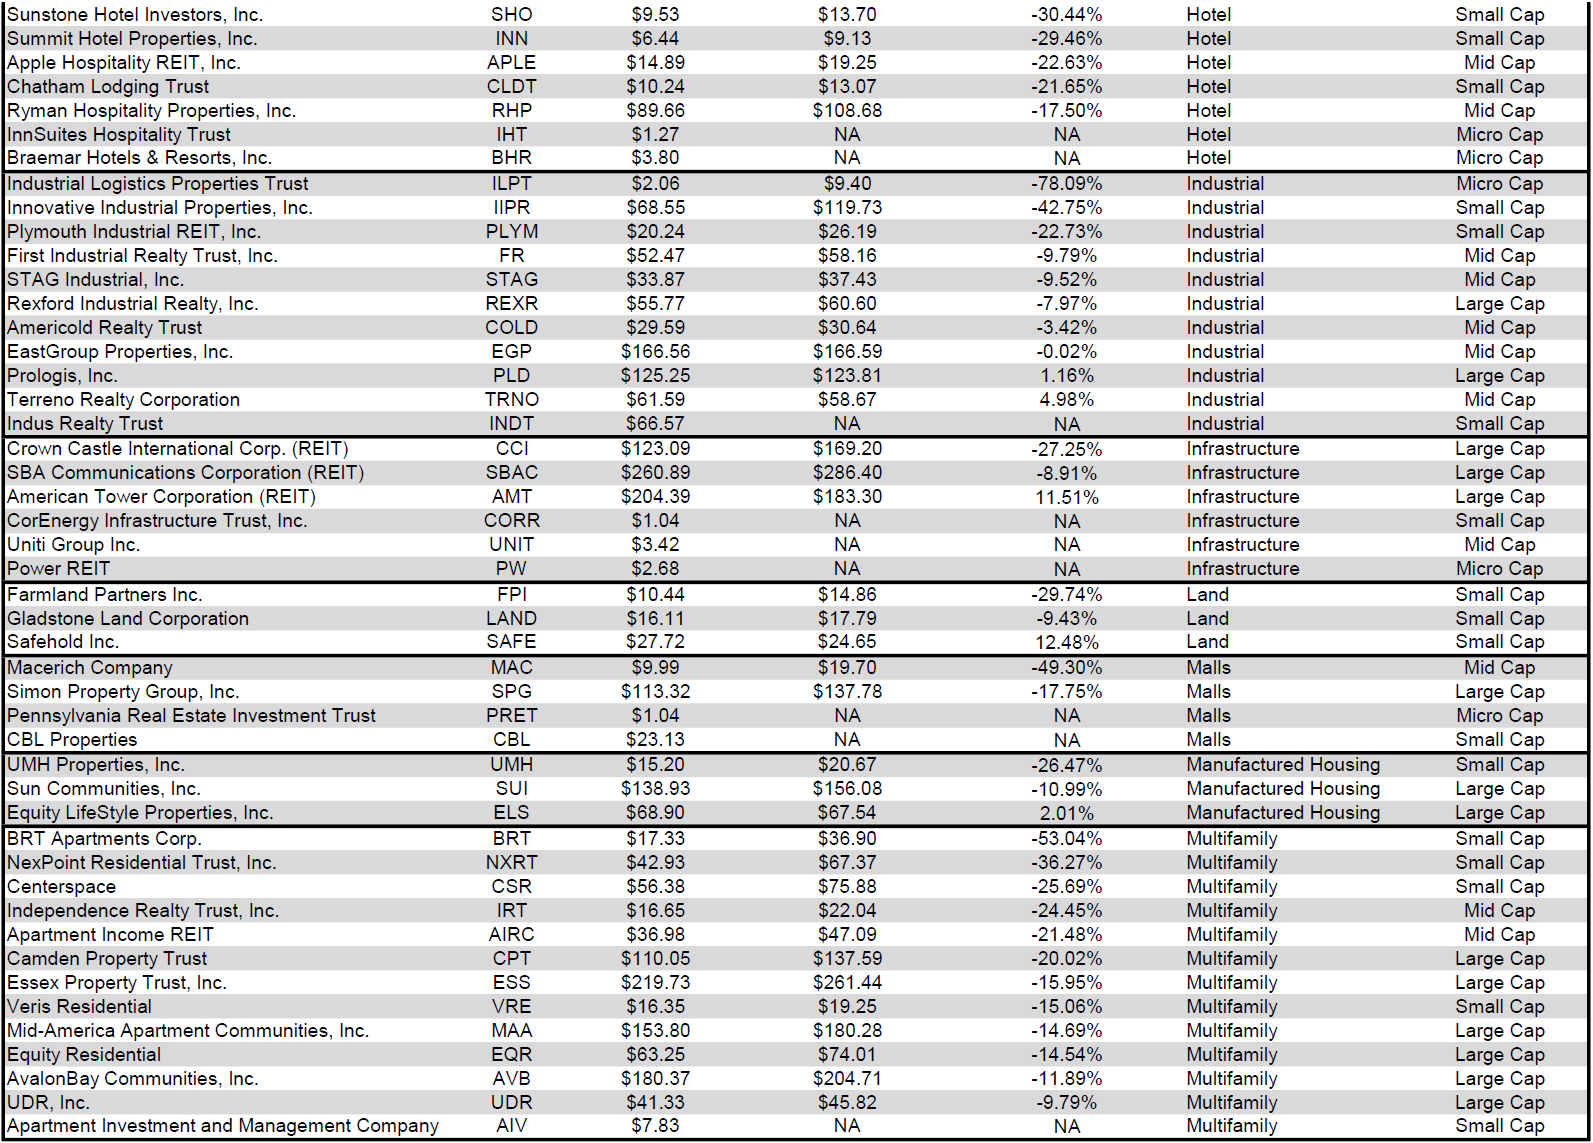
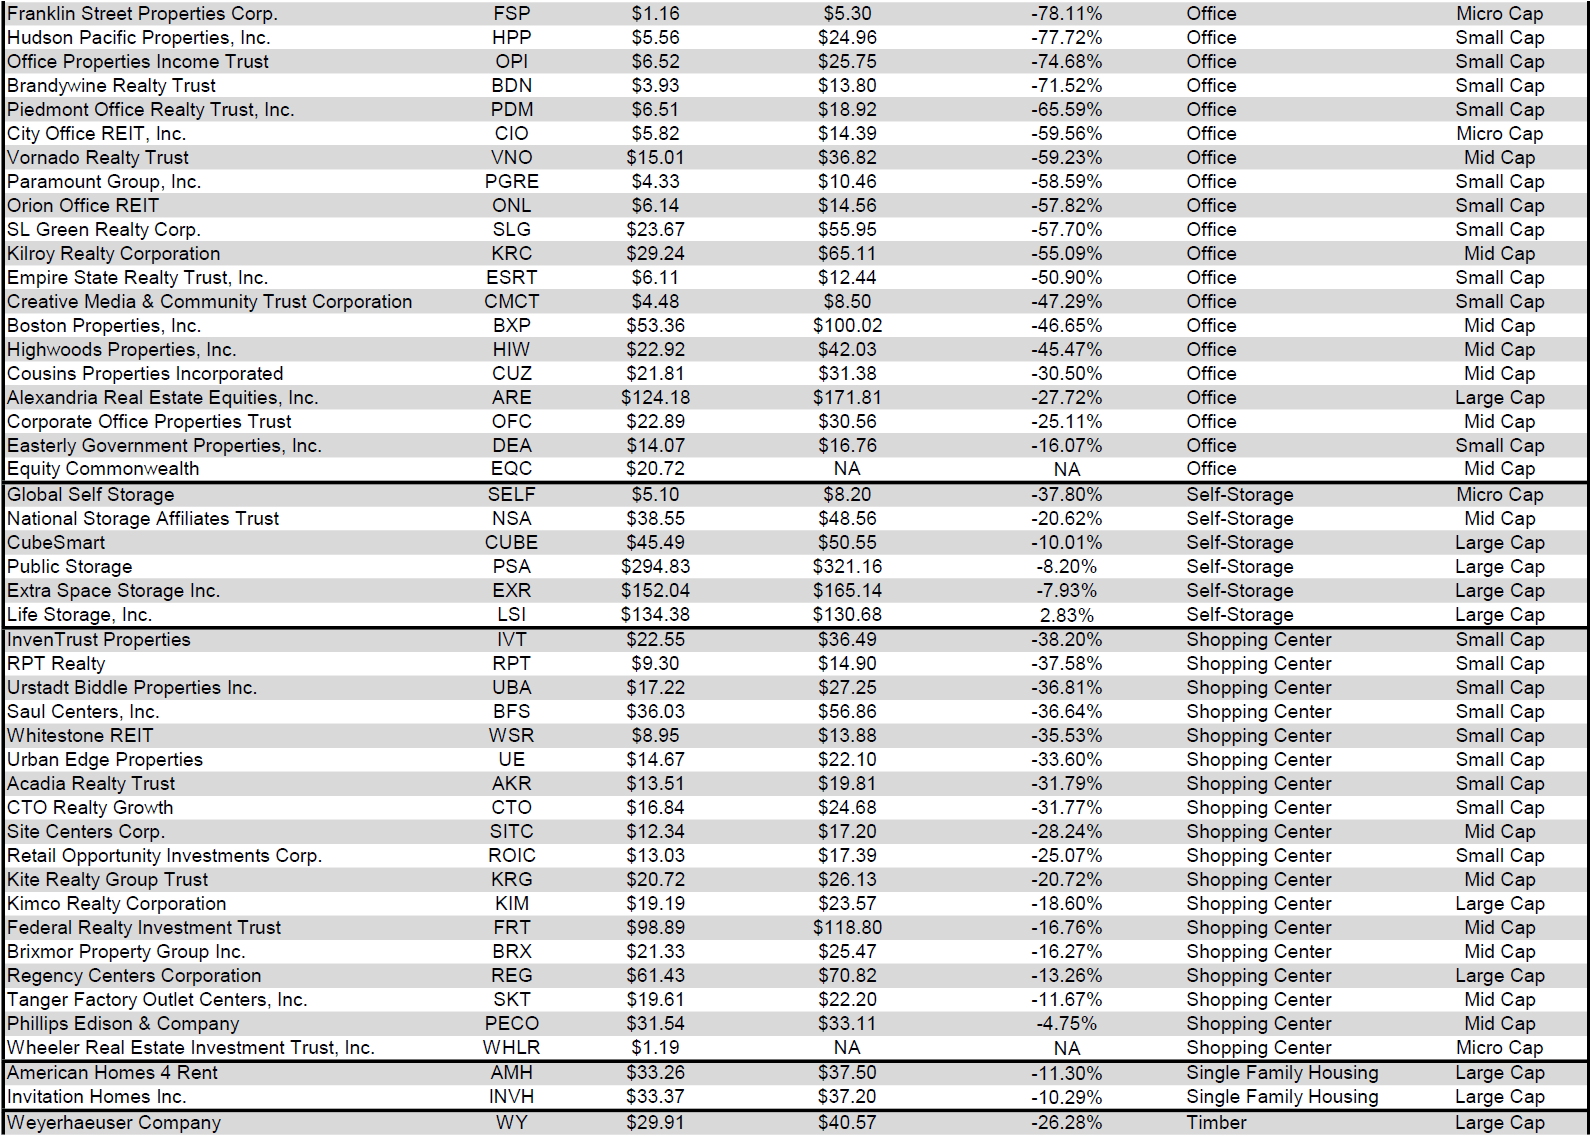
REIT Premium/Discount to NAV by Property Type
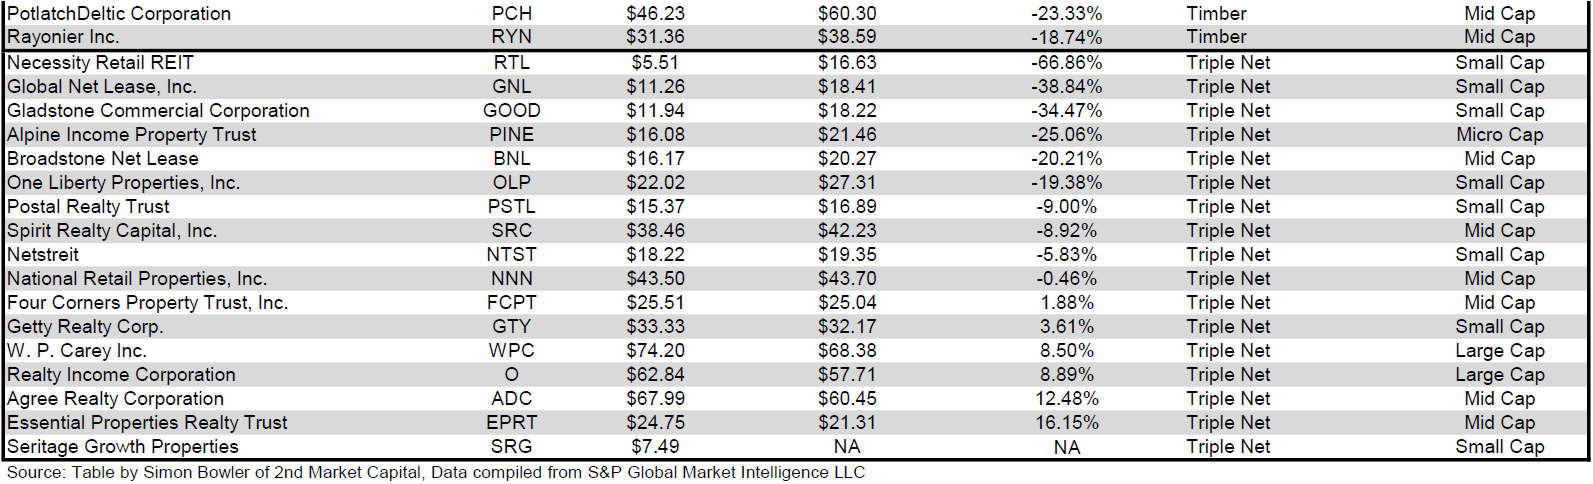
Below is a downloadable data table, which ranks REITs within each property type from the largest discount to the largest premium to NAV. The consensus NAV used for this table is the average of analyst NAV estimates for each REIT. Both the NAV and the share price will change over time, so I will continue to include this table in upcoming issues of The State of REITs with updated consensus NAV estimates for each REIT for which such an estimate is available.
Source: Table by Simon Bowler of 2nd Market Capital, Data compiled from S&P Global Market Intelligence LLC. See important notes and disclosures at the end of this article Source: Table by Simon Bowler of 2nd Market Capital, Data compiled from S&P Global Market Intelligence LLC. See important notes and disclosures at the end of this article Source: Table by Simon Bowler of 2nd Market Capital, Data compiled from S&P Global Market Intelligence LLC. See important notes and disclosures at the end of this article Source: Table by Simon Bowler of 2nd Market Capital, Data compiled from S&P Global Market Intelligence LLC. See important notes and disclosures at the end of this article
For the convenience of reading this table in a larger font, the table above is available as a PDF as well .
Takeaway
The large cap REIT premium (relative to small cap REITs) widened in April and investors are now paying on average about 45% more for each dollar of 2023 FFO/share to buy large cap REITs than small cap REITs (17.3x/11.9x - 1 = 45.4%). As can be seen in the table below, there is presently a strong positive correlation between market cap and FFO multiple.
Source: Table by Simon Bowler of 2nd Market Capital, Data compiled from S&P Global Market Intelligence LLC. See important notes and disclosures at the end of this article
The table below shows the average premium/discount of REITs of each market cap bucket. This data, much like the data for price/FFO, shows a strong, positive correlation between market cap and Price/NAV. The average large cap REIT (-7.97%) trades at a single digit discount to NAV, while mid cap REITs (-18.86%) trade at a double-digit discount to NAV. Small cap REITs (-32.34%) trade at a little over 2/3 of NAV. Micro caps on average trade at just over 40% of their respective NAVs (-58.94%).
Source: Table by Simon Bowler of 2nd Market Capital, Data compiled from S&P Global Market Intelligence LLC. See important notes and disclosures at the end of this article
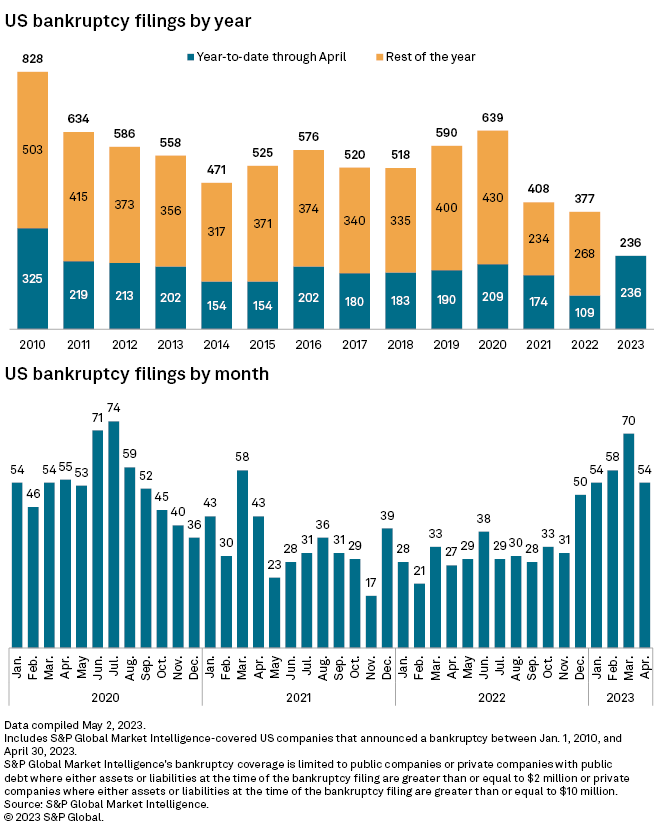
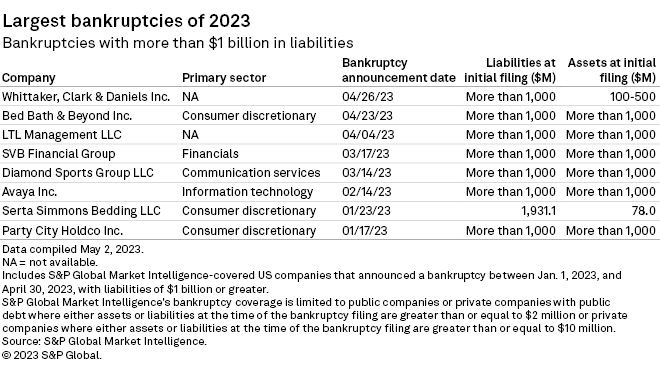
The number of bankruptcy filings declined month over month in April but remains at an elevated level. In the first four months of 2023 there have been more filings than in the first third of any year since 2010 and more than twice as many as there were over the same period last year. Rising interest rates and declining economic fundamentals are likely to continue to fuel bankruptcies throughout the remainder of 2023.
Below is list of the largest bankruptcy filings thus far this year. This pain is being felt by companies across multiple sectors.
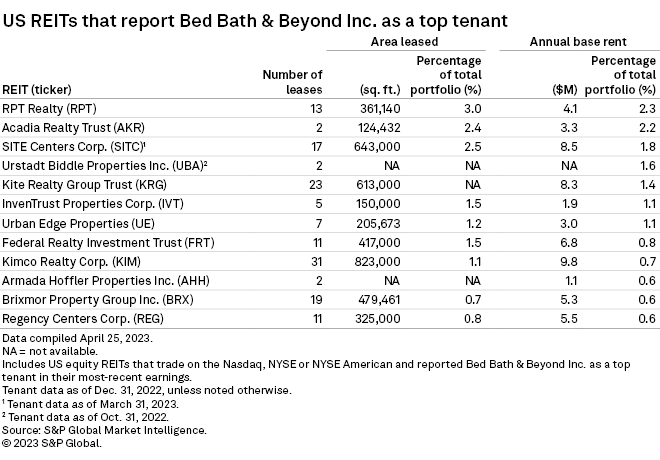
Whenever a retail bankruptcy or store closure is announced, it is always important to identify whether that retailer is the tenant of any REITs and the potential magnitude of impact that could be felt by those REITs. Bankruptcies often result in store closures, which causes a decrease to the REIT landlord’s rent collection and an increase in vacancy. Bed Bath & Beyond ( BBBYQ ) is the largest retailer to file bankruptcy thus far in 2023 and is reported as a top tenant of 12 REITs.
Kimco Realty ( KIM ) has the most total square footage leased to Bed Bath & Beyond, comprised of 823,000 square feet across 31 leases for a total annual base rent of $9.8M or 0.7% of total portfolio rent. RPT Realty ( RPT ), however, has the largest portion of their portfolio (3.0%) currently leased to Bed Bath & Beyond as well as the largest portion of total portfolio annual base rent (2.3%). Whereas Armada Hoffler Properties ( AHH ), Brixmor Property Group ( BRX ) and Regency Centers ( REG ) have only 0.6% of their annual base rent tied to Bed Bath and Beyond. REIT investors would be wise to review the top tenants of all REITs in which they already own shares or are considering making an investment. REITs with strong tenants have the potential to significantly outperform those with weaker tenants. This fundamental outperformance could translate to meaningful alpha for discerning investors over upcoming years.
For further details see:
The State Of REITs: May 2023 Edition