JPRE - The State Of REITs: November 2023 Edition
2023-11-28 15:49:27 ET
Summary
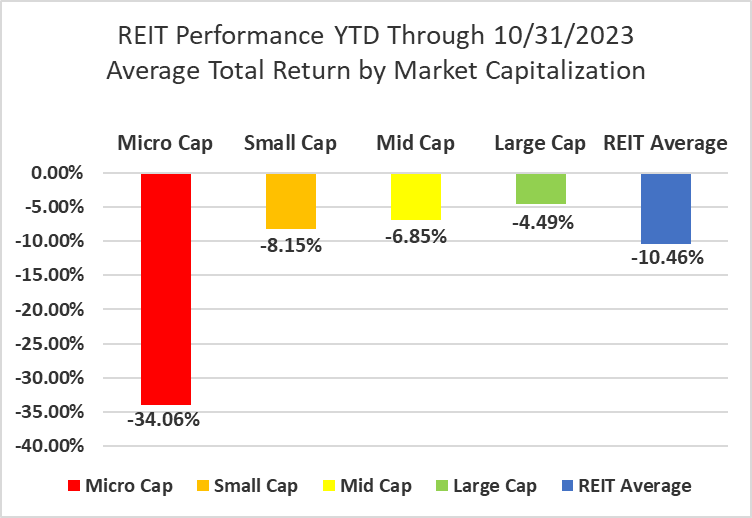
- REITs averaged a -5.31% total return in October and have now fallen to a double-digit negative total return year to date (-10.46%).
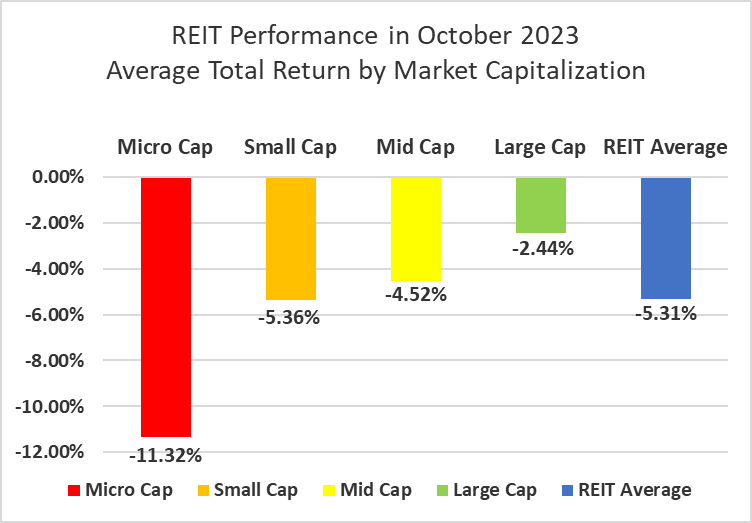
- Large cap REITs (-2.24%) outperformed their smaller peers in October. Micro caps (-11.32%) extended their streak of severe underperformance.
- 26.80% of REIT securities had a positive total return in October with just 25.00% in the black year to date.
- Data Centers (+0.86%) were the only REIT property type to average a positive total return in October. Self-Storage (-10.27%) and Multifamily(-9.52%) REITs underperformed all other property types.
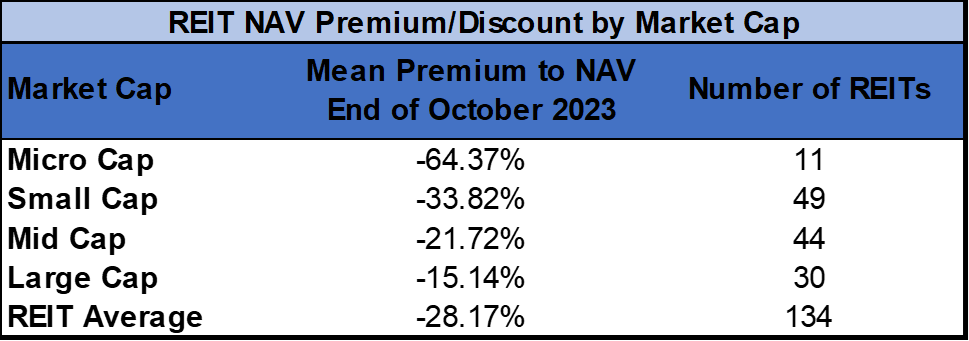
- The average REIT NAV discount widened from -27.80%to -28.17% during October. The median NAV discount widened from -25.00% to-27.94%.
REIT Performance
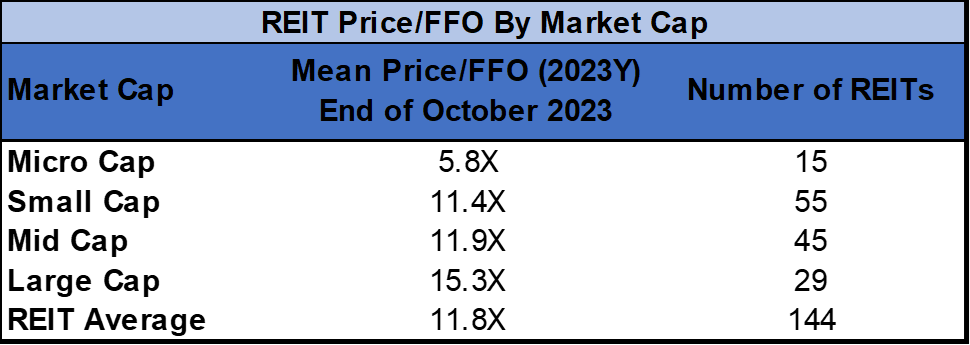
In October REITs had their 3rd straight month of averaging a negative total return (-2.44%). The average REIT total return in October was worse than that of the Dow Jones Industrial Average (-1.3%) and S&P 500 (-2.1%), but wasn't as bad as the NASDAQ (-2.8%). The market cap-weighted Vanguard Real Estate Index Fund ETF Shares ( VNQ ) saw a smaller decline in October (-3.62% vs. -5.31%) and has outperformed YTD (-8.86% vs. -10.46%). The spread between the 2023 FFO multiples of large cap REITs (15.3x) and small cap REITs (11.4x) widened in October as multiples compressed 0.4 turns for large caps and 0.7 turns for small caps. Investors currently need to pay an average of 34.2% more for each dollar of FFO from large cap REITs relative to small cap REITs. In this monthly publication, I will provide REIT data on numerous metrics to help readers identify which property types and individual securities currently offer the best opportunities to achieve their investment goals.
Source: Graph by Simon Bowler of 2nd Market Capital, Data compiled from S&P Global Market Intelligence LLC. See important notes and disclosures at the end of this article
In October micro-cap REITs (-11.32%) had yet another brutal month of underperformance. Large caps (-2.44%) outperformed their smaller peers as both mid-caps (-4.52%) and small caps (-5.36%) saw lower average negative total returns. Large cap REITs (-4.49%) are outperforming small caps (-8.15%) by 366 basis points on YTD 2023 total return.
Source: Graph by Simon Bowler of 2nd Market Capital, Data compiled from S&P Global Market Intelligence LLC. See important notes and disclosures at the end of this article
1 out of 18 Property Types Yielded Positive Total Returns in October
94.4% percent of REIT property types averaged a negative total return in October with only 5.6% in the black. There was an 11.13% total return spread between the best and worst-performing property types. Data Centers (+0.86%) and Malls (-0.68%) were the REIT property types with the highest average total returns in October.
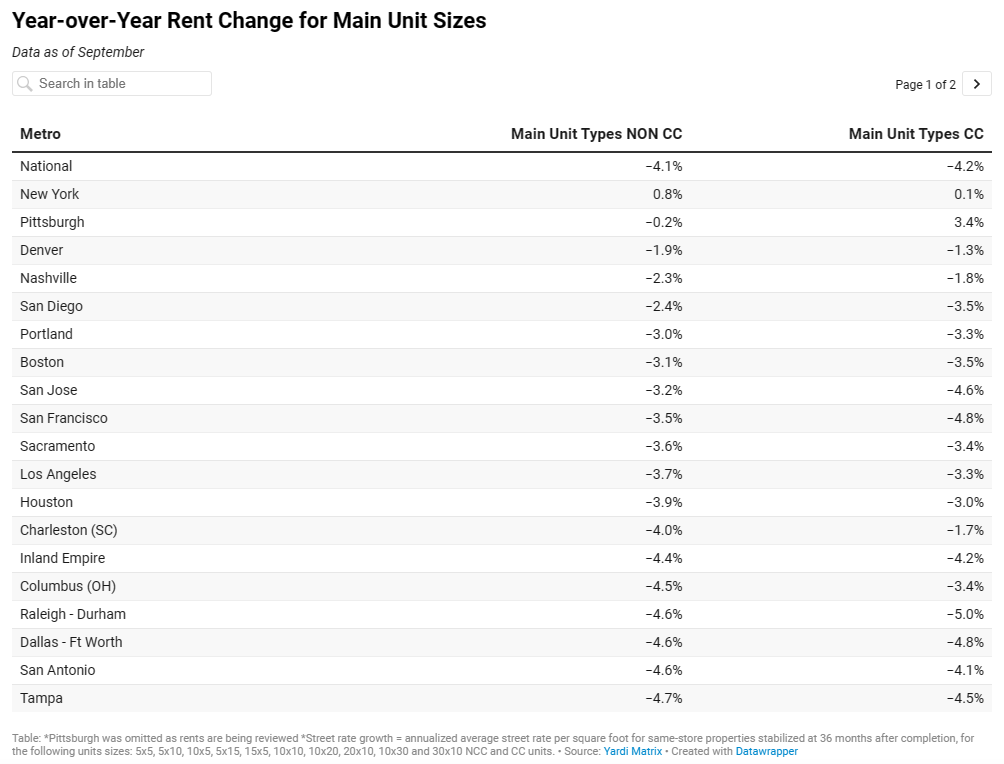
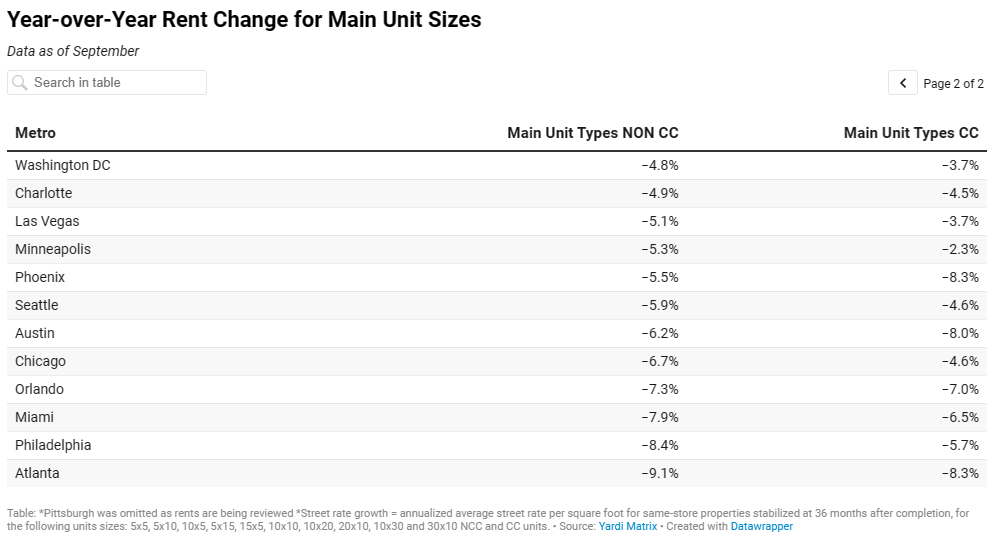
Self-Storage (-10.27%) and Multifamily (-9.52%) had the lowest average total returns in the REIT sector in October. All 5 Self Storage REITs were in the red, led to the downside by Extra Space Storage Inc. ( EXR ) with -14.80% total return. The October Self-Storage selloff was in large part driven by brutal year-over-year rental rate declines in September. Yardi reported -4.1% for non-climate controlled units and -4.2% for climate controlled units. New York City was the only large metro to see year-over-year gains (+0.8%), whereas the negative impact was most severe in Atlanta (-9.1%) and Philadelphia (-8.4%).
Source: Table by Simon Bowler of 2nd Market Capital, Data compiled from S&P Global Market Intelligence LLC. See important notes and disclosures at the end of this article
After another rough month in October, Infrastructure remains the worst performing REIT property type year to date (-37.82%). Land (-26.80%), Office (-25.02%), Advertising (-23.23%) and Malls (-21.09%) have also averaged negative total returns more than double that of the REIT sector as a whole thus far in 2023. The number of REIT property types in the black year to date decreased from 5 to 3 in October. Data Centers (+21.18%), Healthcare (+10.49%) and Single Family Housing (+6.63%) are the top performing property types year to date.
Source: Table by Simon Bowler of 2nd Market Capital, Data compiled from S&P Global Market Intelligence LLC. See important notes and disclosures at the end of this article
The REIT sector as a whole saw the average P/FFO (2023Y) decrease 0.5 turns in October from 12.3x down to 11.8x. The average REIT saw multiple contractions in 76.5% of property types, expansion in 11.8% and held steady in 11.8% in October. There are no recent 2023 FFO/share estimates for any of the Timber REITs. Land (36.6x), Data Centers (23.7x), Manufactured Housing (18.4x), Single Family Housing (18.3x) and Industrial (16.6x) currently trade at the highest average multiples among REIT property types. Diversified REITs (9.8x) joined Malls (4.5x), Office (6.6x) and Hotels (7.2x) as one of the 4 REIT property types trading at single-digit multiples.
Source: Table by Simon Bowler of 2nd Market Capital, Data compiled from S&P Global Market Intelligence LLC. See important notes and disclosures at the end of this article
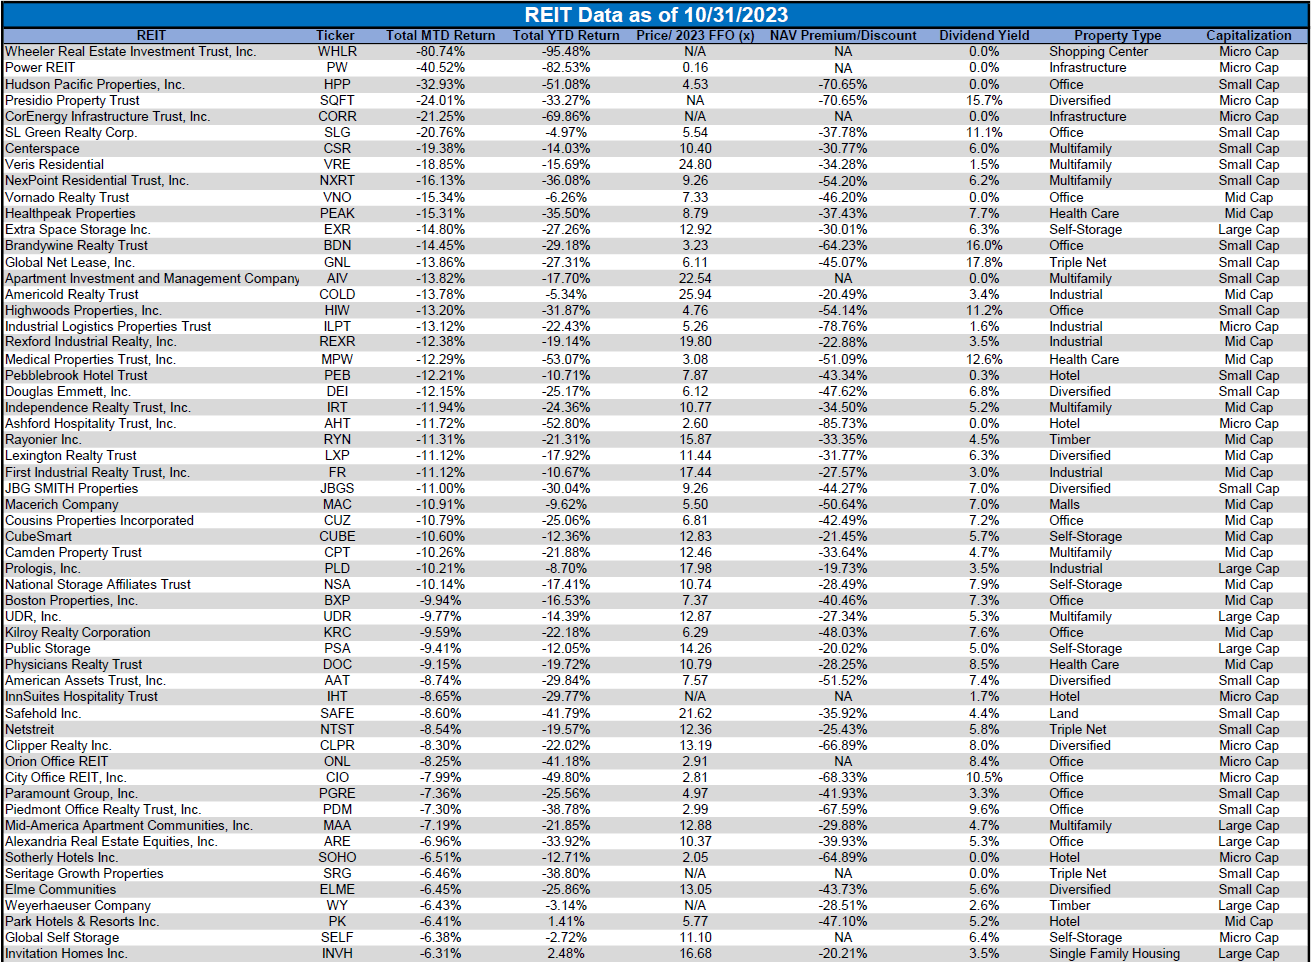
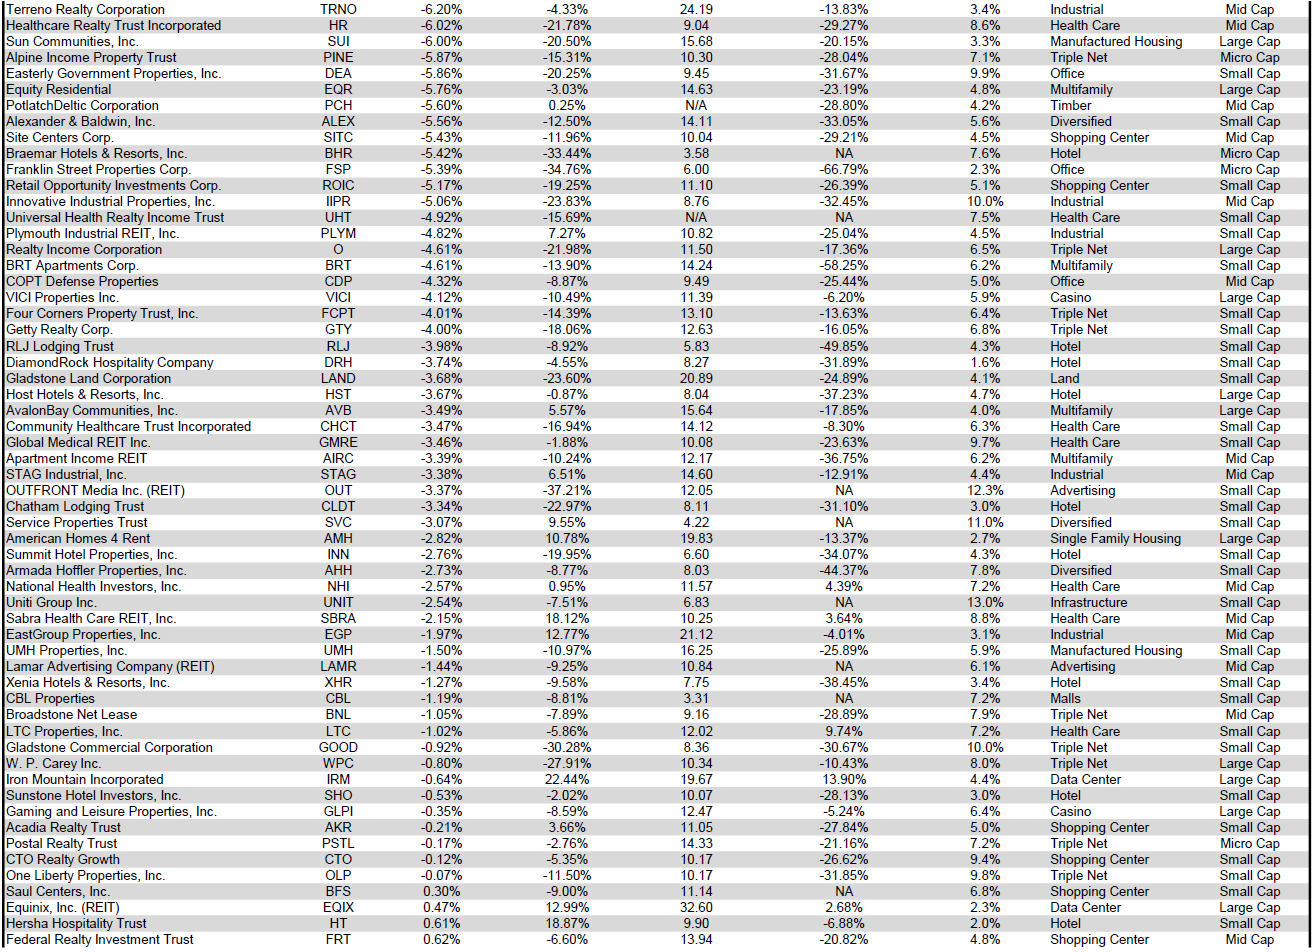
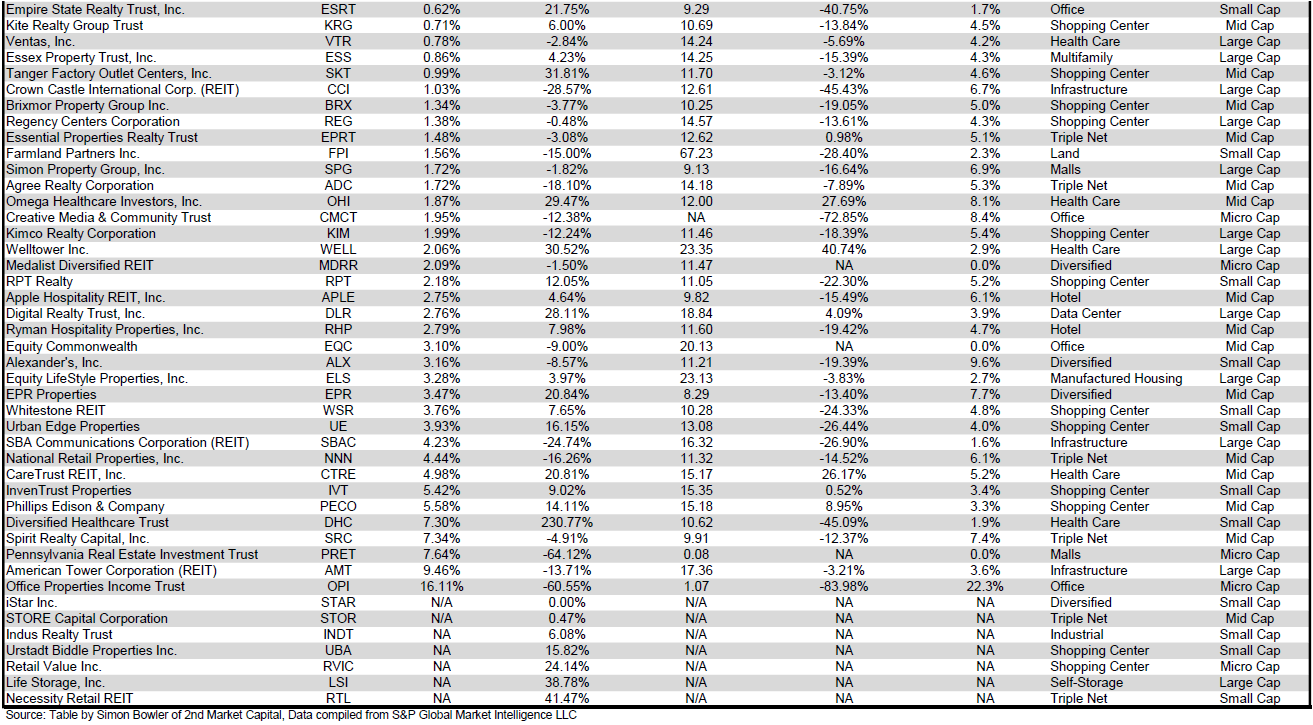
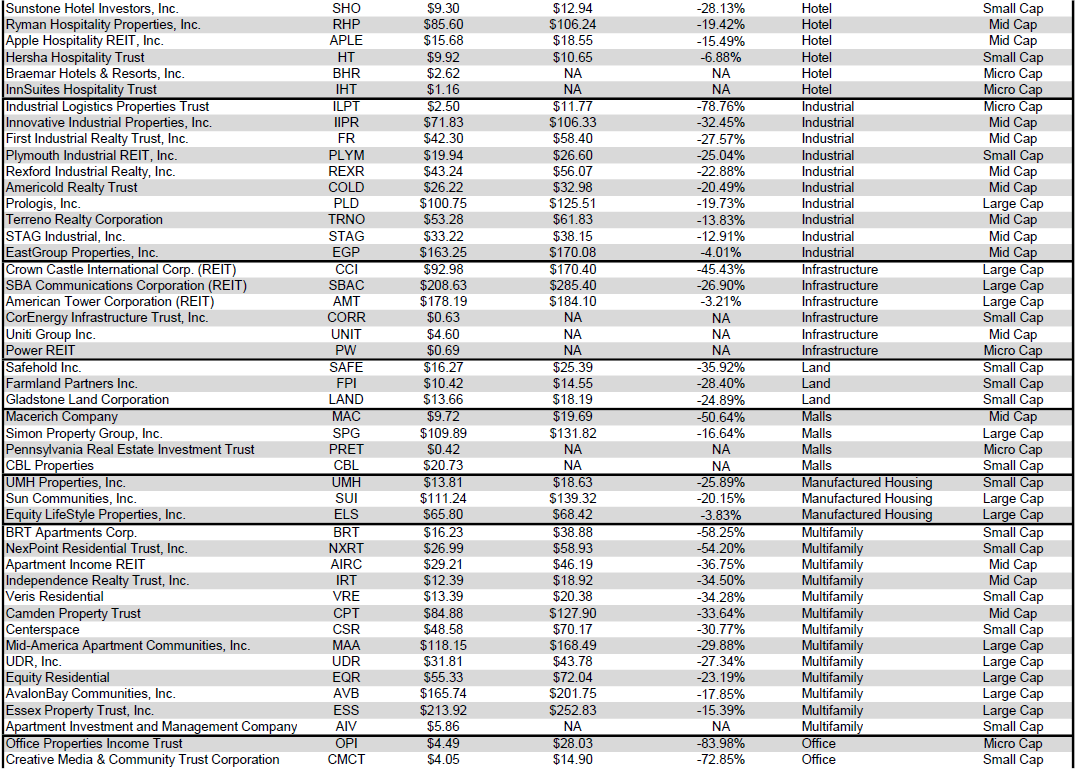
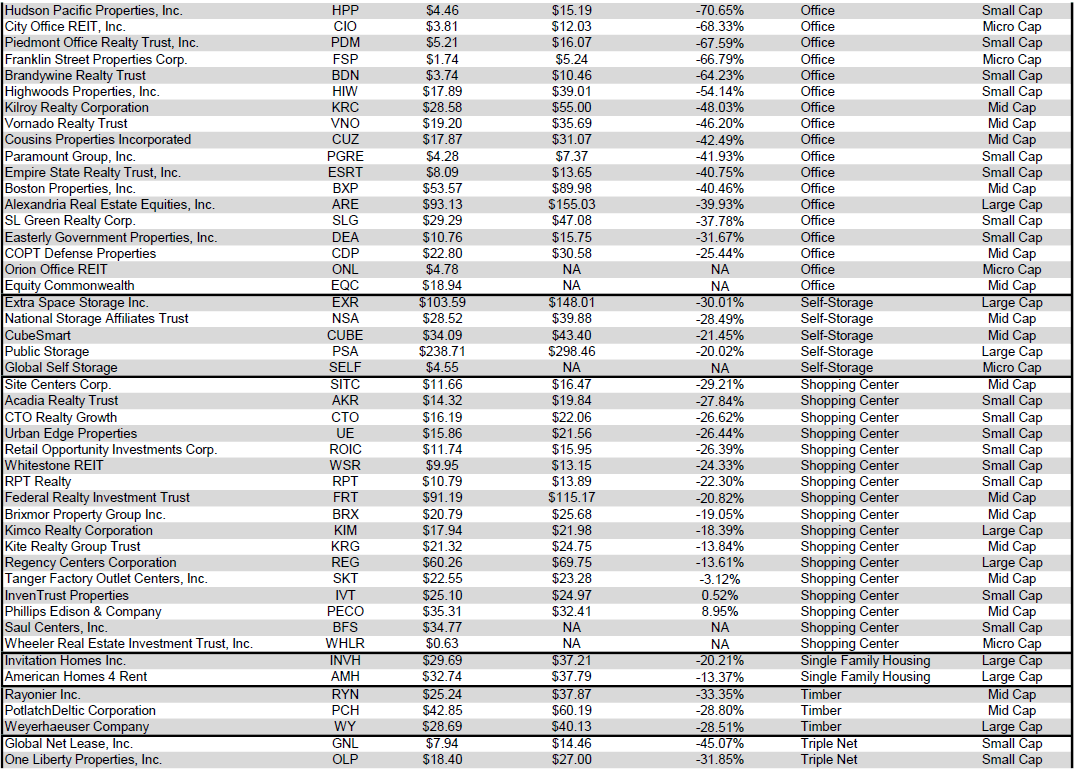
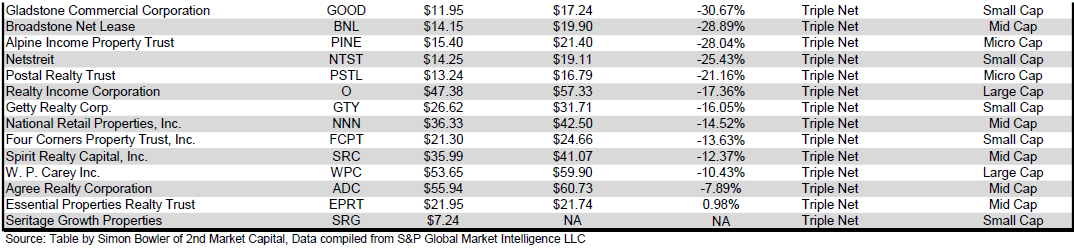
Performance of Individual Securities
Office Properties Income Trust ( OPI ) (+16.11%) was the worst performing REIT in September (-44.59%), but recovered a fraction of September's loss with the highest total return in October. Despite this partial recovery, OPI remains among the 5 worst performing REITs of 2023 along with Wheeler Real Estate Investment Trust, Inc. ( WHLR ) (-95.48%), Power REIT ( PW ) (-82.53%), CorEnergy Infrastructure Trust, Inc. ( CORR ) (-69.86%) and Pennsylvania Real Estate Investment Trust ( PRET ) (-64.12%).
Wheeler Real Estate Investment Trust, Inc. ((WHLR)) (-80.74%) saw its multi-year free fall dramatically accelerate in October due to the staggering amount of common share dilution caused by redemptions of the series D preferred stock paid out through the issuance of common shares. This dilution has fueled a tragic -95.48% YTD total return.
26.80% of REITs had a positive total return in October with only 25.00% in the black year to date. During the first 10 months of last year the average REIT had a painful -20.99% return. During the first 10 months of this year the average REIT has endured somewhat smaller losses with a -10.46% average total return.
Source: Table by Simon Bowler of 2nd Market Capital, Data compiled from S&P Global Market Intelligence LLC. See important notes and disclosures at the end of this article Source: Table by Simon Bowler of 2nd Market Capital, Data compiled from S&P Global Market Intelligence LLC. See important notes and disclosures at the end of this article Source: Table by Simon Bowler of 2nd Market Capital, Data compiled from S&P Global Market Intelligence LLC. See important notes and disclosures at the end of this article
For the convenience of reading this table in a larger font, the table above is available as a PDF as well .
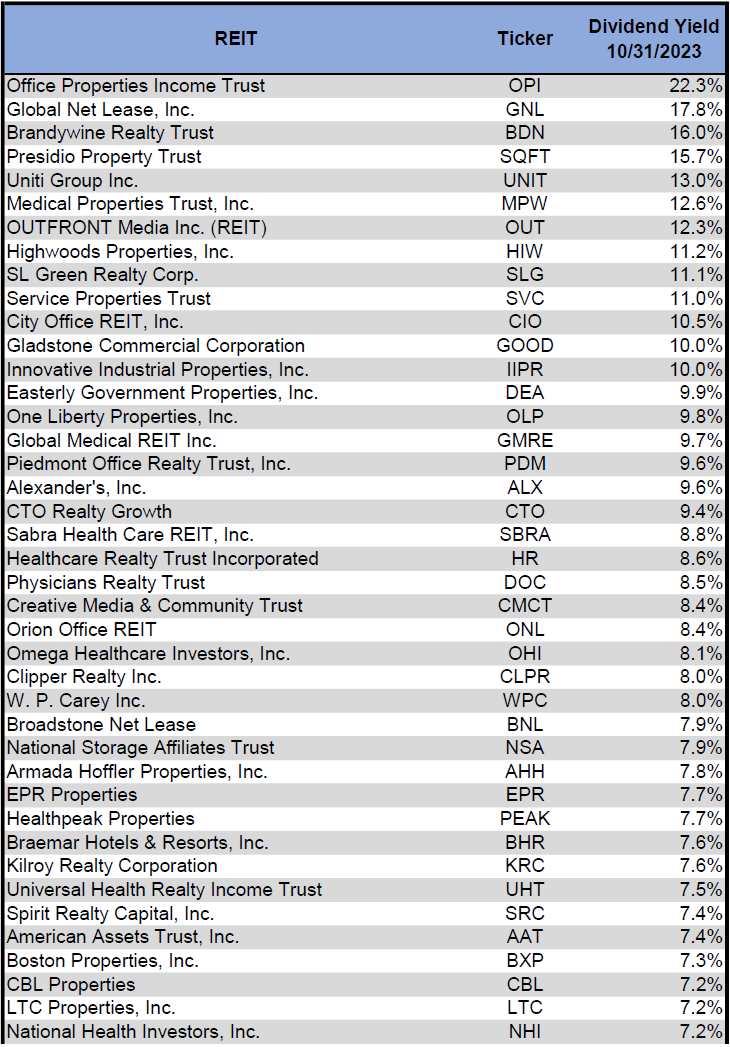
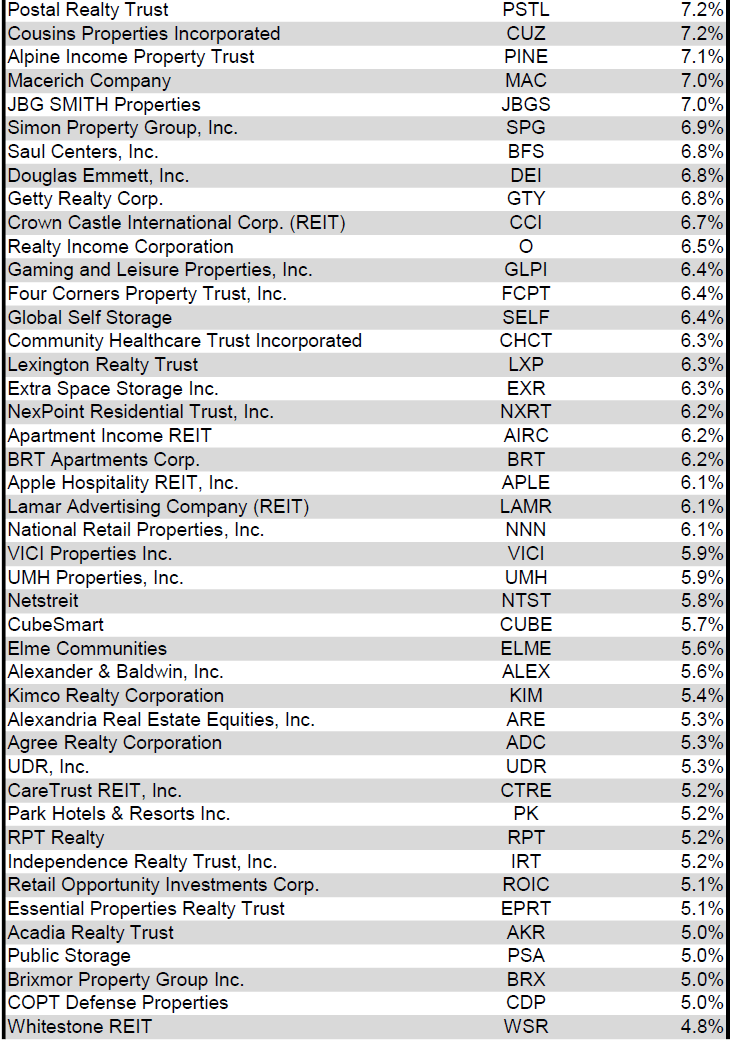
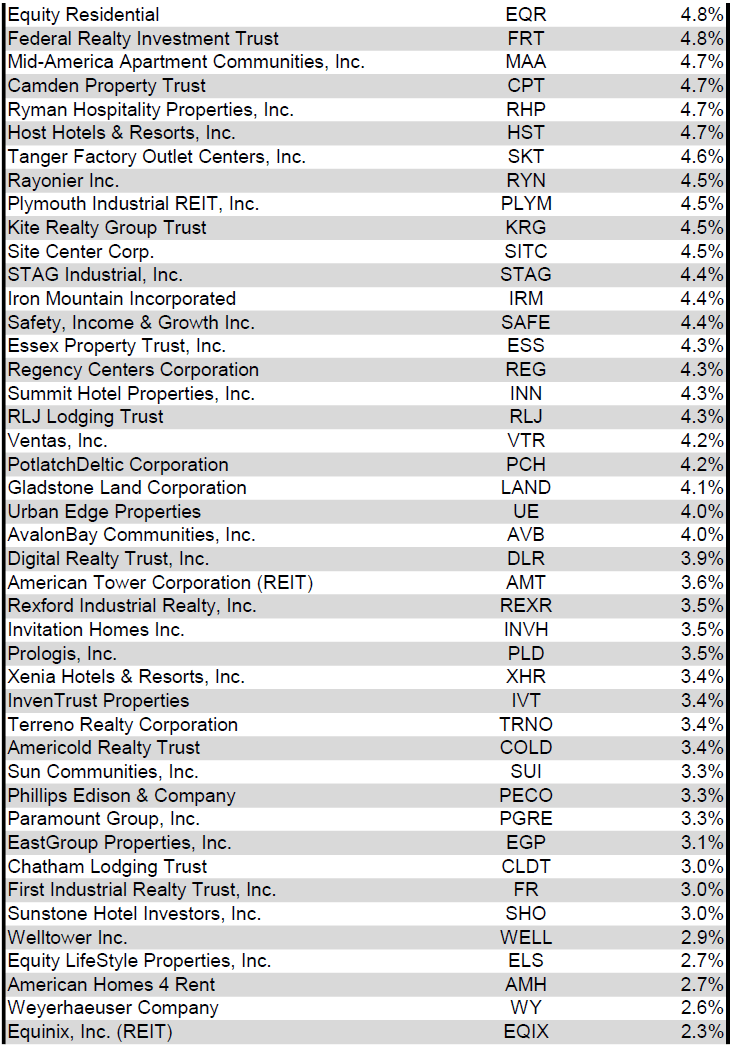
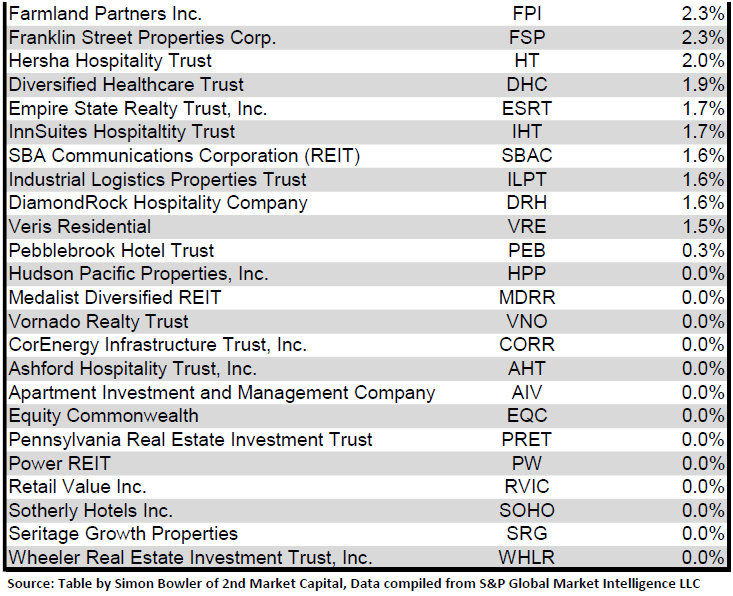
Dividend Yield
Dividend yield is an important component of a REIT's total return. The particularly high dividend yields of the REIT sector are, for many investors, the primary reason for investment in this sector. As many REITs are currently trading at share prices well below their NAV, yields are currently quite high for many REITs within the sector. Although a particularly high yield for a REIT may sometimes reflect a disproportionately high risk, there exist opportunities in some cases to capitalize on dividend yields that are sufficiently attractive to justify the underlying risks of the investment. I have included below a table ranking equity REITs from highest dividend yield (as of 10/31/2023) to lowest dividend yield.
Source: Table by Simon Bowler of 2nd Market Capital, Data compiled from S&P Global Market Intelligence LLC. See important notes and disclosures at the end of this article Source: Table by Simon Bowler of 2nd Market Capital, Data compiled from S&P Global Market Intelligence LLC. See important notes and disclosures at the end of this article Source: Table by Simon Bowler of 2nd Market Capital, Data compiled from S&P Global Market Intelligence LLC. See important notes and disclosures at the end of this article Source: Table by Simon Bowler of 2nd Market Capital, Data compiled from S&P Global Market Intelligence LLC. See important notes and disclosures at the end of this article
For the convenience of reading this table in a larger font, the table above is available as a PDF as well .
Although a REIT's decision regarding whether to pay a quarterly dividend or a monthly dividend does not reflect on the quality of the company's fundamentals or operations, a monthly dividend allows for a smoother cash flow to the investor. Below is a list of equity REITs that pay monthly dividends ranked from highest yield to lowest yield.
Source: Table by Simon Bowler of 2nd Market Capital, Data compiled from S&P Global Market Intelligence LLC. See important notes and disclosures at the end of this article
Valuation
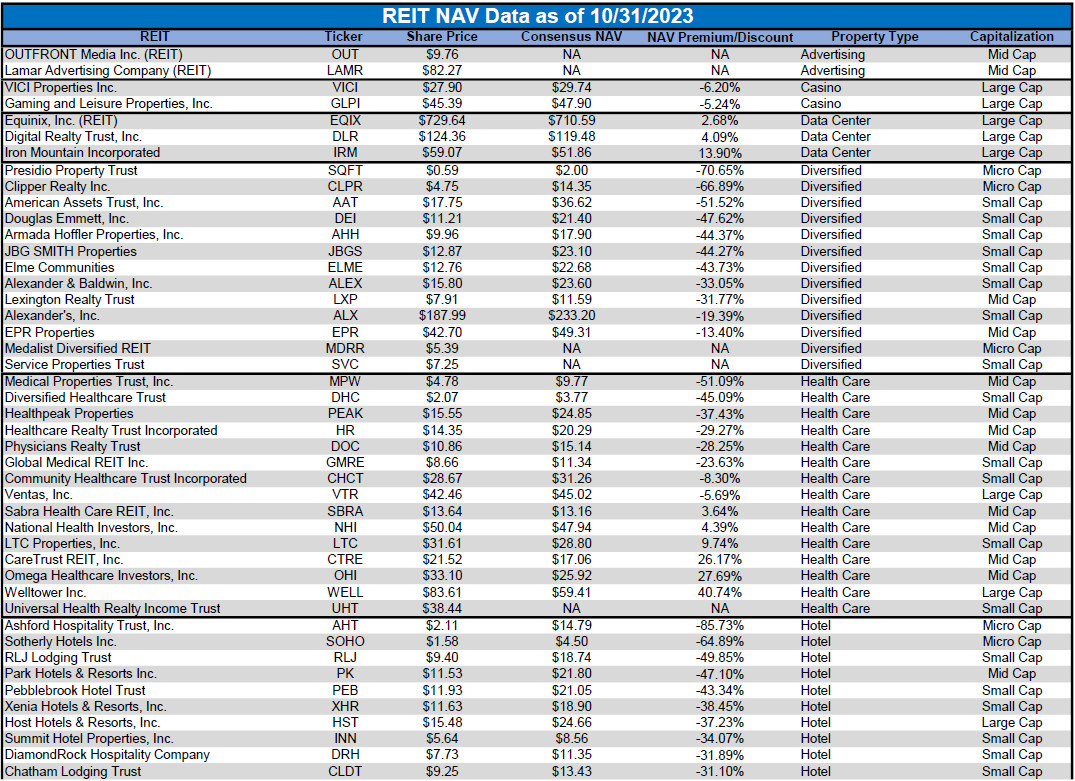
REIT Premium/Discount to NAV by Property Type
Below is a downloadable data table, which ranks REITs within each property type from the largest discount to the largest premium to NAV. The consensus NAV used for this table is the average of analyst NAV estimates for each REIT. Both the NAV and the share price will change over time, so I will continue to include this table in upcoming issues of The State of REITs with updated consensus NAV estimates for each REIT for which such an estimate is available.
Source: Table by Simon Bowler of 2nd Market Capital, Data compiled from S&P Global Market Intelligence LLC. See important notes and disclosures at the end of this article Source: Table by Simon Bowler of 2nd Market Capital, Data compiled from S&P Global Market Intelligence LLC. See important notes and disclosures at the end of this article Source: Table by Simon Bowler of 2nd Market Capital, Data compiled from S&P Global Market Intelligence LLC. See important notes and disclosures at the end of this article Source: Table by Simon Bowler of 2nd Market Capital, Data compiled from S&P Global Market Intelligence LLC. See important notes and disclosures at the end of this article
For the convenience of reading this table in a larger font, the table above is available as a PDF as well .
Takeaway
The large cap REIT premium (relative to small cap REITs) widened in October and investors are now paying on average about 34% more for each dollar of 2023 FFO/share to buy large cap REITs than small cap REITs (15.3x/11.4x - 1 = 34.2%). As can be seen in the table below, there is presently a strong positive correlation between market cap and FFO multiple.
Source: Table by Simon Bowler of 2nd Market Capital, Data compiled from S&P Global Market Intelligence LLC. See important notes and disclosures at the end of this article
The table below shows the average NAV premium/discount of REITs of each market cap bucket. This data, much like the data for price/FFO, shows a strong, positive correlation between market cap and Price/NAV. The average large cap REIT (-15.14%) trades at a mid-teens discount to NAV. Mid cap REITs (-21.72%) trade at a little more than 3/4 of NAV, while small cap REITs (-33.82%) trade at around 2/3 of NAV. Micro caps on average trade at just over 1/3 of their respective NAVs (-64.37%).
Source: Table by Simon Bowler of 2nd Market Capital, Data compiled from S&P Global Market Intelligence LLC. See important notes and disclosures at the end of this article
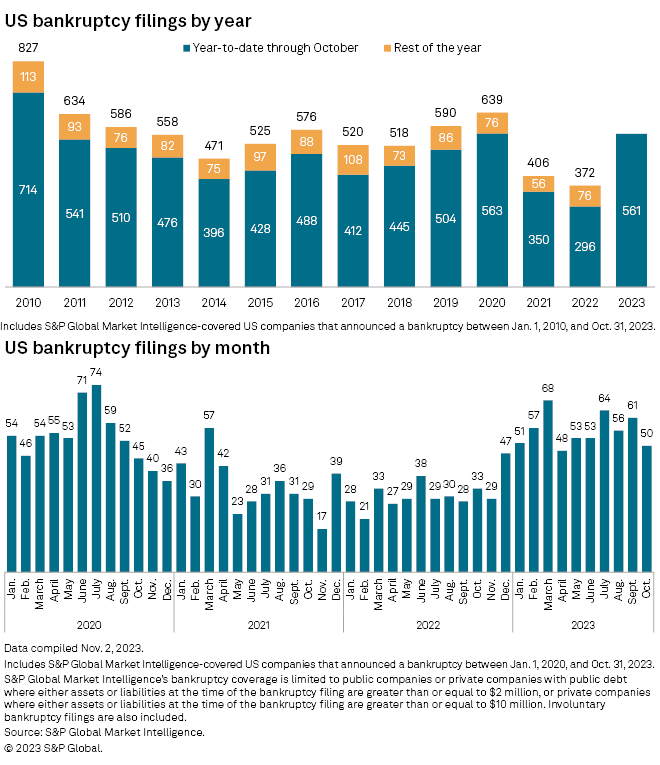
Bankruptcy filings in October decreased month over month, but remained elevated for the 11th straight month. After the first 10 months of the year, 2023 is on pace for as many bankruptcies as 2020 and has already surged past the full-year bankruptcy totals for 2021 and 2022. Although the Fed has paused after a long series of rate hikes, it is not clear how soon the Fed will actually pivot to rate cuts given that inflation remains stubbornly over the Fed's 2% target. With interest rates remaining at an elevated level, efforts to refinance maturing loans or to secure new loans may prove to be very challenging for companies with poor balance sheets.
Although REIT balance sheets are mostly strong, there is still the risk of negative impact from tenant bankruptcies and store closures. Whenever store closures or bankruptcy are announced, it is important to identify which REITs are impacted. This allows investors to discern whether future earnings will be impacted and if so, to what extent.
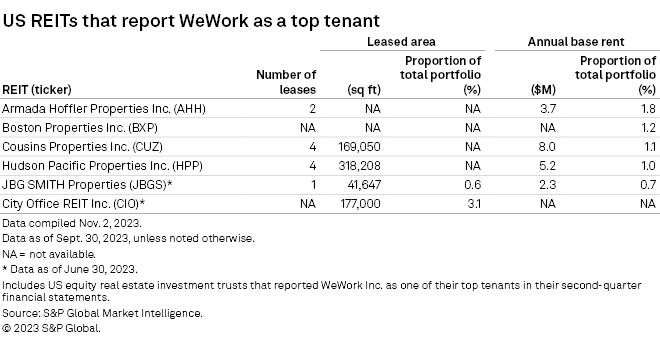
WeWork Inc. ( WEWKQ ) declared bankruptcy on November 6th. There are 6 REITs which report WeWork as a top tenant.
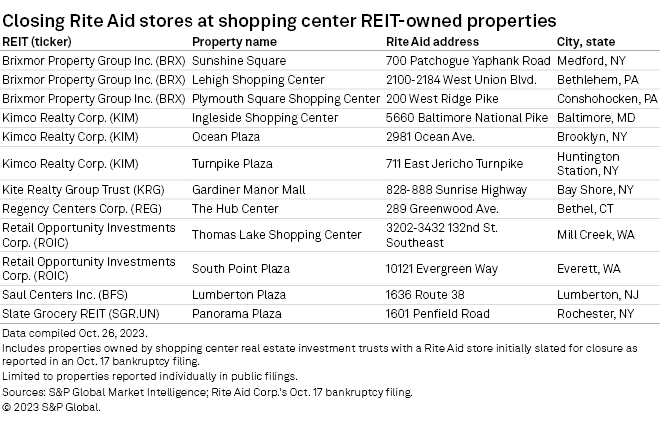
Rite Aid Corporation ( RADCQ ) filed for bankruptcy on October 17th and announced a list of store closures. 6 American shopping center REITs and 1 Canadian shopping center REIT own properties that contain Rite Aid stores that are slated for closure.
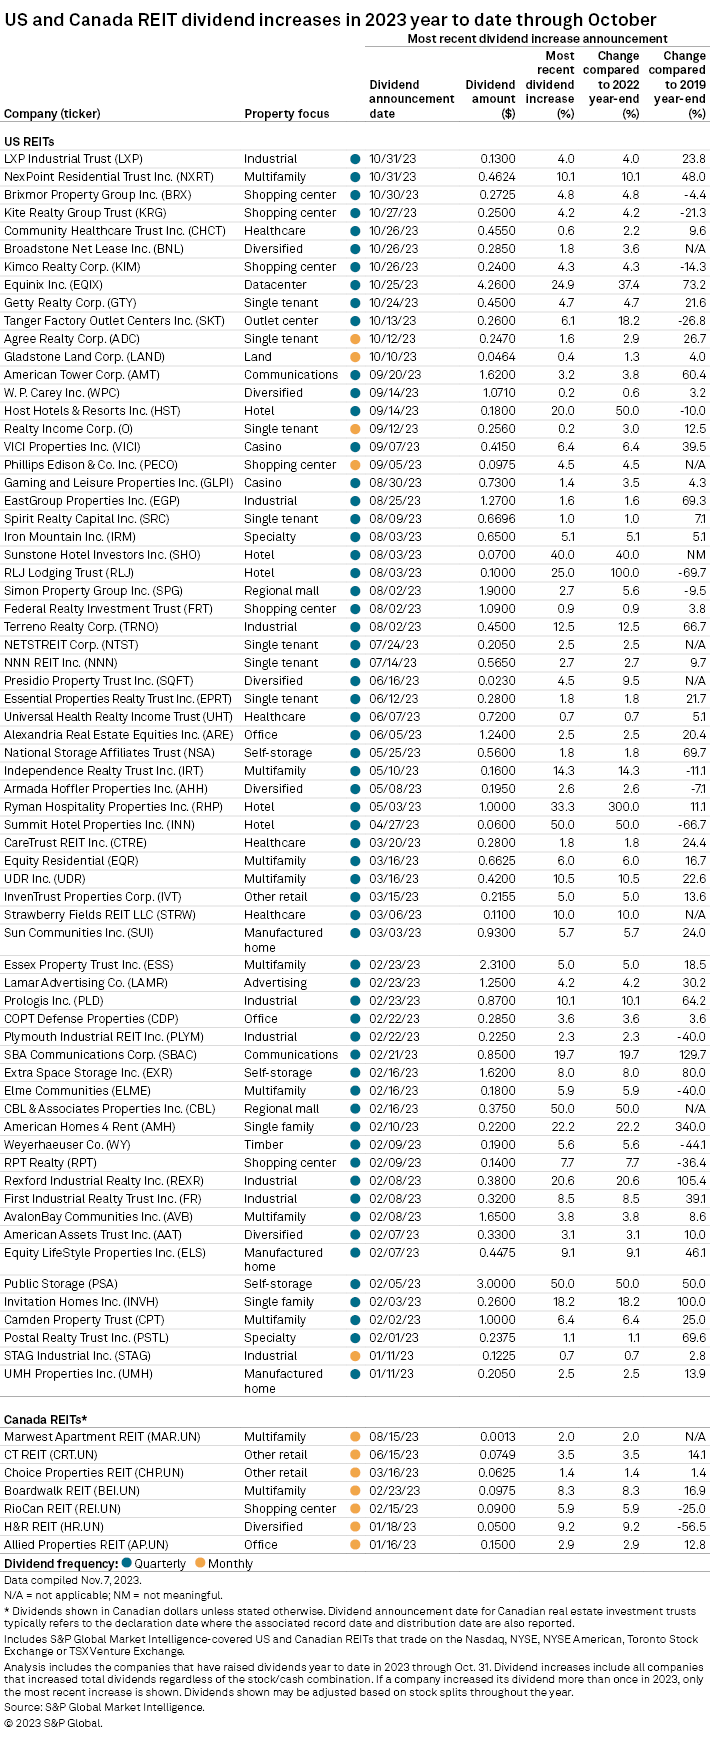
Although REIT share prices have taken a beating in each of the past 3 months, fundamentals remain strong for many REITs and dividends continue to grow, including hikes for a dozen REITs in October alone. Equinix, Inc. ( EQIX ) (+24.9%) and NexPoint Residential Trust, Inc. ( NXRT ) (10.1%) both reported dividend hikes with double-digit percent increases in October.
Source: Nasdaq.com
REITs have fallen further from their 52-week high than any other GICS sector. This disproportionately large drop has left the REIT sector with an attractive relative valuation. While it remains to be seen which path the economy and interest rates will take over the next year, REITs appear well-positioned for outperformance due to their significant NAV discounts and strong dividend yields.
For further details see:
The State Of REITs: November 2023 Edition