SRVR - The State Of REITs: October 2023 Edition
2023-10-30 13:51:33 ET
Summary
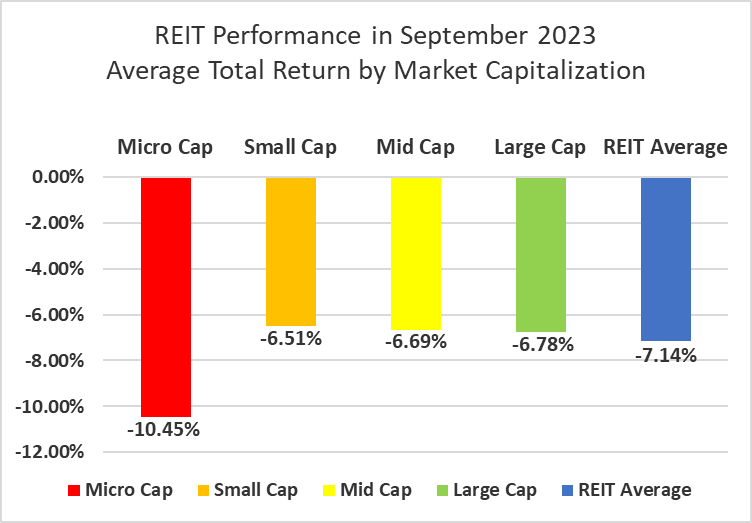
- REITs averaged a -7.14% total return in September and have fallen into the red year to date.
- Small cap REITs (-6.51%) outperformed yet again in September. Micro caps (-10.45%) continue to severely underperform their larger REIT peers.
- Only 9.74% of REIT securities had a positive total return in September with 34.38% in the black year to date.
- Hotel (-2.77%) and Casino (-3.41%) REITs outperformed all other REIT property types with the smallest average negative total return in September. Office (-11.16%) and Land (-10.60%) REITs underperformed.
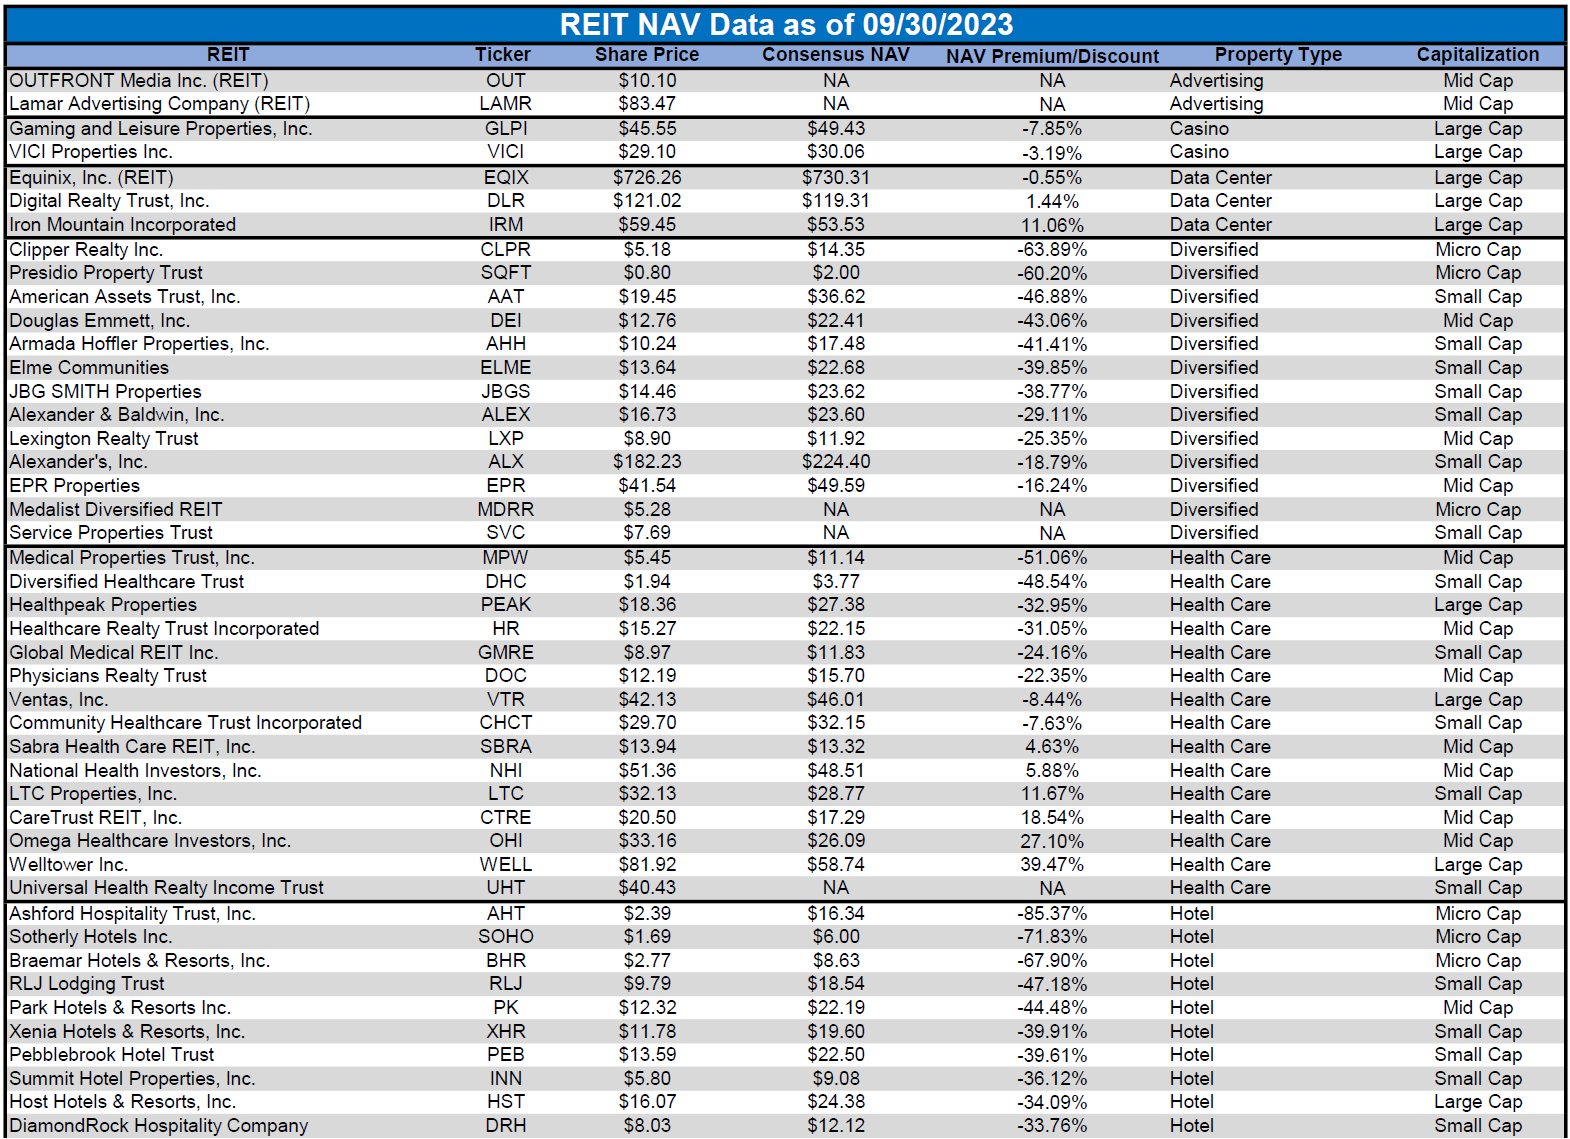
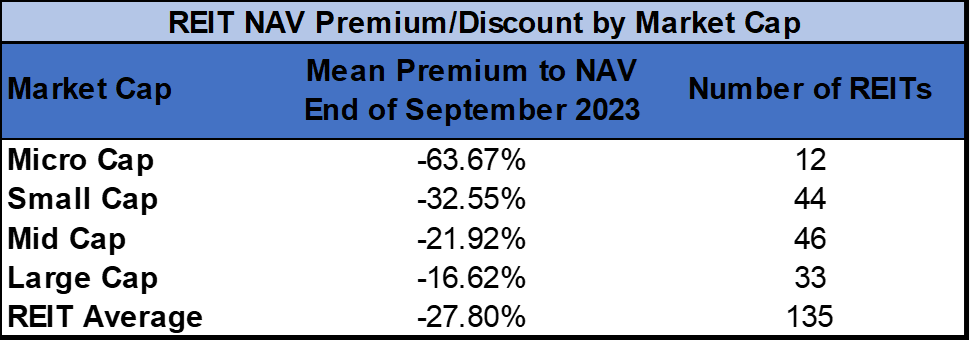
- The average REIT NAV discount widened from -22.67% to -27.80% during September. The median NAV discount widened from -20.25% to -25.00%.
REIT Performance
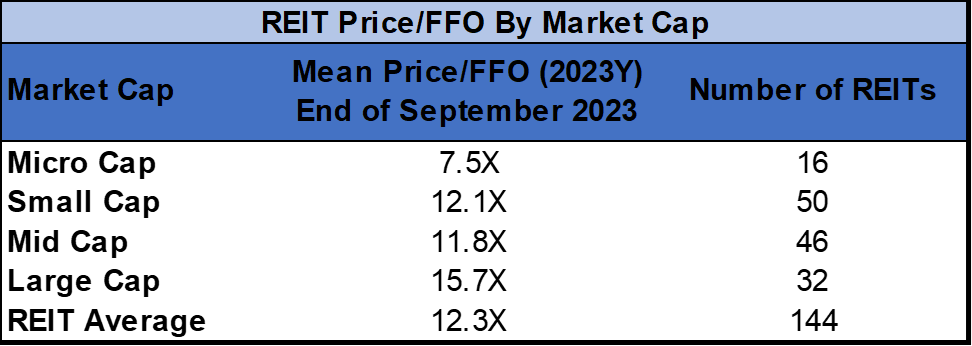
REITs followed up a difficult August (-4.13%) with an even rougher September (-7.14%). The average REIT total return in September was worse than that of the Dow Jones Industrial Average (-3.4%), S&P 500 (-4.8%) and NASDAQ (-5.8%). The market cap weighted Vanguard Real Estate ETF ( VNQ ) narrowly underperformed the average REIT in September (-7.27% vs. -7.14%) but has outperformed YTD (-5.44% vs. -6.54%). The spread between the 2023 FFO multiples of large cap REITs (15.7x) and small cap REITs (12.1x) narrowed in September as multiples compressed 1.1 turns for large caps and 0.5 turns for small caps. Investors currently need to pay an average of 29.8% more for each dollar of FFO from large cap REITs relative to small cap REITs. In this monthly publication, I will provide REIT data on numerous metrics to help readers identify which property types and individual securities currently offer the best opportunities to achieve their investment goals.
Source: Graph by Simon Bowler of 2nd Market Capital, Data compiled from S&P Global Market Intelligence LLC. See important notes and disclosures at the end of this article
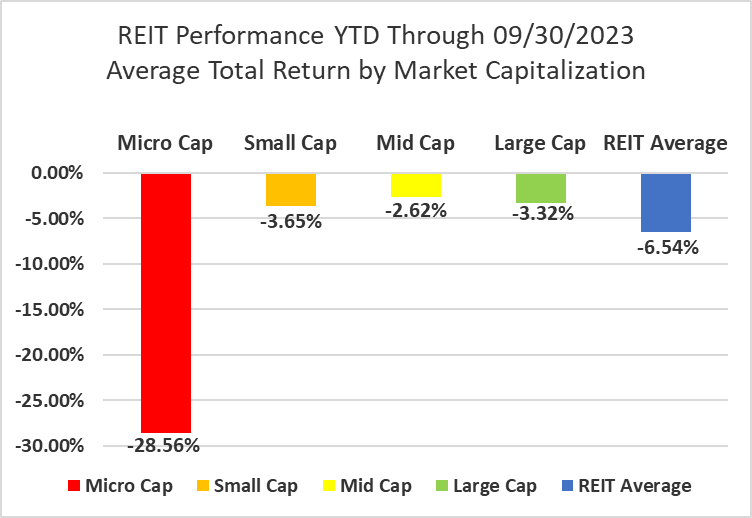
In September micro cap REITs (-10.45%) continued to perform far worse than their larger peers. Small caps (-6.51%) continued to outperform in September with a smaller average negative total return than mid caps (-6.69%) and large caps (-6.78%). Large cap REITs (-3.32%) are narrowly outperforming small caps (-3.65%) by 33 basis points on YTD 2023 total return.
Source: Graph by Simon Bowler of 2nd Market Capital, Data compiled from S&P Global Market Intelligence LLC. See important notes and disclosures at the end of this article
0 out of 18 Property Types Yielded Positive Total Returns in September
100% percent of REIT property types averaged a negative total return in September, with a narrow 8.39% total return spread between the best and worst performing property types. Hotels (-2.77%) and Casinos (-3.41%) were the REIT property types with the smallest negative average total returns in September.
Office (-11.16%) and Land (-10.60%) saw even sharper declines than the rest of the REIT sector, averaging double digit negative total returns in September. All 20 Office REITs were in the red as sentiment on the office sector remains very negative and data has not yet emerged to suggest a turnaround in fundamentals is coming anytime soon.
Source: Table by Simon Bowler of 2nd Market Capital, Data compiled from S&P Global Market Intelligence LLC. See important notes and disclosures at the end of this article
Despite a smaller than average decline in September, Infrastructure remains the worst performing REIT property type year to date (-35.95%). Land (-24.43%), Advertising (-21.48%), Malls (-19.10%), Office (-17.91%) and Triple Net (-11.41%) have also averaged double digit negative total returns in 2023. The number of REIT property types in the black year to date decreased from 8 to 5 in September. Data Centers (+20.12%) and Single Family Housing (+11.69%) are the top performing property types year to date.
Source: Table by Simon Bowler of 2nd Market Capital, Data compiled from S&P Global Market Intelligence LLC. See important notes and disclosures at the end of this article
The REIT sector as a whole saw the average P/FFO (2023Y) decrease 1.1 turns in September from 13.4x down to 12.3x. The average REIT in every single property type saw multiple contraction in September. There are no recent 2023 FFO/share estimates for any of the Timber REITs. Land (33.7x), Data Centers (23.8x), Single Family Housing (19.1x), Manufactured Housing (18.4x) and Industrial (18.2x) currently trade at the highest average multiples among REIT property types. Infrastructure (9.9x) joined Malls (4.7x), Office (7.2x), Hotels (7.5x) as one of the 4 REIT property types trading at single digit multiples.
Source: Table by Simon Bowler of 2nd Market Capital, Data compiled from S&P Global Market Intelligence LLC. See important notes and disclosures at the end of this article
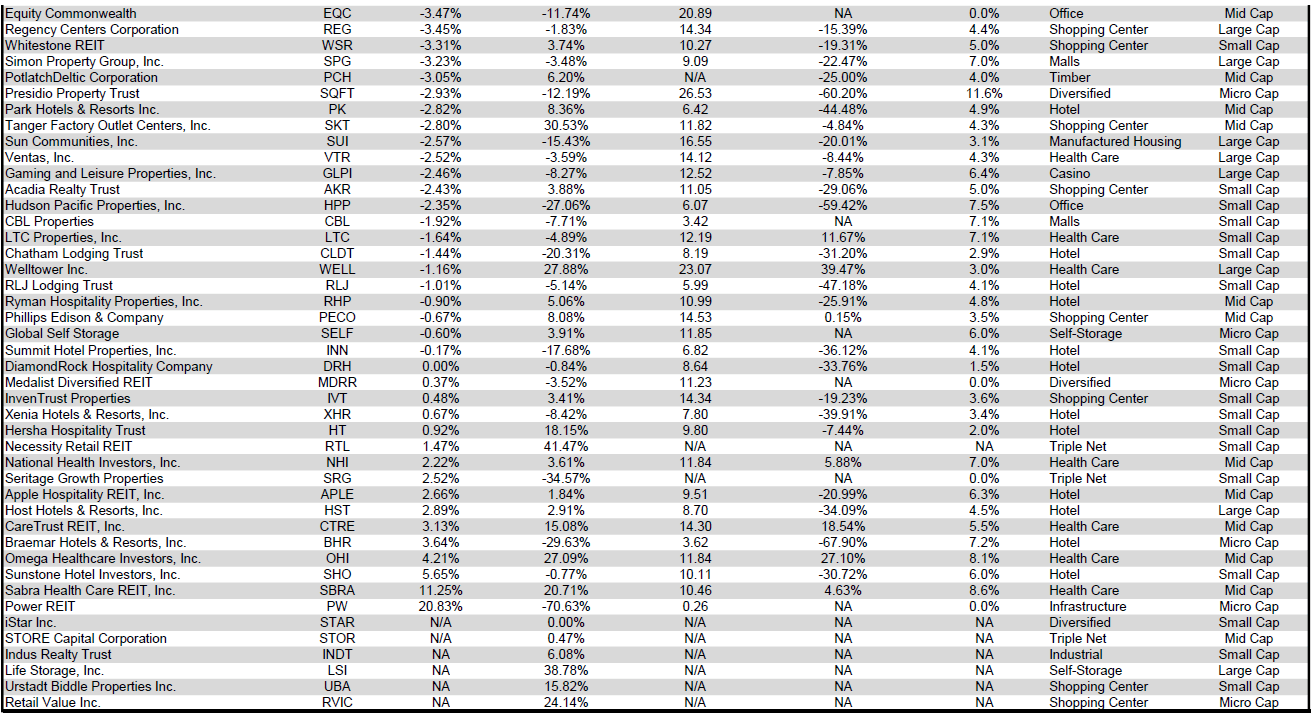
Performance of Individual Securities
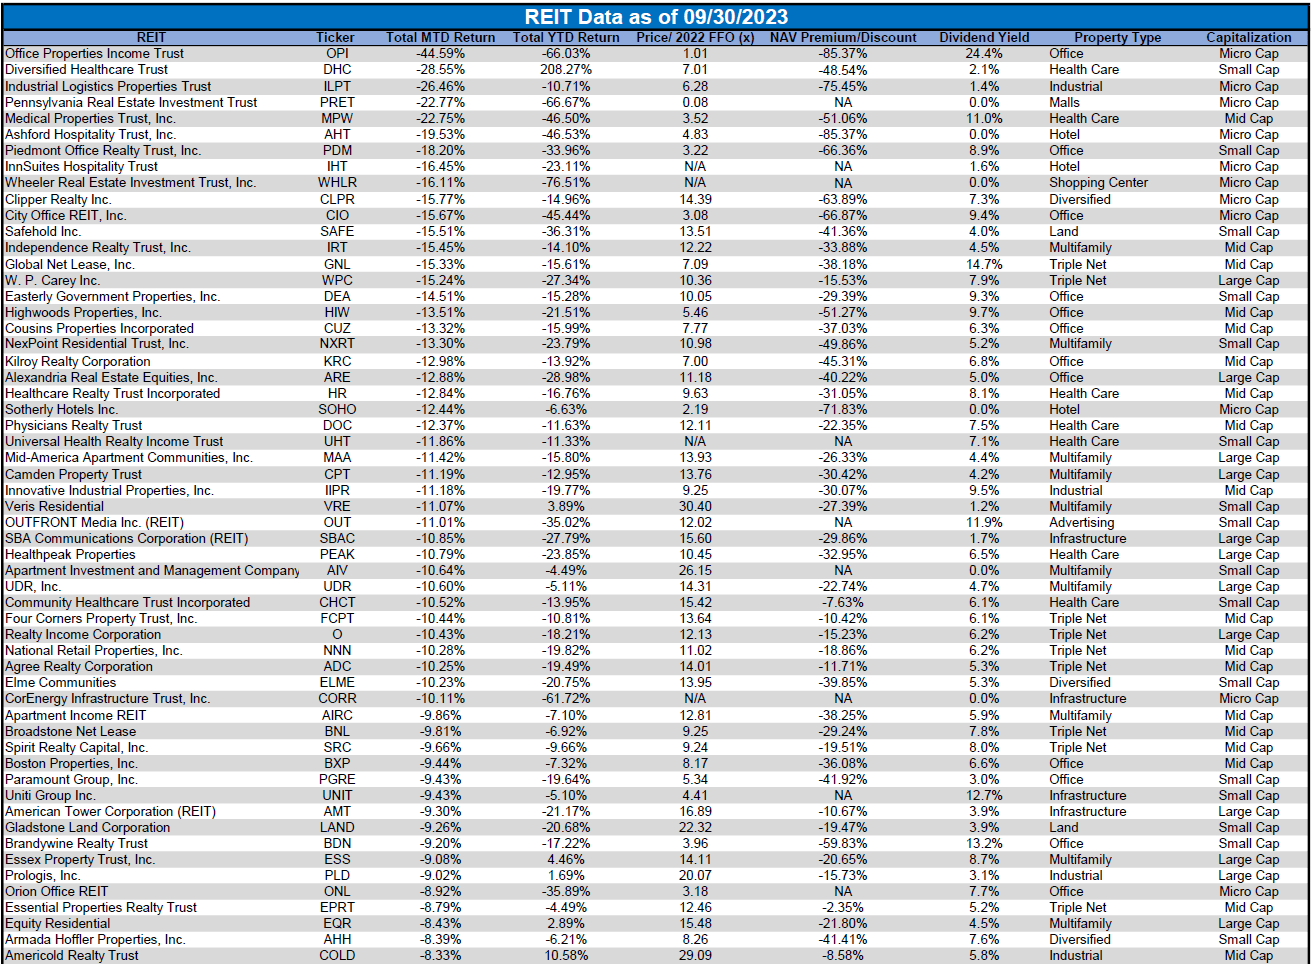
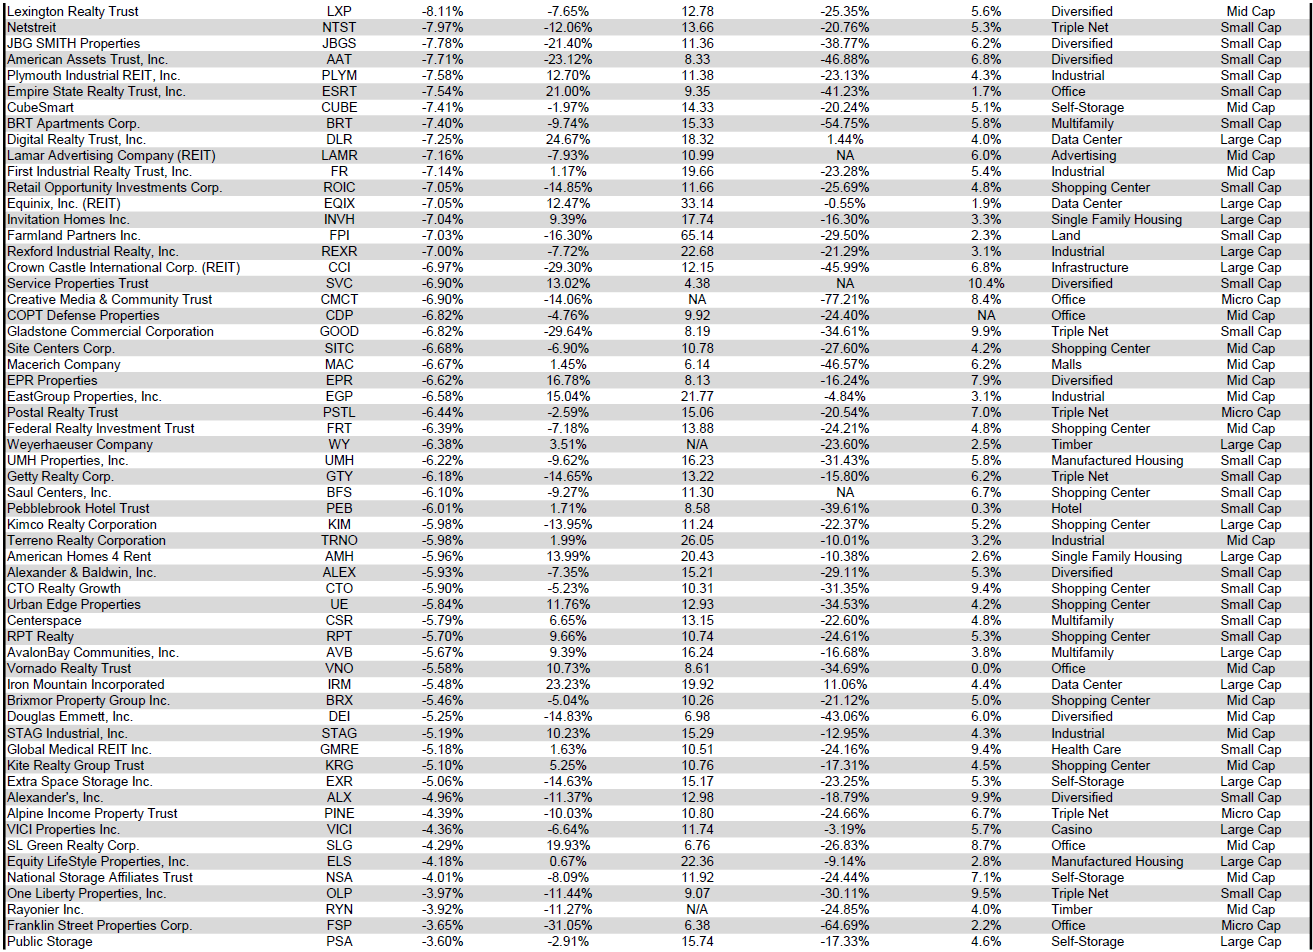
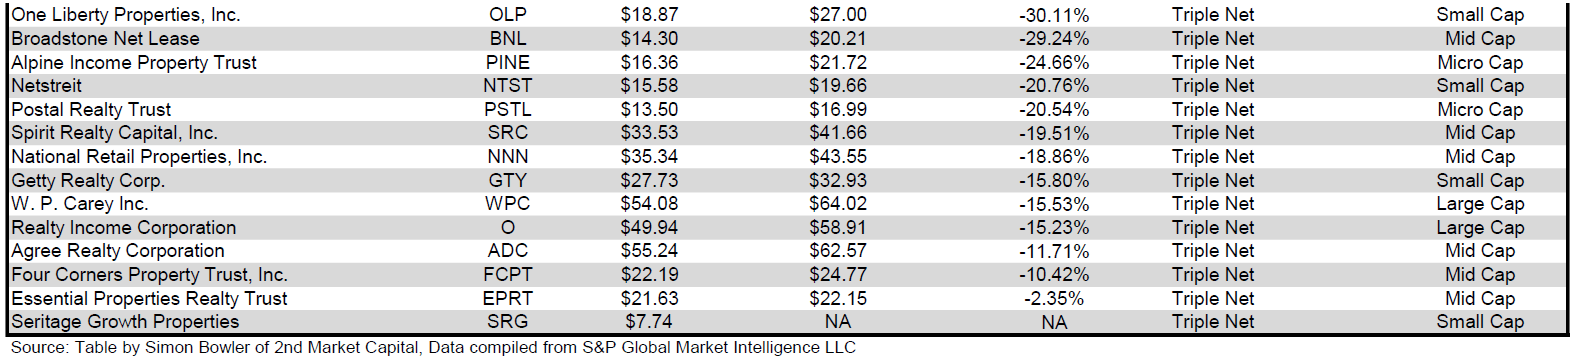
Necessity Retail REIT was acquired by Global Net Lease ( GNL ) on September 12 th in a stock for stock transaction. Shareholders of Necessity Retail REIT received 0.67 shares of GNL for each share of RTL they held.
Power REIT ( PW ) (+20.83%) was the worst performing REIT in August, but partially bounced back with the highest total return in September. However, even after a strong September PW remains the 2 nd worst performing REIT YTD with a dismal -70.63% total return.
Office Properties Income Trust ( OPI ) (-44.59%) announced on September 1 st that they were terminating their planned merger with Diversified Healthcare Trust ( DHC ). This led to sharp declines for both REITs with DHC not fairing much better than OPI and finishing the month as the 2 nd worst performing REIT of September (-28.55%) behind only OPI. The 3 rd worst performing REIT, Industrial Logistics Properties Trust ( ILPT ) (-26.46%), is also managed by the same notoriously poor external management team at RMR Group ( RMR ) that manages OPI and DHC.
Only 9.74% of REITs had a positive total return in September with 34.38% in the black year to date. During the first 9 months of last year the average REIT had an awful -26.68% return. During the first 9 months of this year the average REIT has endured much smaller losses with a -6.54% average total return.
Source: Table by Simon Bowler of 2nd Market Capital, Data compiled from S&P Global Market Intelligence LLC. See important notes and disclosures at the end of this article Source: Table by Simon Bowler of 2nd Market Capital, Data compiled from S&P Global Market Intelligence LLC. See important notes and disclosures at the end of this article Source: Table by Simon Bowler of 2nd Market Capital, Data compiled from S&P Global Market Intelligence LLC. See important notes and disclosures at the end of this article
For the convenience of reading this table in a larger font, the table above is available as a PDF as well .
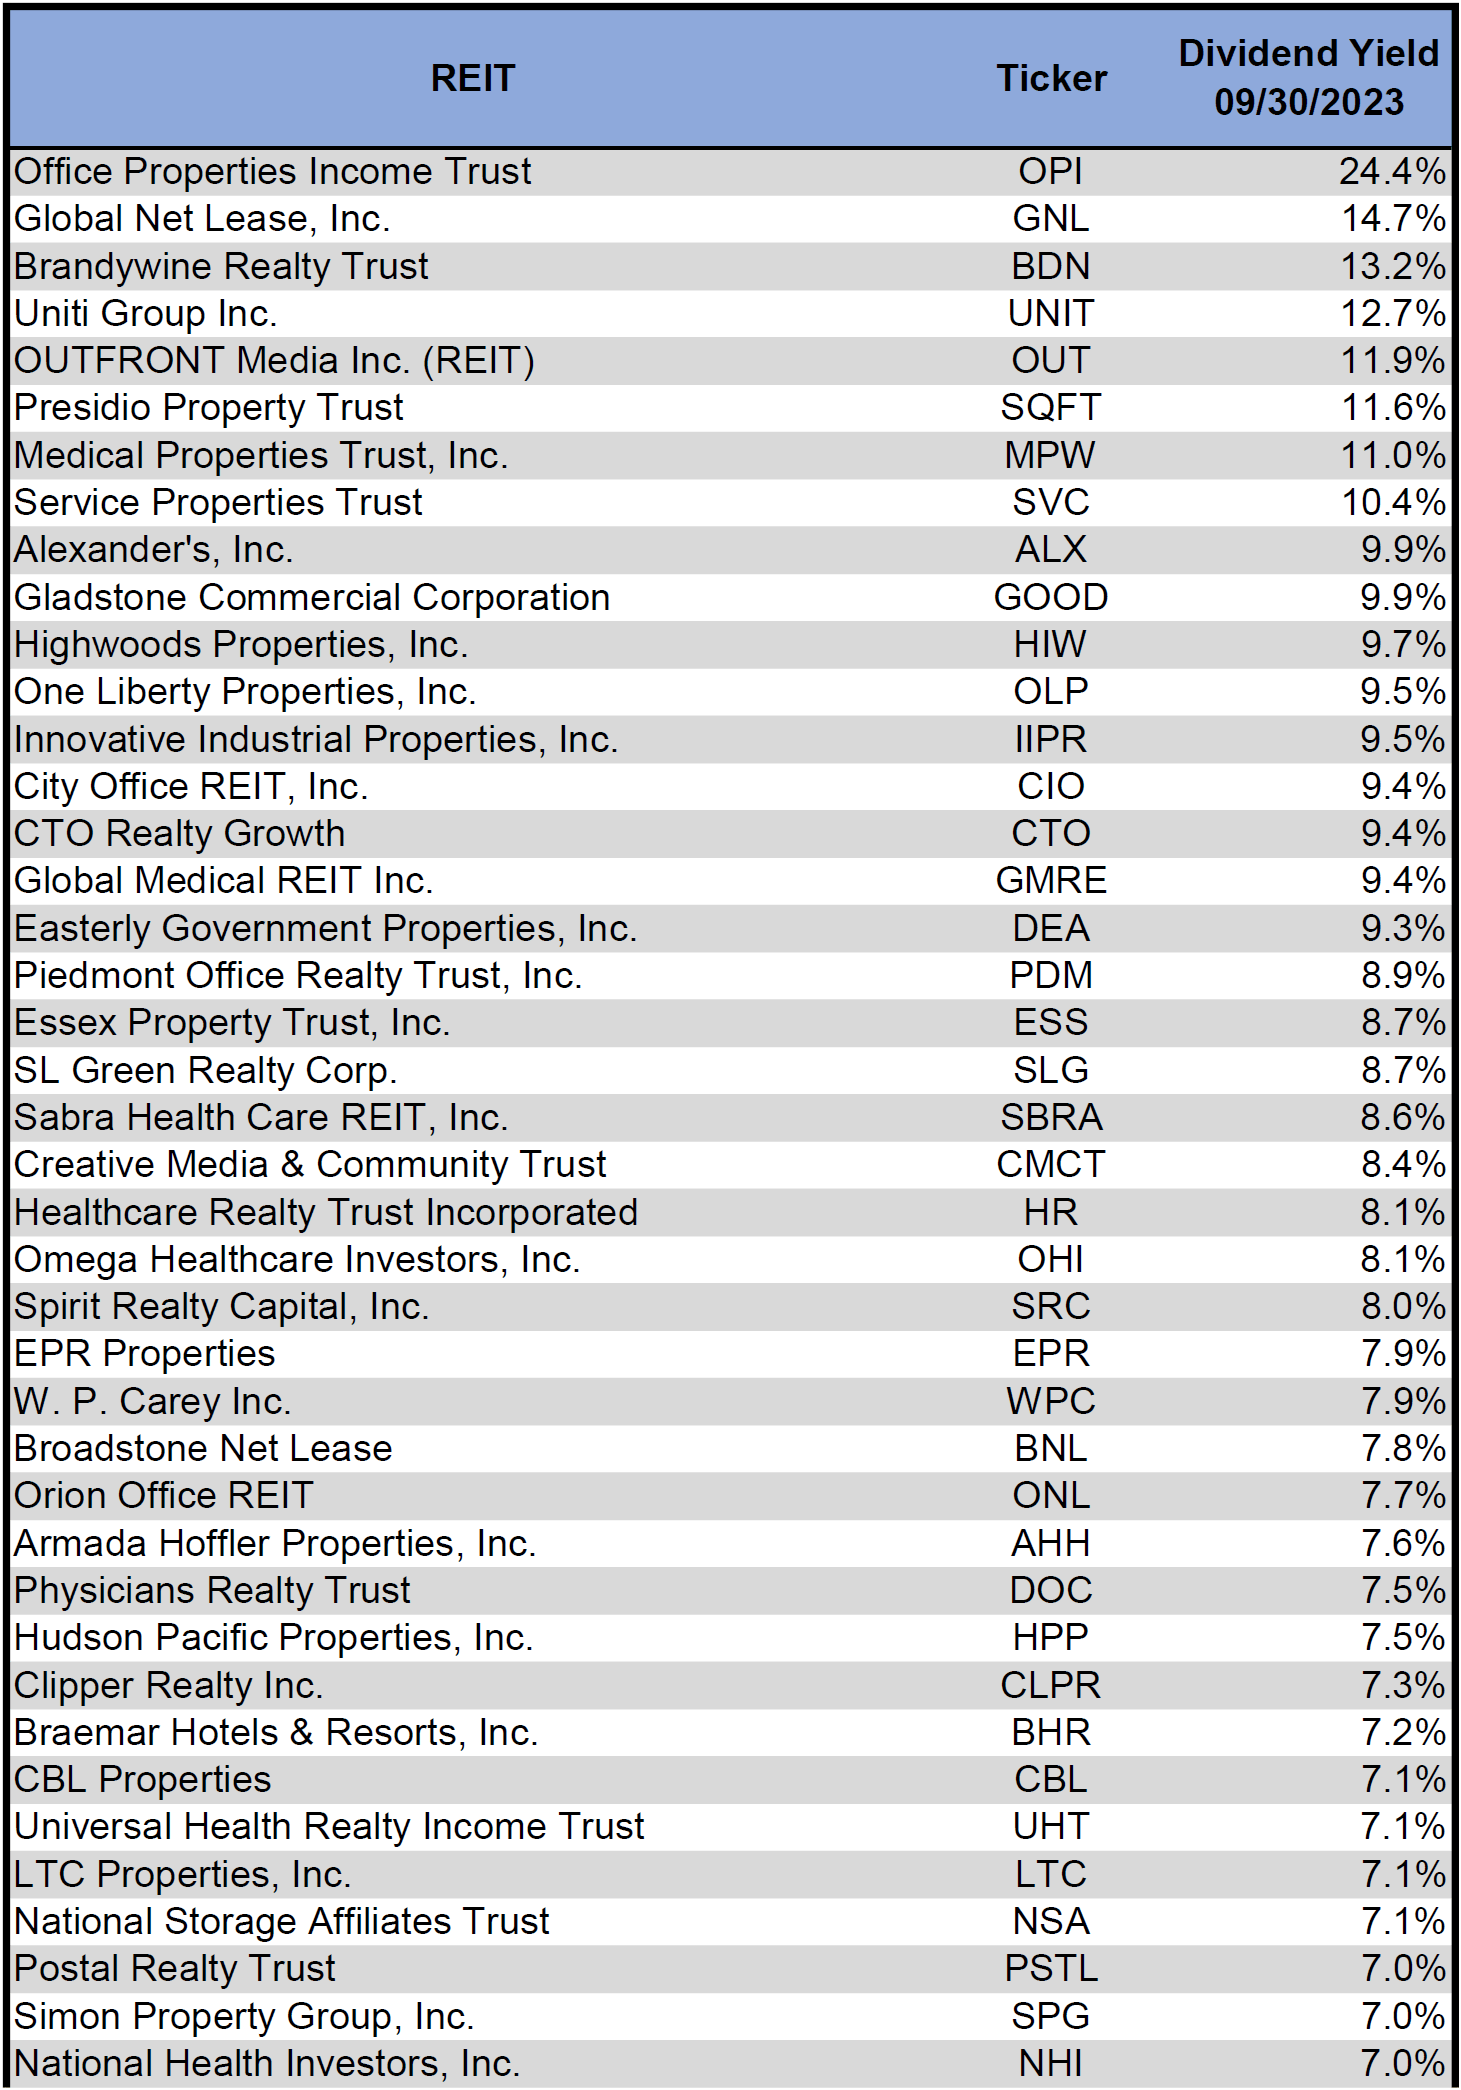
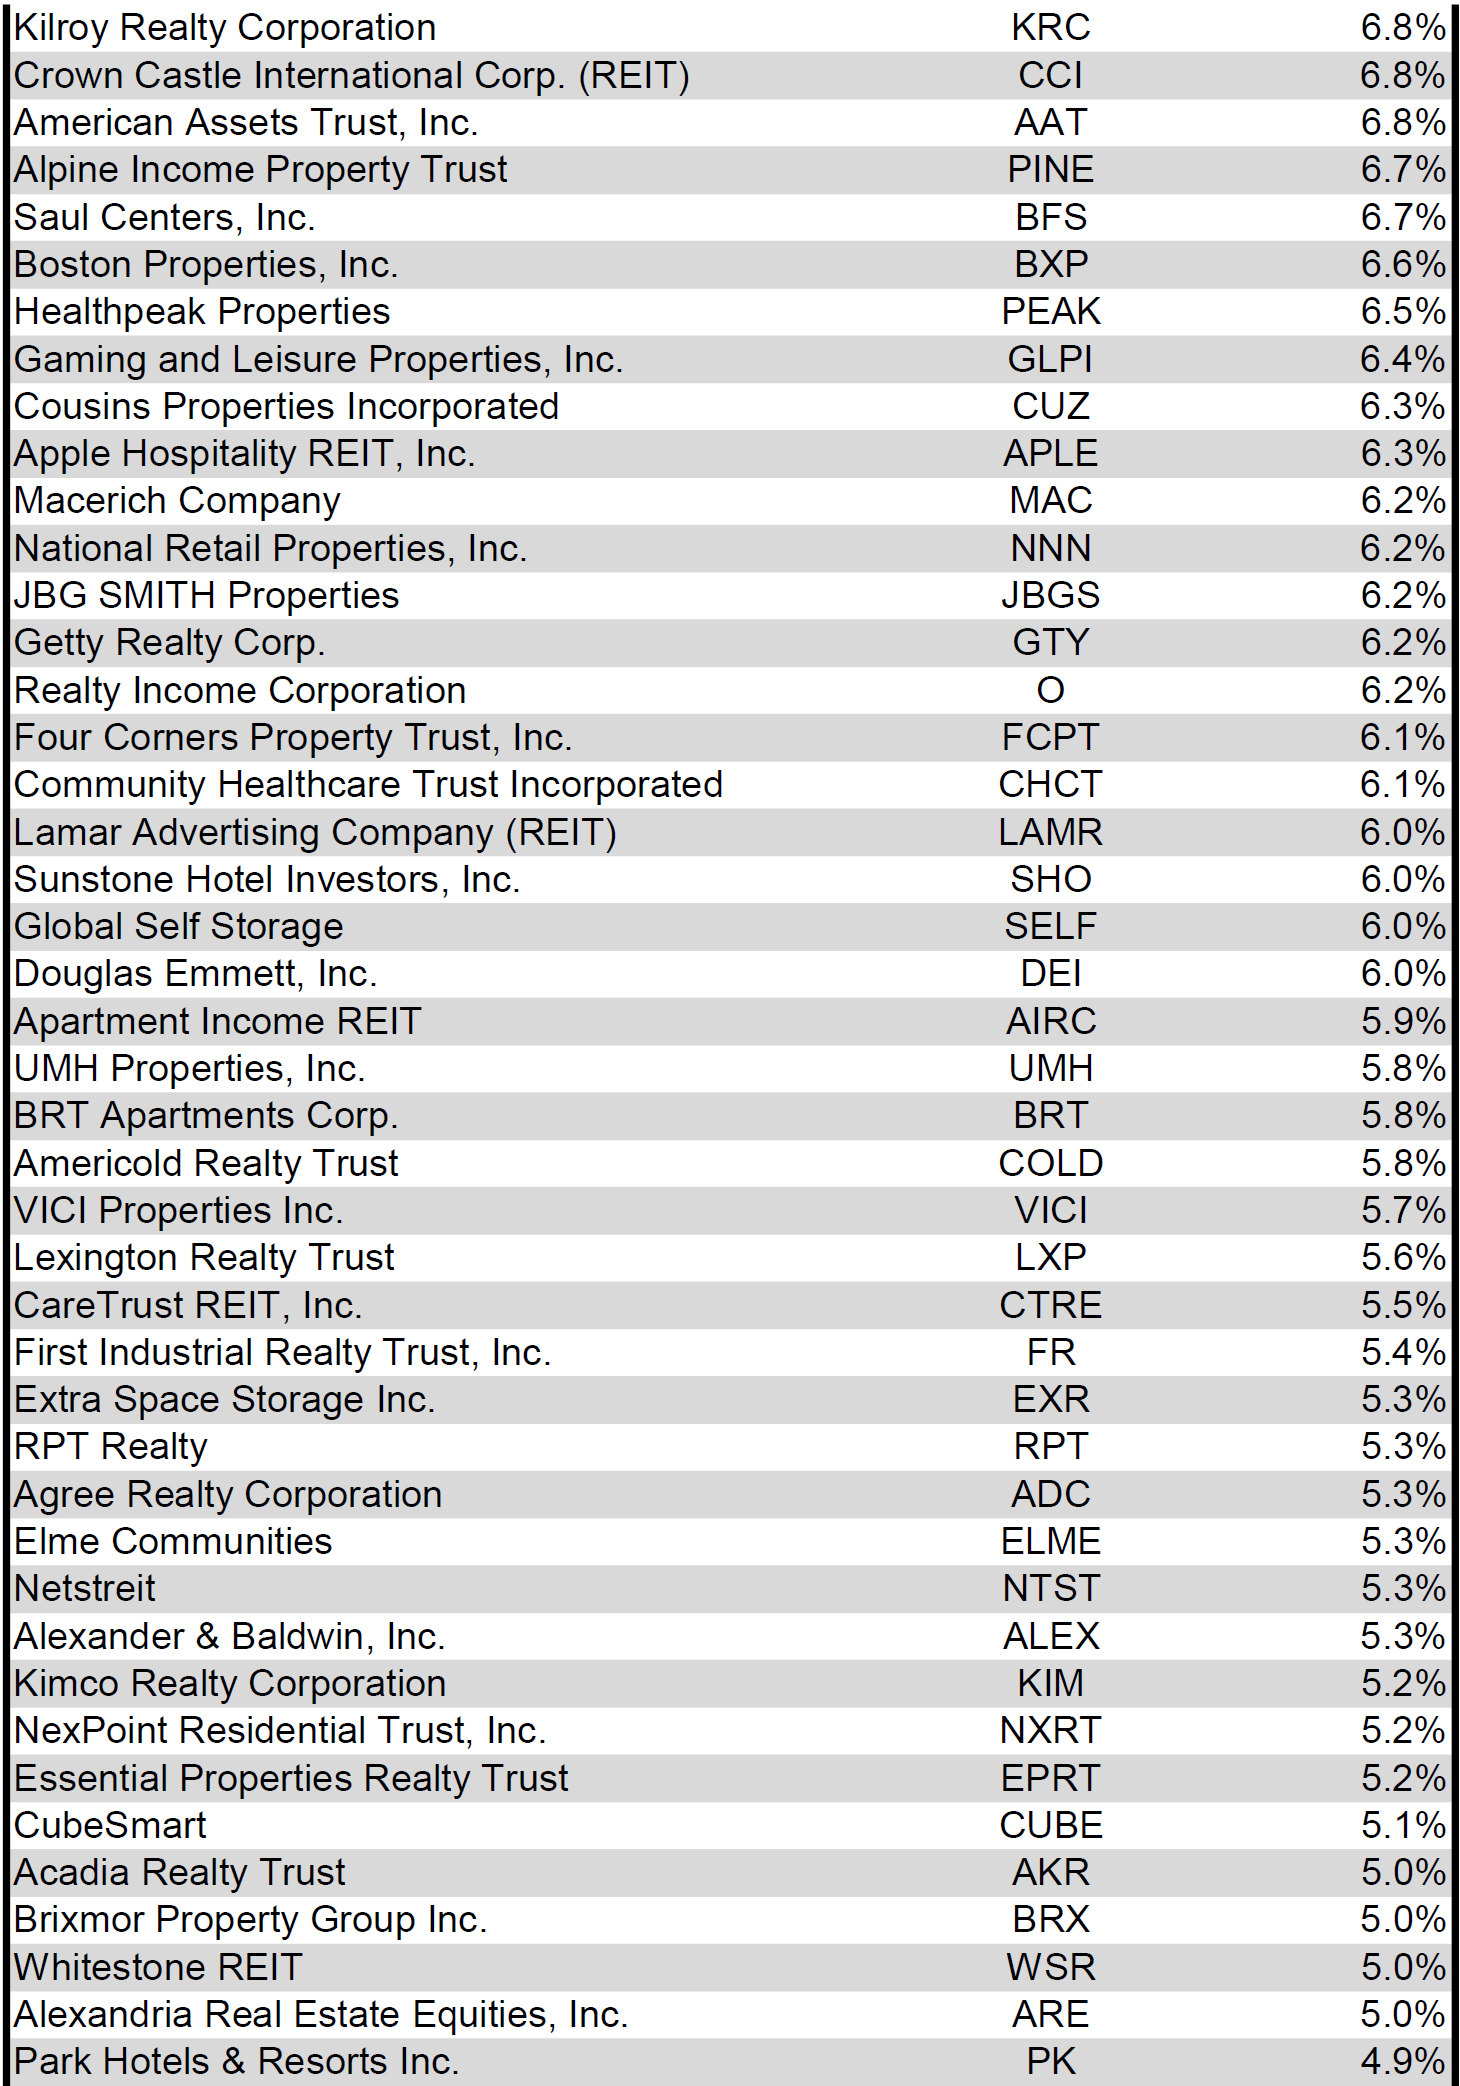
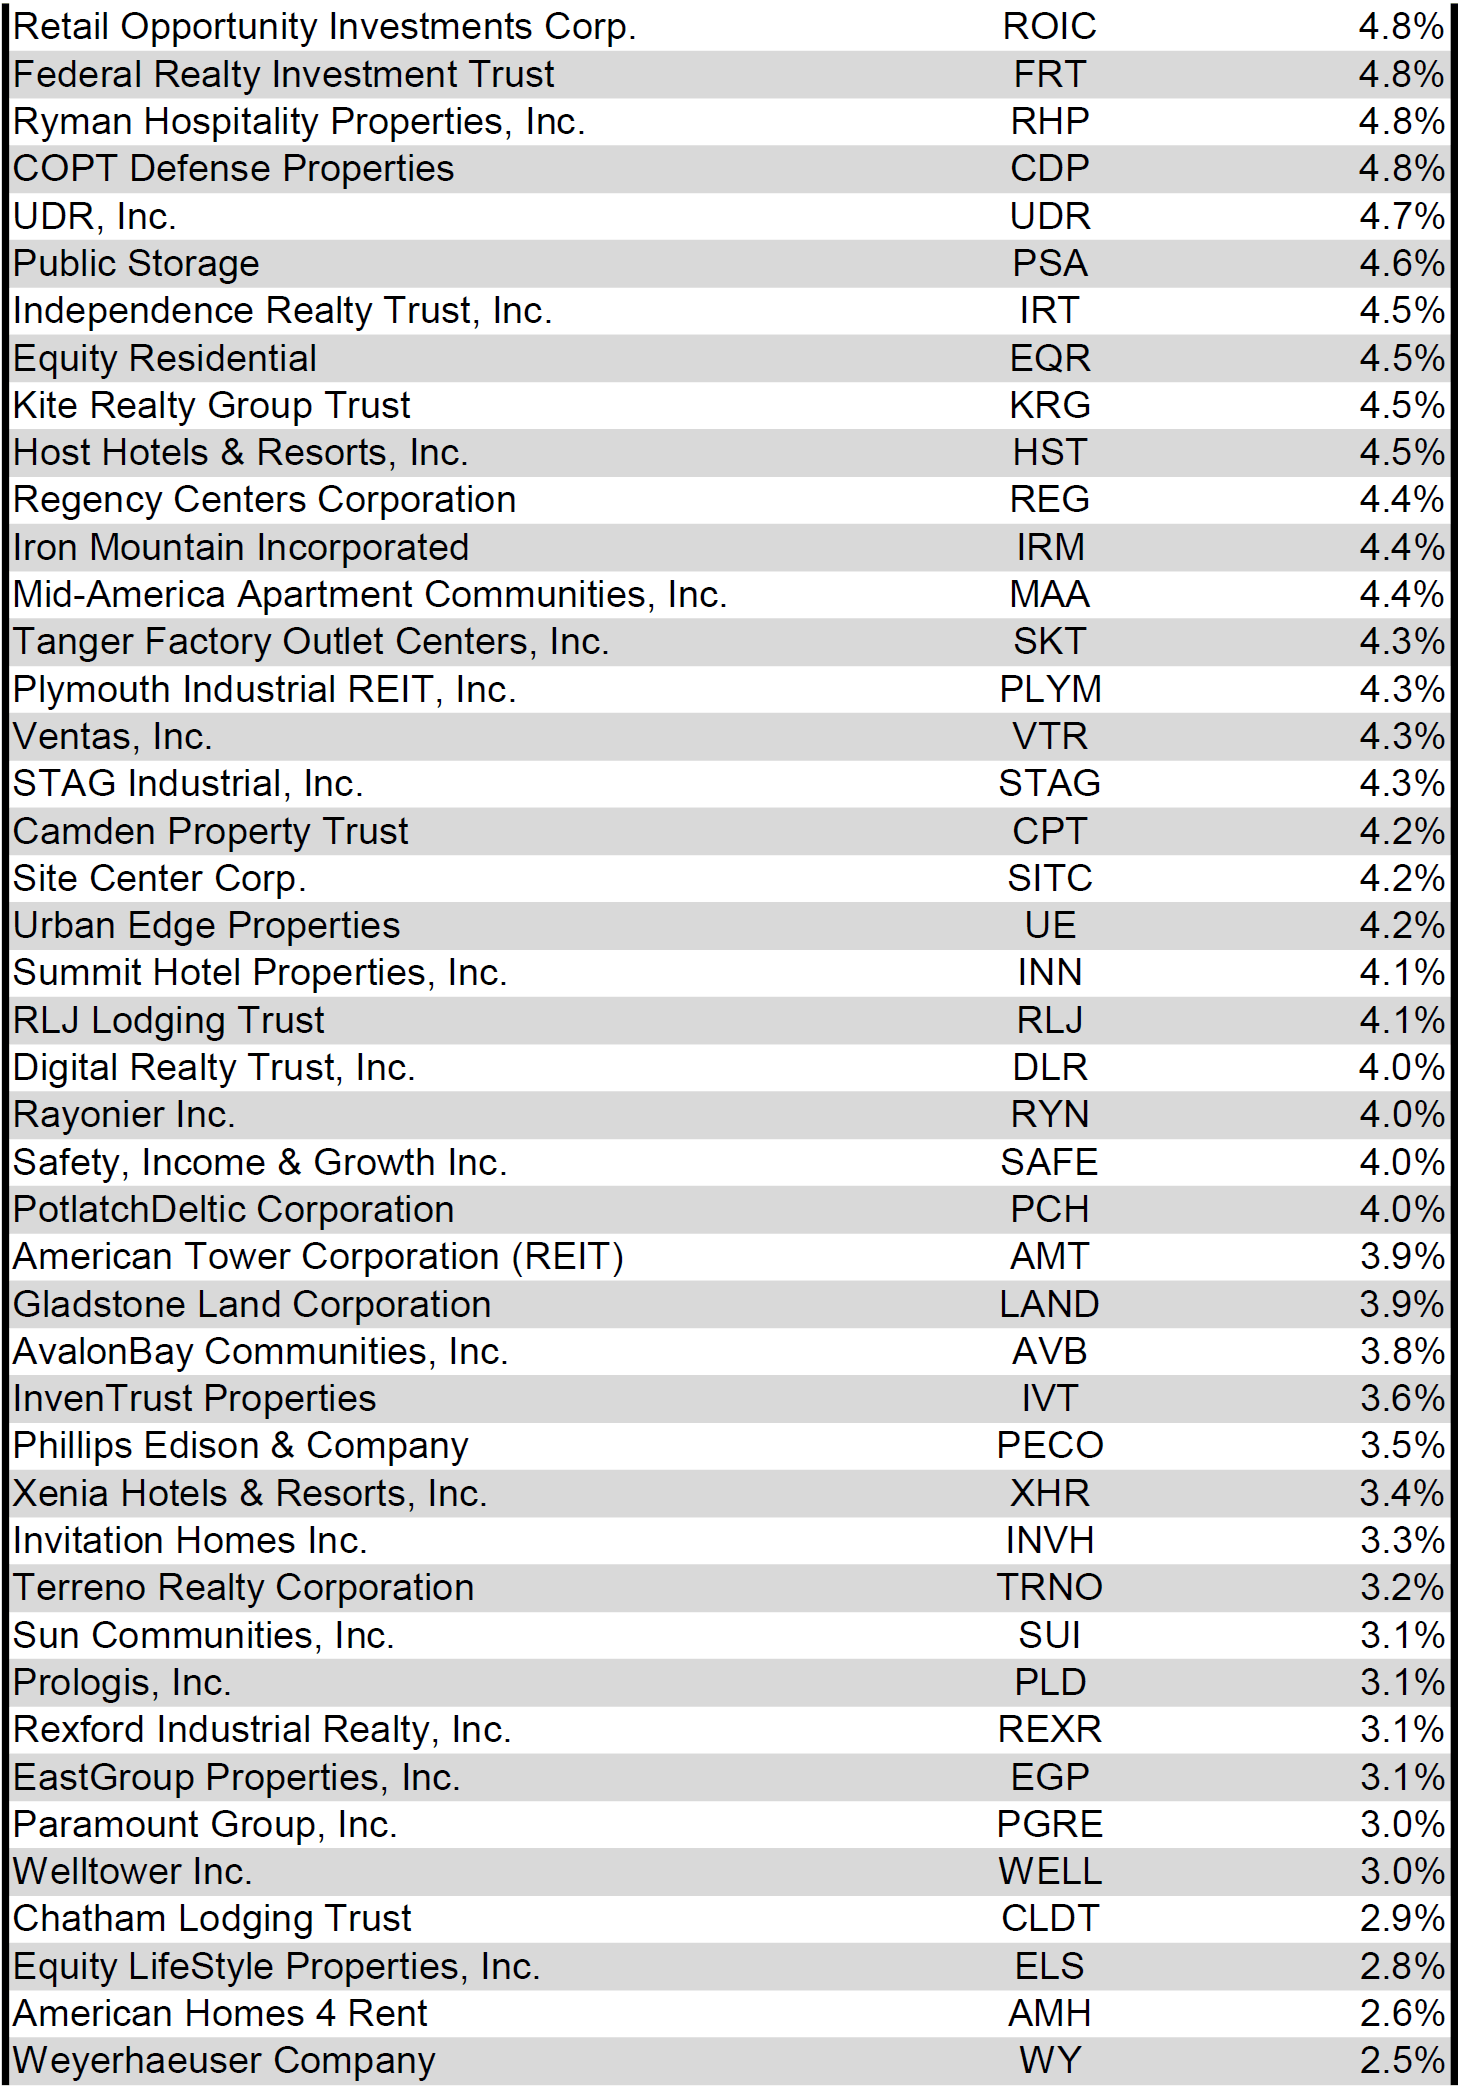
Dividend Yield
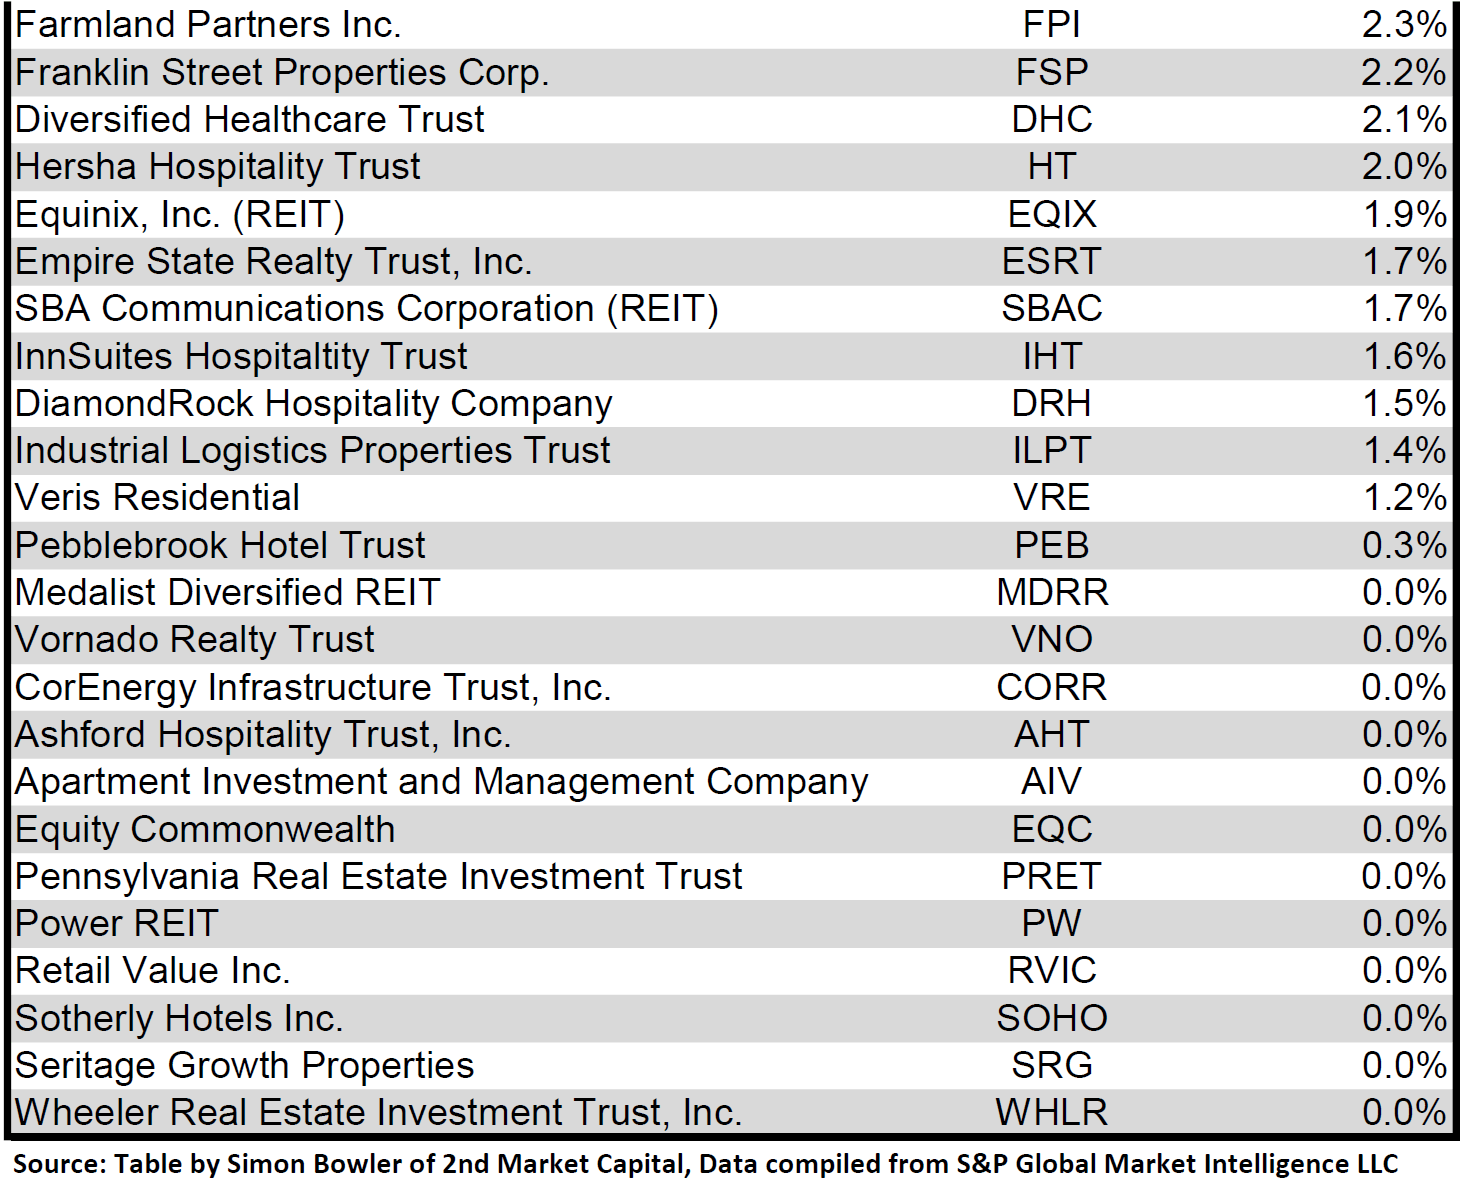
Dividend yield is an important component of a REIT's total return. The particularly high dividend yields of the REIT sector are, for many investors, the primary reason for investment in this sector. As many REITs are currently trading at share prices well below their NAV, yields are currently quite high for many REITs within the sector. Although a particularly high yield for a REIT may sometimes reflect a disproportionately high risk, there exist opportunities in some cases to capitalize on dividend yields that are sufficiently attractive to justify the underlying risks of the investment. I have included below a table ranking equity REITs from highest dividend yield (as of 09/30/2023) to lowest dividend yield.
Source: Table by Simon Bowler of 2nd Market Capital, Data compiled from S&P Global Market Intelligence LLC. See important notes and disclosures at the end of this article Source: Table by Simon Bowler of 2nd Market Capital, Data compiled from S&P Global Market Intelligence LLC. See important notes and disclosures at the end of this article Source: Table by Simon Bowler of 2nd Market Capital, Data compiled from S&P Global Market Intelligence LLC. See important notes and disclosures at the end of this article Source: Table by Simon Bowler of 2nd Market Capital, Data compiled from S&P Global Market Intelligence LLC. See important notes and disclosures at the end of this article
For the convenience of reading this table in a larger font, the table above is available as a PDF as well .
Although a REIT’s decision regarding whether to pay a quarterly dividend or a monthly dividend does not reflect on the quality of the company’s fundamentals or operations, a monthly dividend allows for a smoother cash flow to the investor. Below is a list of equity REITs that pay monthly dividends ranked from highest yield to lowest yield.
Source: Table by Simon Bowler of 2nd Market Capital, Data compiled from S&P Global Market Intelligence LLC. See important notes and disclosures at the end of this article
Valuation
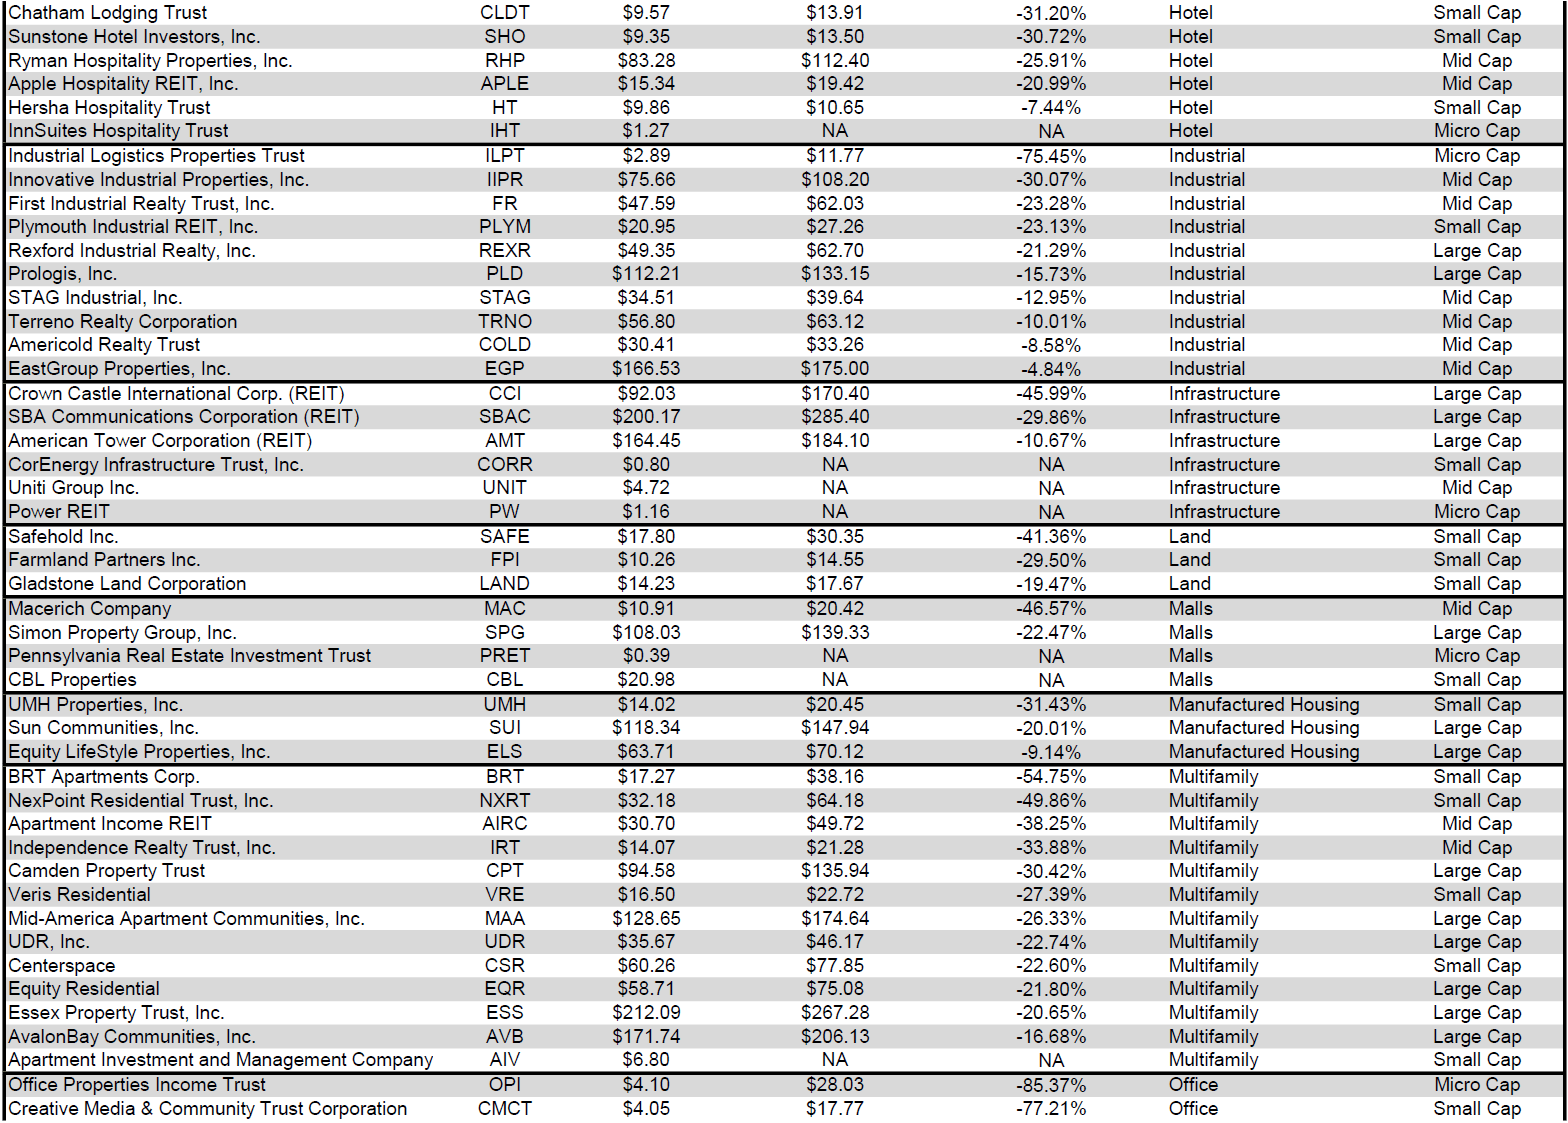
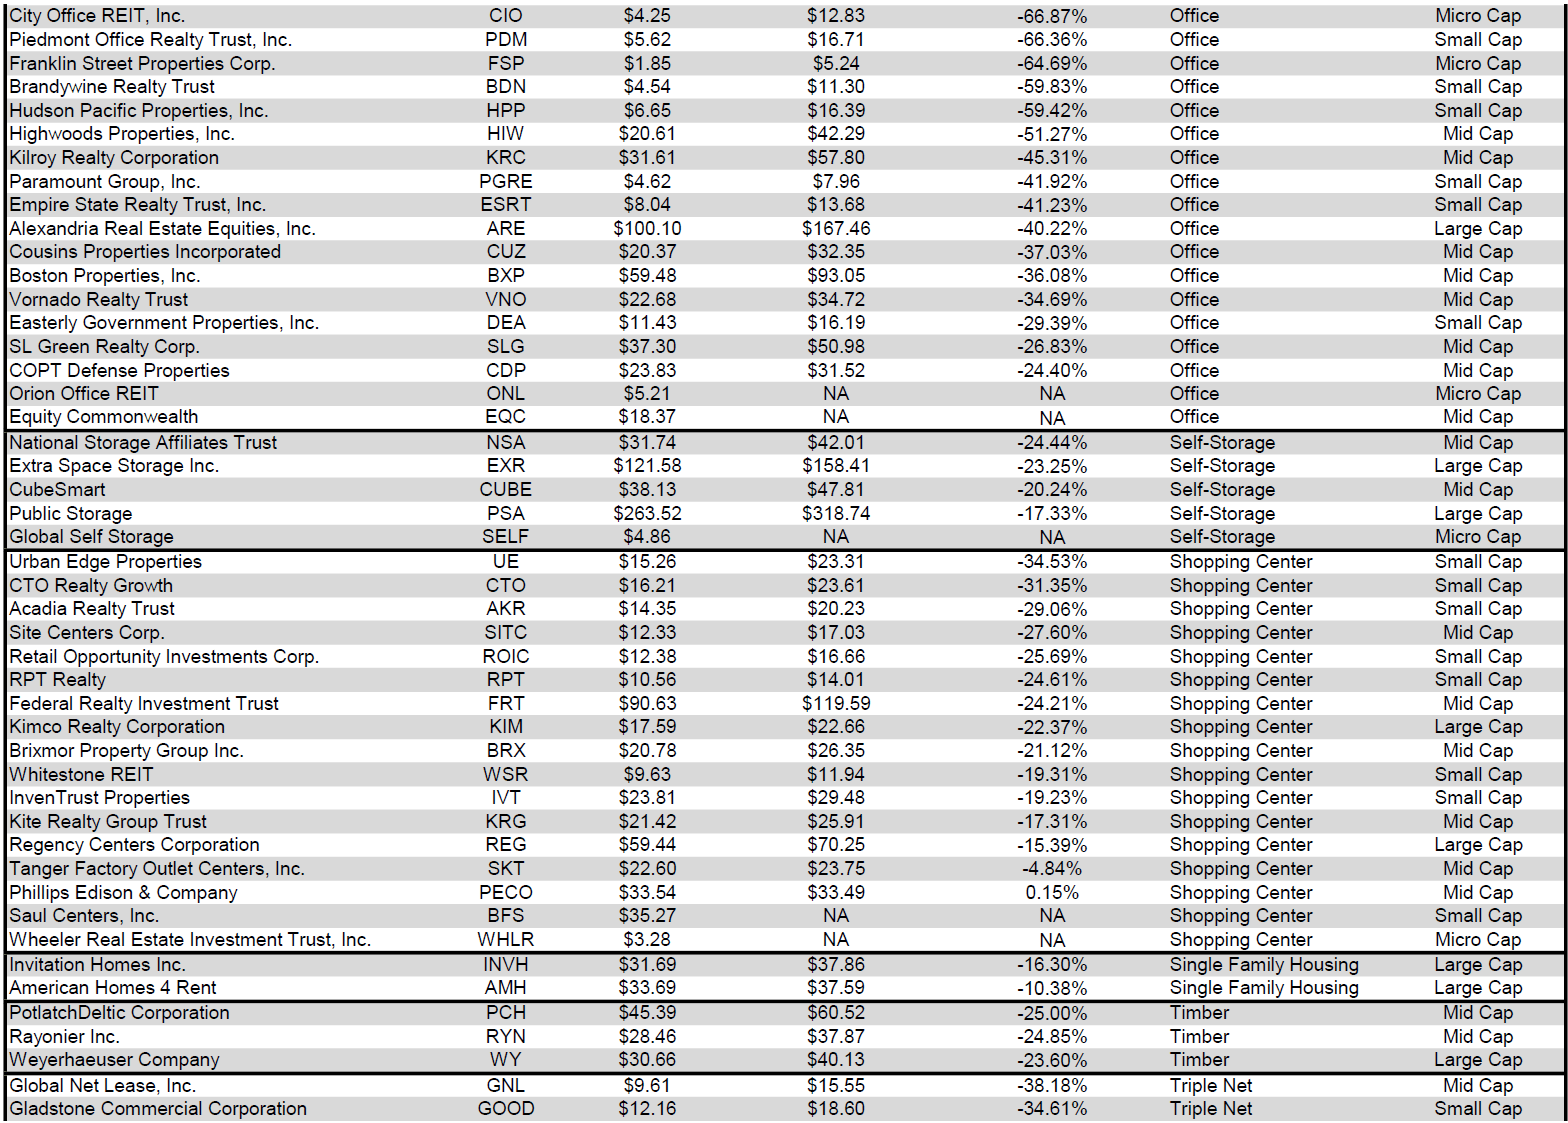
REIT Premium/Discount to NAV by Property Type
Below is a downloadable data table, which ranks REITs within each property type from the largest discount to the largest premium to NAV. The consensus NAV used for this table is the average of analyst NAV estimates for each REIT. Both the NAV and the share price will change over time, so I will continue to include this table in upcoming issues of The State of REITs with updated consensus NAV estimates for each REIT for which such an estimate is available.
Source: Table by Simon Bowler of 2nd Market Capital, Data compiled from S&P Global Market Intelligence LLC. See important notes and disclosures at the end of this article Source: Table by Simon Bowler of 2nd Market Capital, Data compiled from S&P Global Market Intelligence LLC. See important notes and disclosures at the end of this article Source: Table by Simon Bowler of 2nd Market Capital, Data compiled from S&P Global Market Intelligence LLC. See important notes and disclosures at the end of this article Source: Table by Simon Bowler of 2nd Market Capital, Data compiled from S&P Global Market Intelligence LLC. See important notes and disclosures at the end of this article
For the convenience of reading this table in a larger font, the table above is available as a PDF as well .
Takeaway
The large cap REIT premium (relative to small cap REITs) narrowed in September and investors are now paying on average about 30% more for each dollar of 2023 FFO/share to buy large cap REITs than small cap REITs (15.7x/12.1x - 1 = 29.8%). As can be seen in the table below, there is presently a strong positive correlation between market cap and FFO multiple.
Source: Table by Simon Bowler of 2nd Market Capital, Data compiled from S&P Global Market Intelligence LLC. See important notes and disclosures at the end of this article
The table below shows the average NAV premium/discount of REITs of each market cap bucket. This data, much like the data for price/FFO, shows a strong, positive correlation between market cap and Price/NAV. The average large cap REIT (-16.62%) trades at a mid-teens discount to NAV. Mid cap REITs (-21.92%) trade at a little more than 3/4 of NAV, while small cap REITs (-32.55%) trade at around 2/3 of NAV. Micro caps on average trade well below half of their respective NAVs (-63.67%).
Source: Table by Simon Bowler of 2nd Market Capital, Data compiled from S&P Global Market Intelligence LLC. See important notes and disclosures at the end of this article
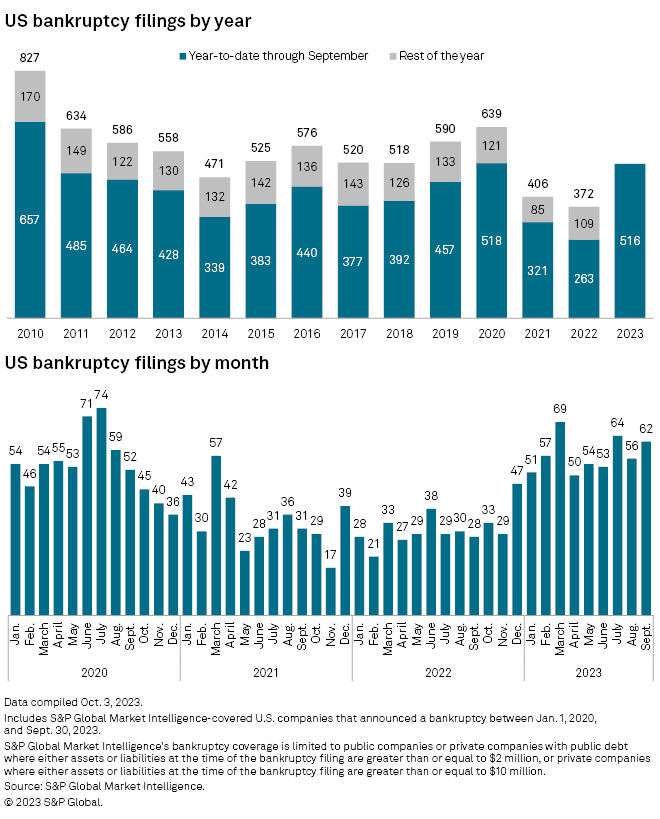
Bankruptcy filings in September increased month over month and remained elevated for the 10 th straight month. The elevated number of bankruptcies in the first 3 quarters of 2023 is on pace to match the government lockdown-driven bankruptcy spike in 2020. With “higher for longer” now becoming the consensus for the fed funds rate, optimism is quickly fading for rate cuts to occur in the near term. This increases the odds that low interest rate debt coming due in 2024 will need to be refinanced at much higher rates. For businesses with poor balance sheets, this raises the risk of a bankruptcy filing.
Source: S&P Global Market Intelligence
Hotel revenue per available room (RevPAR) growth has significantly decelerated during 2023 and occupancy has begun to trend lower than last year. Average daily rate (ADR) growth remains slightly positive year over year.
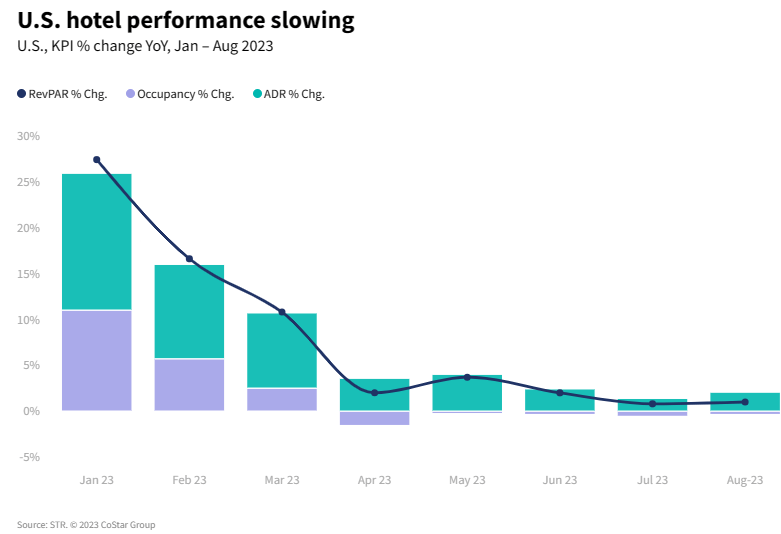
However, the hotel industry is losing the battle with inflation as it contends with rapidly rising labor costs (+4.9% YoY in August) while ADR growth (+1.8%) fails to keep up with CPI growth (+3.7%).
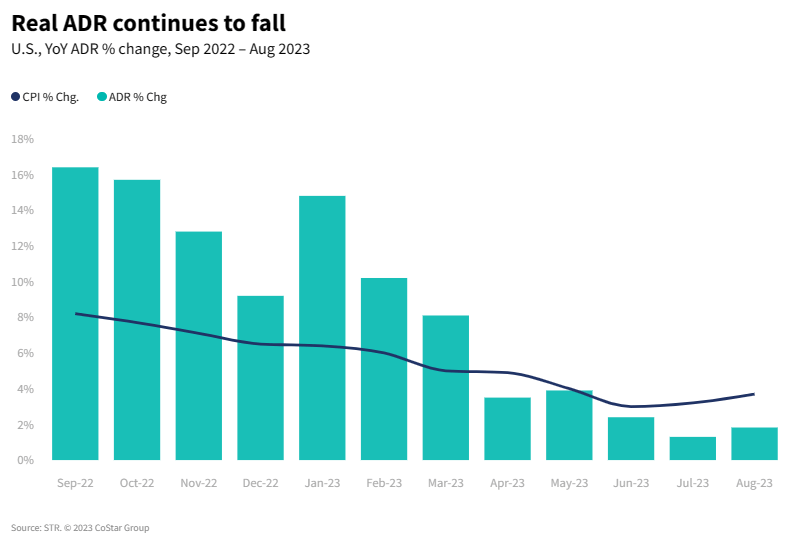
ADR growth turned negative for midscale chains in July, whereas Luxury hotel chain ADR growth has remained negative throughout 2023.
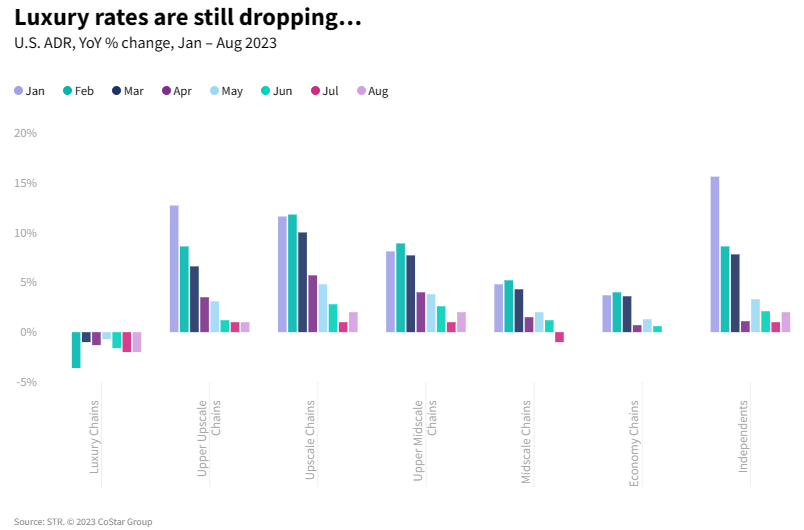
The negative impact of decelerating ADR is further magnified by falling occupancy rates (-0.3% YoY in August). Midscale, Independent and especially Economy chains have endured declining demand in each of the past several months. This pain is not equally felt across the hotel sector, however, as Luxury, Upper Upscale and Upscale chains are all continuing to see strong demand growth.
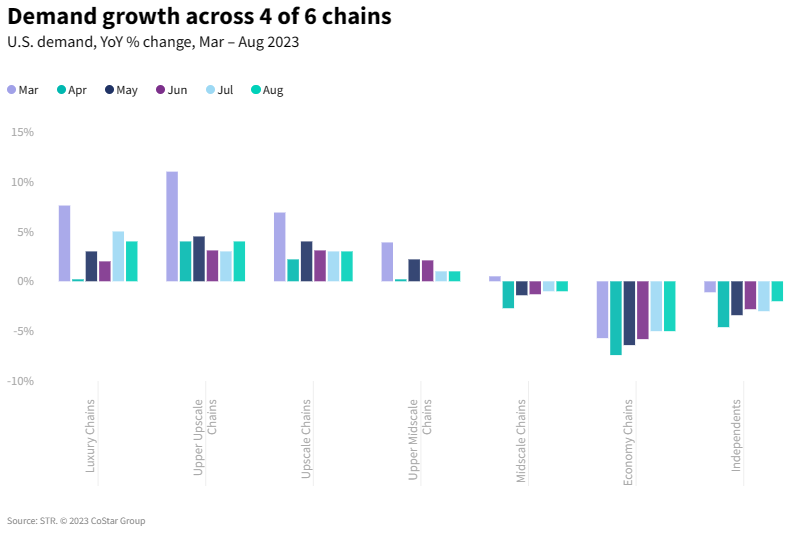
Before considering investment in hotel REITs, it is very important to dive deep into the portfolio composition of each REIT in order to successfully identify which are well positioned to benefit from positive trends that exist within the sector, and which are likely to experience further deceleration of fundamentals. In this challenging economic environment, there is elevated opportunity for active managers to outperform REIT ETFs by capitalizing on widening fundamental differences between and within property types.
For further details see:
The State Of REITs: October 2023 Edition