URNM - The Year Of The Dragon
2024-01-17 15:08:21 ET
Summary
- The Santa Claus rally in 2023 benefited high beta assets, particularly US High Yield CCCs and US Treasuries.
- The performance of US Investment Grade and US High Yield in the last quarter of 2023 was significant, with the long end of US Investment Grade seeing a spectacular rise.
- Chinese equities have seen significant outflows, but there may be opportunities in the low valuations of Chinese TECH, particularly Alibaba.
"The age of chivalry is past. Bores have succeeded to dragons." - Charles Dickens
Watching with interest the mesmerizing Santa Claus rally, from TECH to US High Yield CCCs as well US Treasuries thanks to "positive correlations", when it came to choosing our title post analogy and in the continuation of our very first post of the year 2023 relating to the Chinese Zodiac, we decided to go for "The Year of the Dragon". It is not only the only mythical creature of all the animals in the Chinese Zodiac but, it represents unprecedented opportunities, strength, and health. 2024 marks the start of the year of the Wood Dragon on February 10. Being a movie buff, our title analogy is yet another " double entendre " given it is also a reference to 1985 movie thriller (controversial for some) by Michael Cimino starring Mickey Rourke. In this movie, the most decorated police captain Stanley White played by Rourke makes it a personal mission to crack down on Chinese organized crime. Given the continuous tensions between China and the United States, and current "low valuations" of the Chinese markets relative to the United States, we thought it would be interesting. On a side note and as a historical fact which has been largely ignored, Chinese were excluded from American citizenship up until 1943. Chinese individuals could not bring their wives to America. The Chinese Exclusion Act was the first and only major U.S. law ever implemented to prevent all members of a specific national group from immigrating to the United States. In 1943, the Exclusion Act of 1882 was finally swept away due to pressures from wartime labor shortages and popular sentiment via the Magnuson Act and only allowed 105 Chinese immigrants per year. However, in many states, Chinese Americans (mostly immigrants but sometimes U.S. citizens) were denied property-ownership rights either by law or de facto until the Magnuson Act itself was fully repealed in 1965.
In this conversation we want to look at the performance of various markets in 2023, the recent weakness seen in early 2024 and what it entails for what promises to be a volatile year in the current complicated geopolitical context with numerous elections (40) taking place in various parts of the world in 2024.
Wishing you all the very best for 2024. May the Year of the Dragon provide you with opportunities, strength, and health.
• Closing on the year of the Rabbit
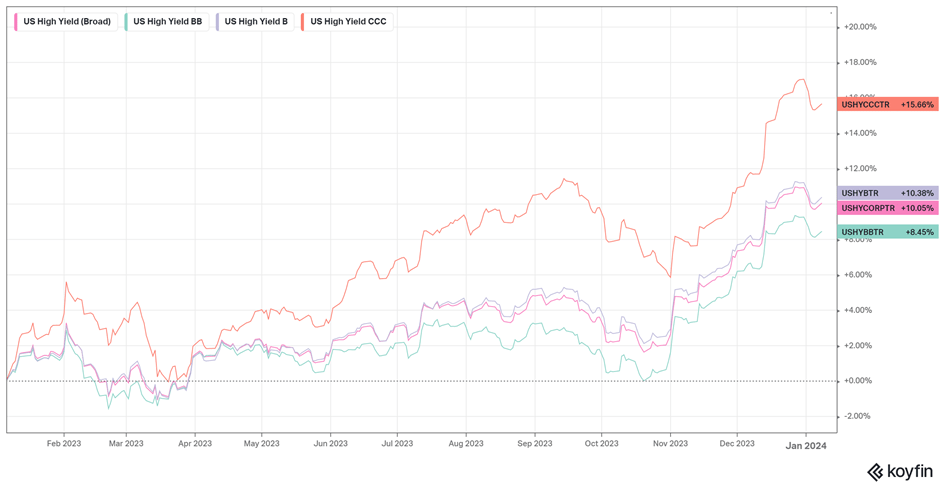
Thanks to the Fed pivot narrative, the last quarter of 2023 was a boon for "high beta" in general and US High Yield in particular. CCCs lead the race and closed 2023 with a Total return performance of 17.40% CAGR, versus 9.43% CAGR for BBs (one year chart below):
US High Yield 1 year chart (Macronomics - Koyfin)
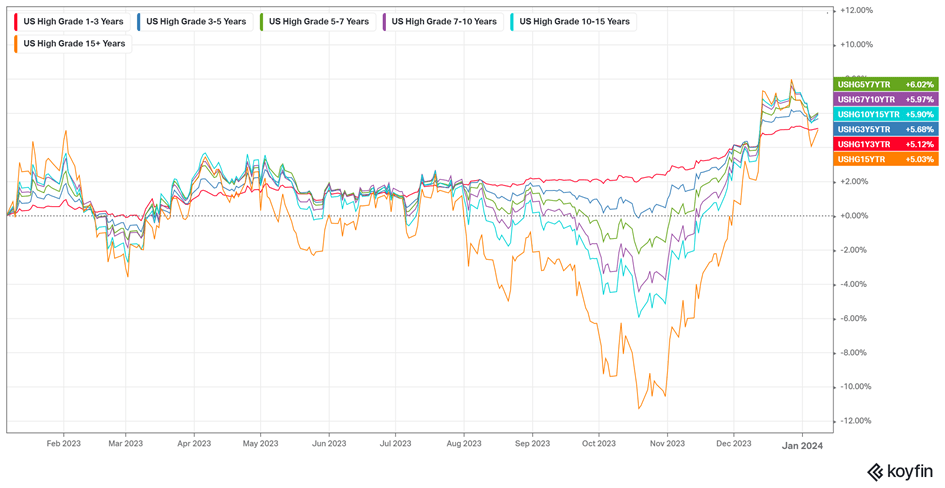
The most spectacular move during the course of the last quarter of 2023 was in the long end of US Investment Grade. The performance has been spectacular in the long end, no real surprise there given the fall in yields in the long end of the US Yield curve on the Fed Pivot narrative hopes. US High Grade 15 years+ bucket rose from a low point of -14.15% CAGR on October 19 2023 to end up the year at +6.89% CAGR ! The least volatile duration bucket throughout 2023 has been the 1-3 years bucket as per our chart (1 year chart below):
US Investment Grade 1 year (Macronomics - Koyfin)
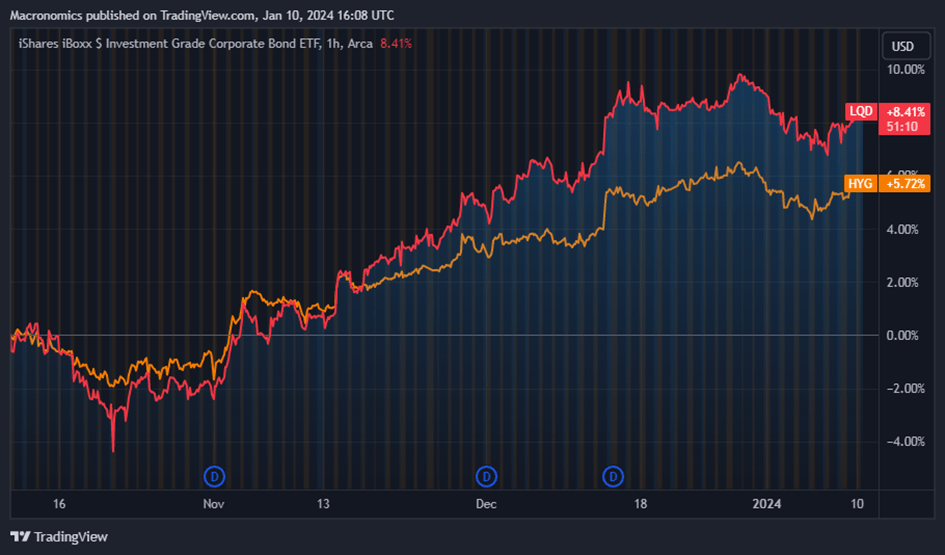
In three months the performance of US Investment Grade ETF LQD versus US High Yield ETF HYG has been significant in conjunction with the long end of the US Yield curve and the US 10-year yield. A case of Make Duration Great Again (MDGA)? We wonder:
ETF LQD vs ETF HYG (Macronomics - TradingView)
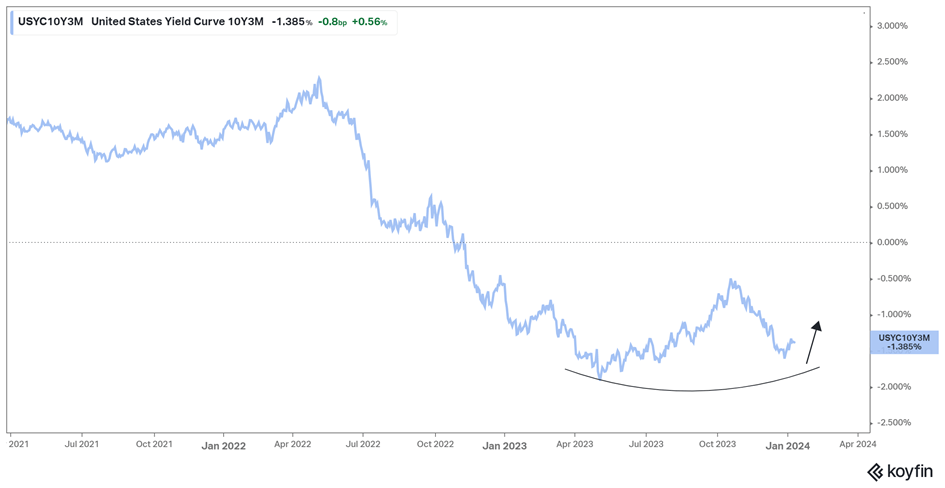
Interestingly the rally from the bottom for the US Investment Grade around October 19 saw another flattening of the US Yield curve as seen in the below US Yield Curve chart between the 10-year point versus the 3-month:
US Yield curve 10 years point versus the 3 months (Macronomics - Koyfin)
Are we going to see another "risk-off" episode thanks to renewed steepening in 2024? This we think, will be depending on the trajectory of inflation in the second part of the year in 2024 and we will discuss more on this in our second bullet point.
Credit risk wise 5-year CDS spreads have significantly receded (3-month chart). Since our last conversation US High Yield CDS gauge is tighter by another 30 bps (324 bps now vs 359 bps). European High Yield as well is improving:
Global CDS 3 months chart (Macronomics - Datagrapple.com)
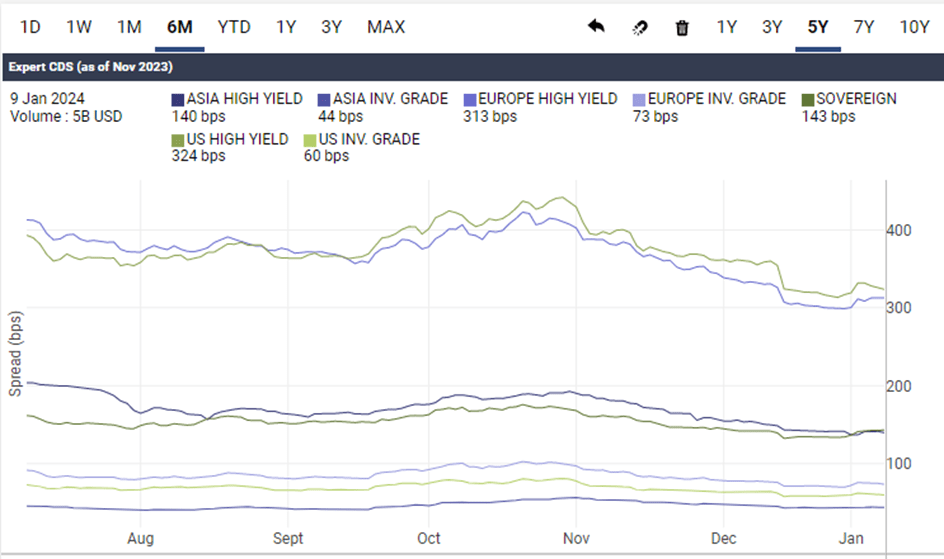
If indeed there is there is no materialization of the US economy "soft landing" much vaunted narrative in 2024, then we think that credit spreads are therefore too tight in US High Yield. We therefore continue to think, as per our last conversation, that in 2024 we should see an outperformance of US Investment Grade relative to US High Yield and default rates should start in that instance to creep higher but, so far credit is well behaving.
As you know by now, we have been tracking the Japanese yen depreciation in synch with the rise in US Treasury 10-year yields (6-month chart):
USTs 10 years vs USD/JPY 6 months (Macronomics - TradingView)
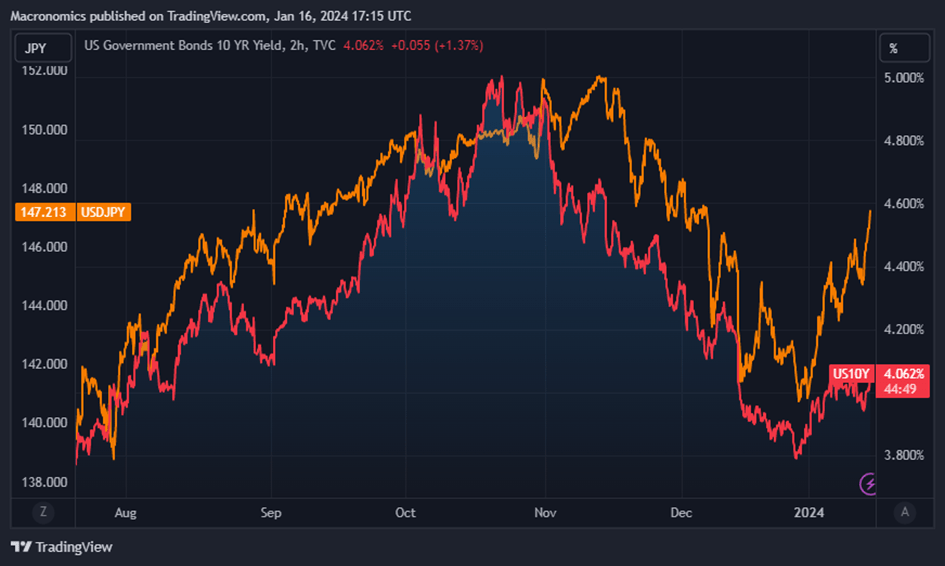
In our last conversation we indicated that a strengthening of the Japanese yen was on the cards. We did as well pointed-out that we believed that we would see further strengthening of the Japanese currency in 2024. Yet, since the beginning of the year, on the contrary we have seen more weakness in both the Japanese Yen as well as in the US 10-year yields on the back of renewed "apparent" strength coming out from the most recent Nonfarm payrolls print.
Given the US Fiscal trajectory is yet to be meaningfully addressed and with huge supply in 2024, we also tend to agree with Bill Gross that the 10 year is currently overvalued:
Key pivot points in 2023 (Graph source Bloomberg - X/Twitter)
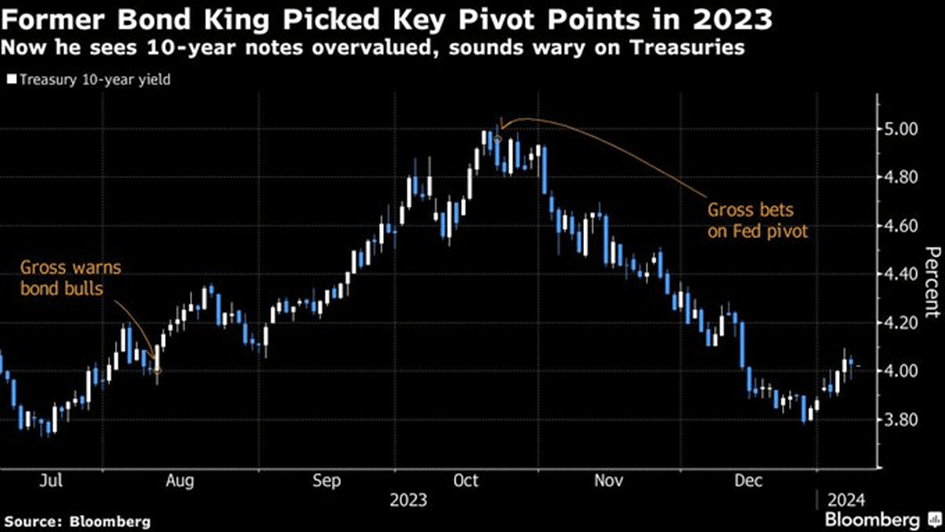
Bill Gross the former "Bond King" has been prescient in his "Fed pivot" call in October 2023. We also think that market pundits are probably showing a sign of "optimism bias" when it comes to the amount of rate cuts coming in 2024:
Swaps add to pricing of March rate cut (Bloomberg - X/Twitter)
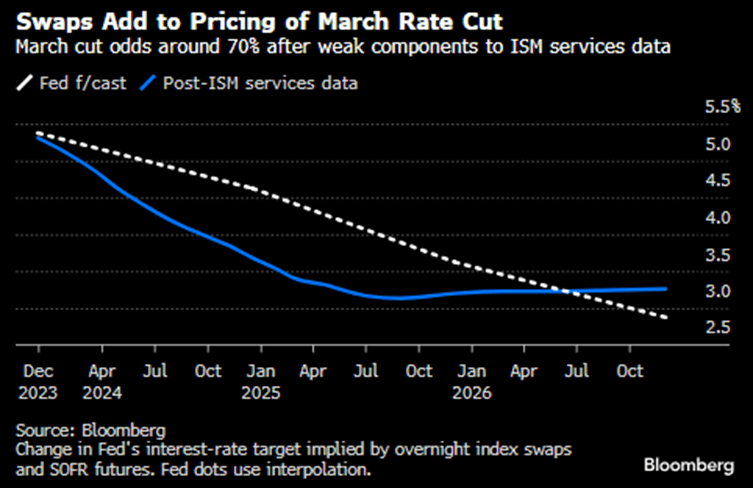
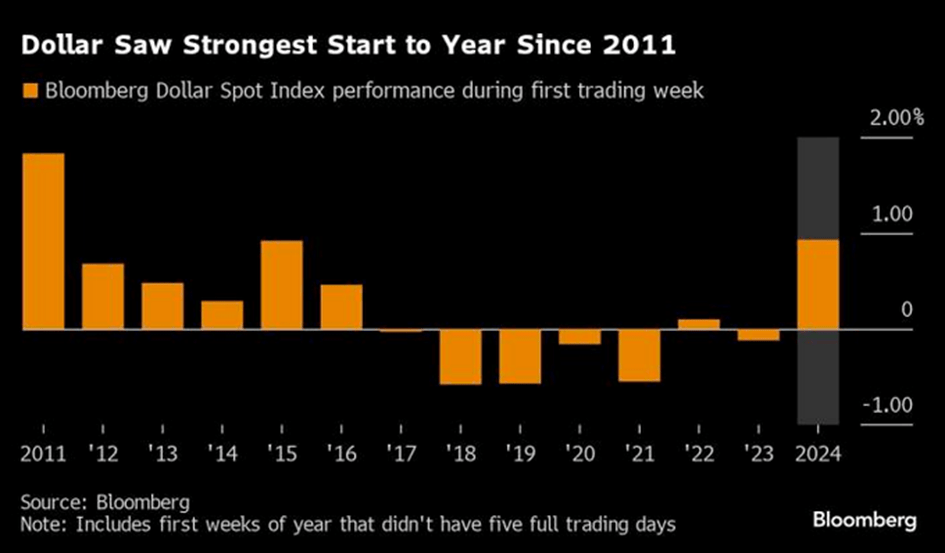
So far in 2024, the rise in US Treasury Notes yield has led to a weaker tone in gold prices (Gibson paradox) in conjunction with a strong start for the US Dollar:
Dollar saw strongest start to year since 2011 (Bloomberg - X/Twitter)
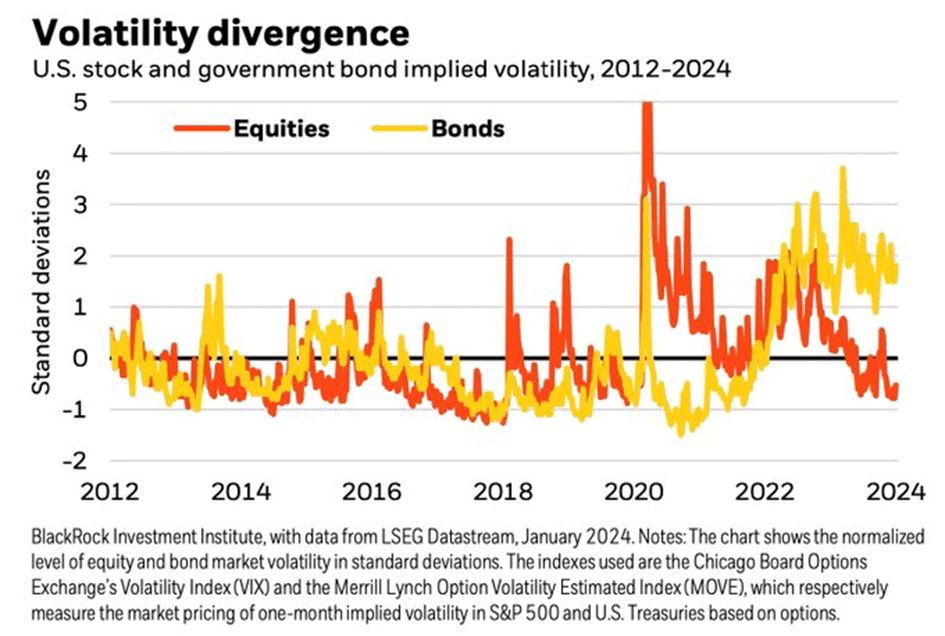
The continuing issue with positive correlations as seen in early 2024 with weaker bonds and equity prices in the early days shows that bond volatility remains elevated relative to equity volatility:
Volatility divergence (Graph source Nikolay Kolarov, CFA - BlackRock - X/Twitter)
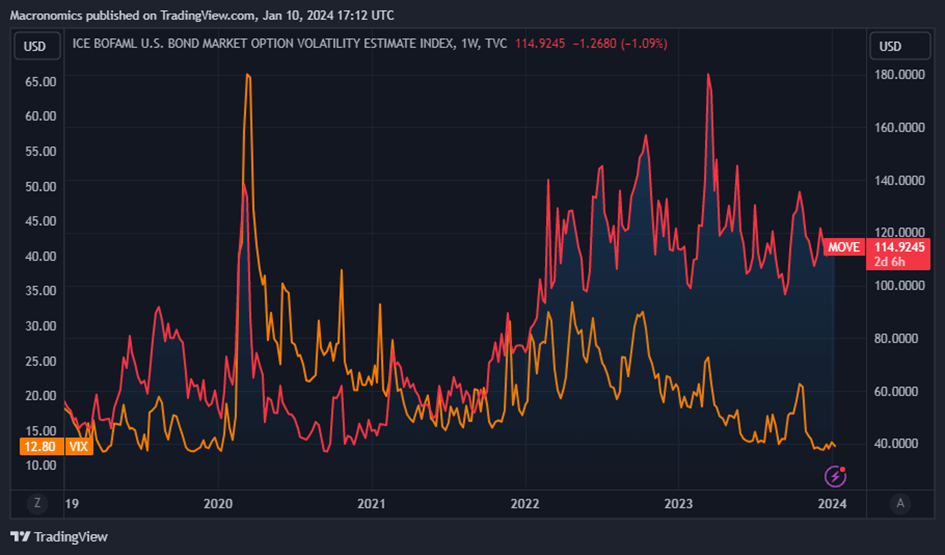
What matters in 2023, still matters in 2024, monitoring "bond volatility" is once again paramount. The MOVE index matters more than the VIX index, particularly in a "positive correlation" regime (MOVE index vs VIX index, 5-year chart):
MOVE Index vs VIX Index (Macronpics - TradingView)
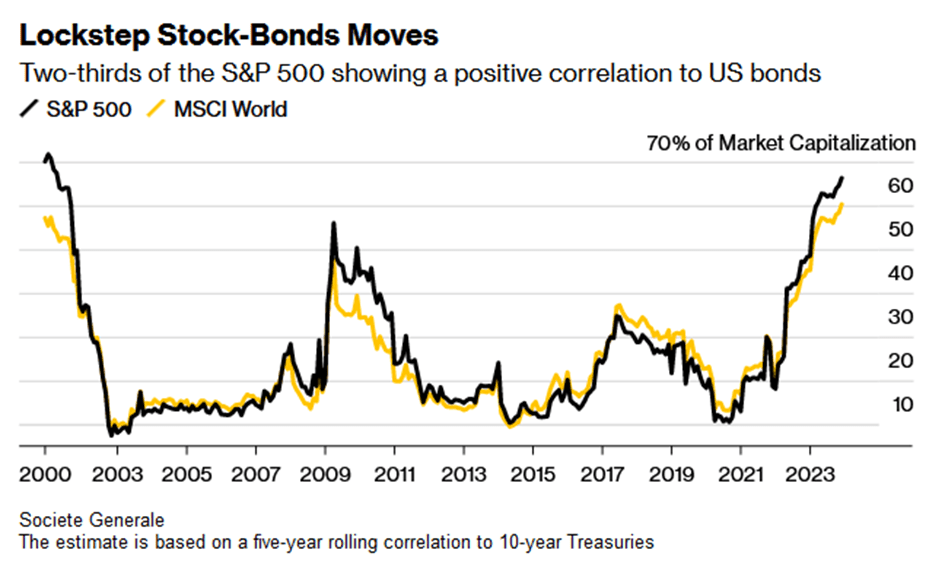
We mentioned in our introduction the return of "positive correlations". As such in recent weakness events we noticed that both US bonds and equities weakened in similar fashion. Sure, last quarter marked a spectacular return of the 60/40 portfolio, but our views remains that 2024 will remain very volatile in the fixed income space given that bond volatility remains elevated:
Lockstep Stock-Bonds Moves (Bloomberg - X/Twitter)
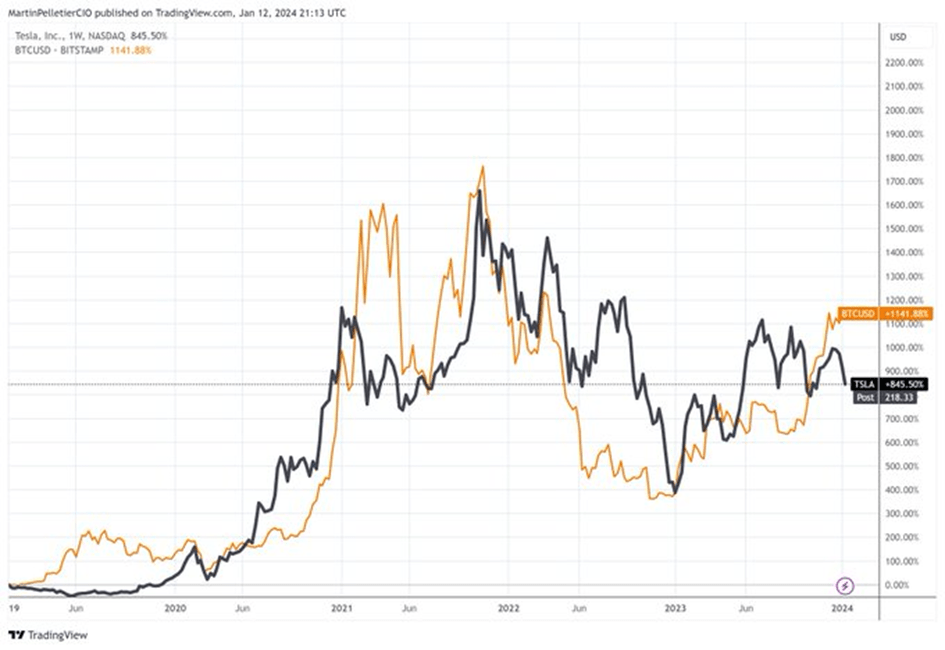
Talking about correlations, we have as well highlighted that we viewed Bitcoin as a proxy liquidity indicator back in our October conversation " Springtime of Nations ". As we pointed out in our conversation Bitcoin and Nasdaq are high beta and therefore moving somewhat in "synch". As shown in the below chart from Martin Pelletier displaying Tesla versus Bitcoin:
TESLA vs Bitcoin (Martin Pelletier - TradingView - X-Twitter)
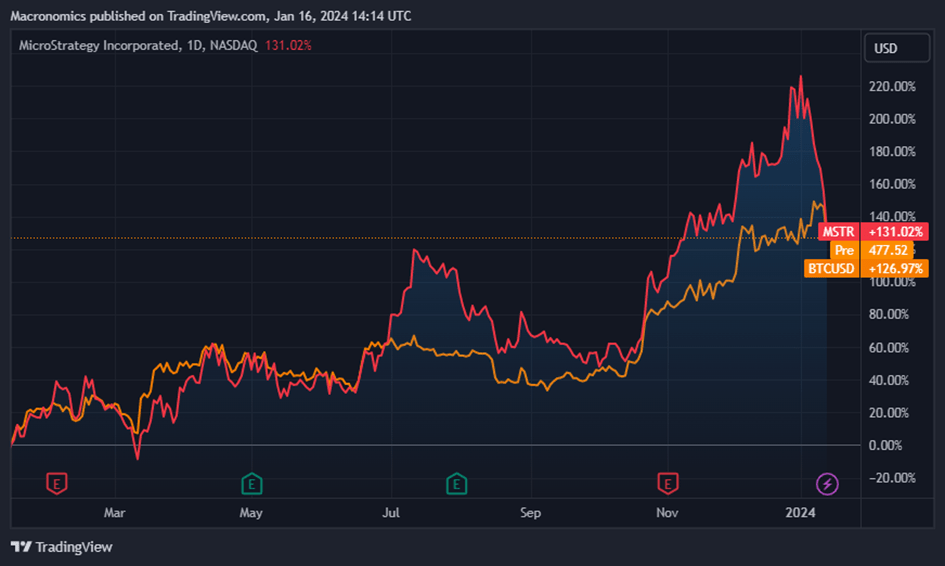
In Similar fashion, we have followed MicroStrategy ( MSTR ) being a "derivative" of Bitcoin and hence more "volatile" (1-year chart below):
MSTR vs Bitcoin 1 year (Macronomics - TradingView)
What we find of interest is that MSTR CEO Michael Saylor has started "cashing out" on MSTR coincidently with the SEC's approval of Bitcoin ETFs:
"The planned sales of up to 5,000 shares will occur each day between January 2, 2024 and April 26, 2024 under the plan," the spokesperson said in a statement. The plan is to sell as much as 400,000 shares in that period."
MSTR's holdings are worth around $8 billion. With "liquidity" in the asset being added with the ETFs we are wondering if indeed the "insiders" are realizing that the "premium" MSTR boasted over Bitcoin is now gone and as such, well, no more "arbitrage" and no more using MSTR as a proxy "short" or "long" on Bitcoin but we ramble again though it is the first time the CEO has sold shares in nearly 12 years, just something to keep on the radar à la 2000.
• The Year of the Dragon?
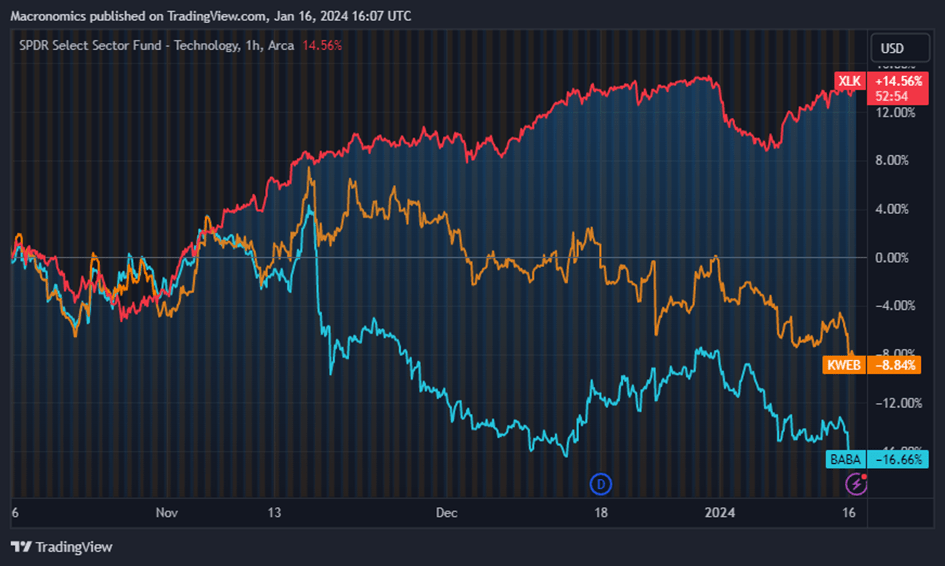
In our previous conversation we confided that we were more and more compelled by the low valuation of Chinese TECH in general (sure, down around 7% YTD we know) and Alibaba in particular. Obviously, US TECH has benefited more from the "Fed pivot" narrative last quarter (3-month chart):
ETF XLK vs ETF KWEB vs Alibaba (Macronomics - TradingView)
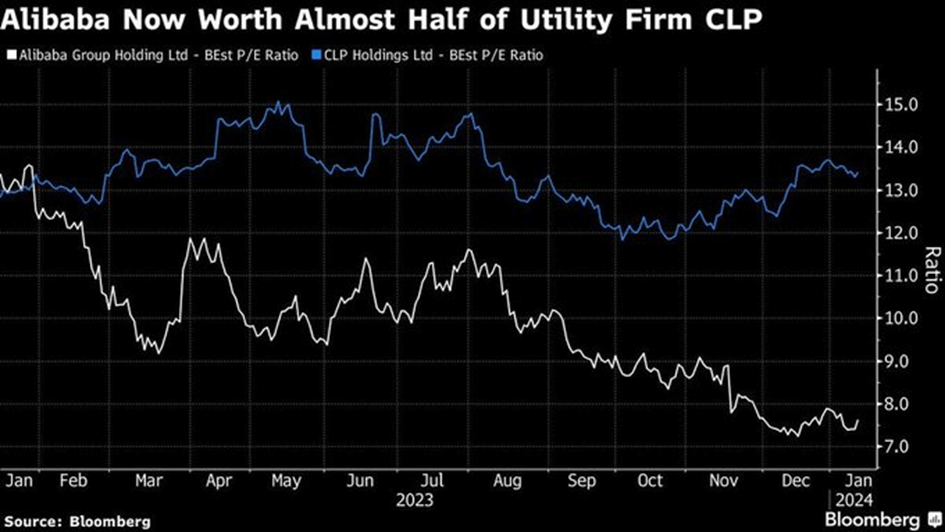
Current Alibaba valuation implies 1.6x F24E sales, 8x EBITDA and 14x PE, a discount to global large-cap tech peers on country risk and lower growth perspective. A target price of $120 implies 8x EBITDA, meaning we are trading below 5x EBITDA now. Alibaba trades at 7.6 times forward earnings :
Alibaba vs CLP (Bloomberg - X/Twitter)
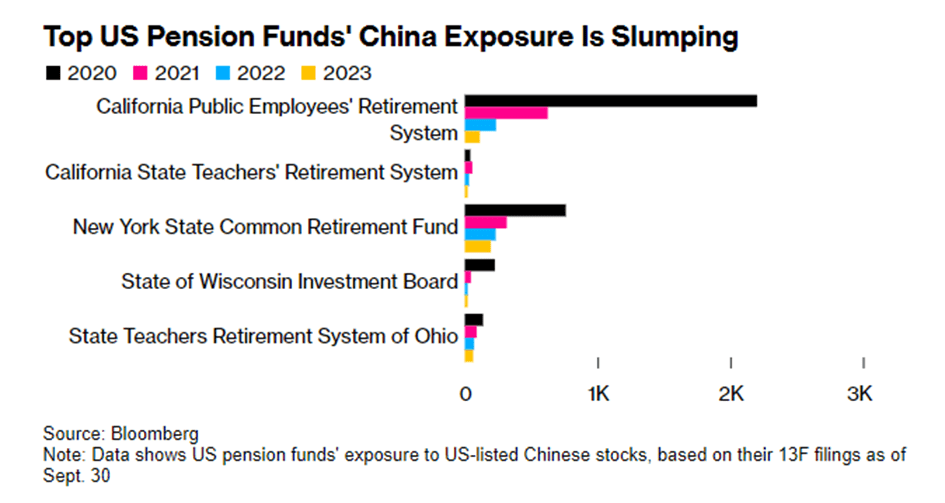
Many financial pundits have indeed capitulated on Chinese equities. At the moment confidence is gone and flows have indeed been significant out of Chinese equities overall:
US Pension funds China exposure (Bloomberg - X/Twitter)
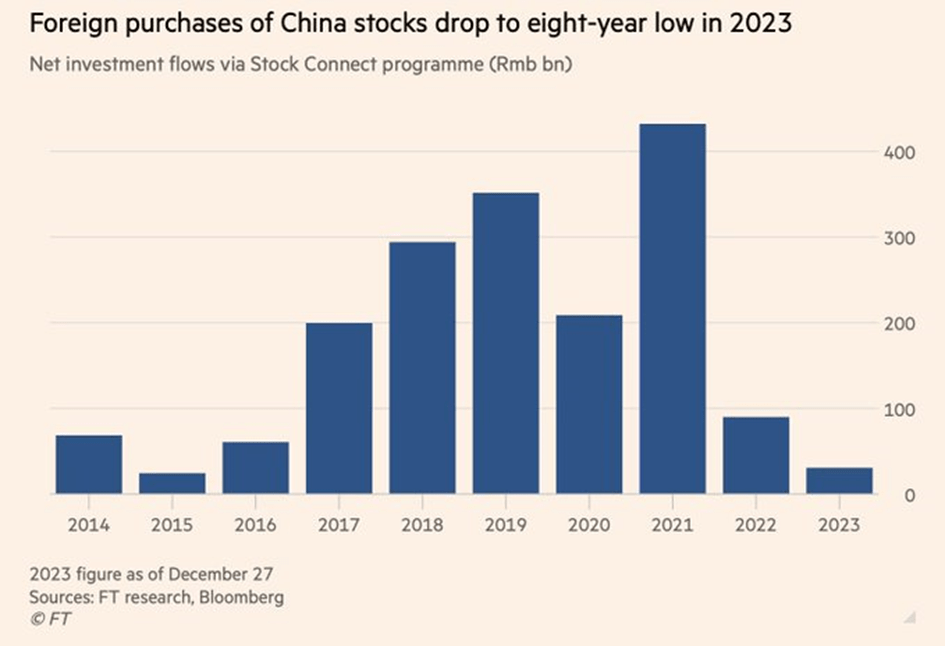
Foreign purchases of China stocks have fallen to an eight-year low, but now that Taiwan elections have happened and there is some sort of status-quo, one might wonder if indeed flow wise we have seen the worst in 2023:
Foreign purchases of China stocks (Financial Times - X/Twitter)
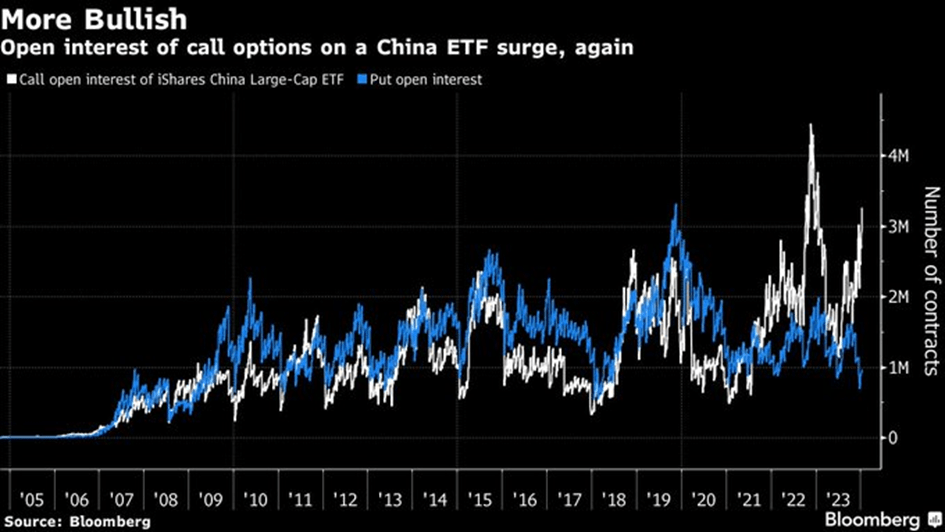
Recently there have been more open interest on China as we move towards the start of the Year of The Dragon (10th of February):
Open interest on call options on China ETF (Bloomberg - X/Twitter)
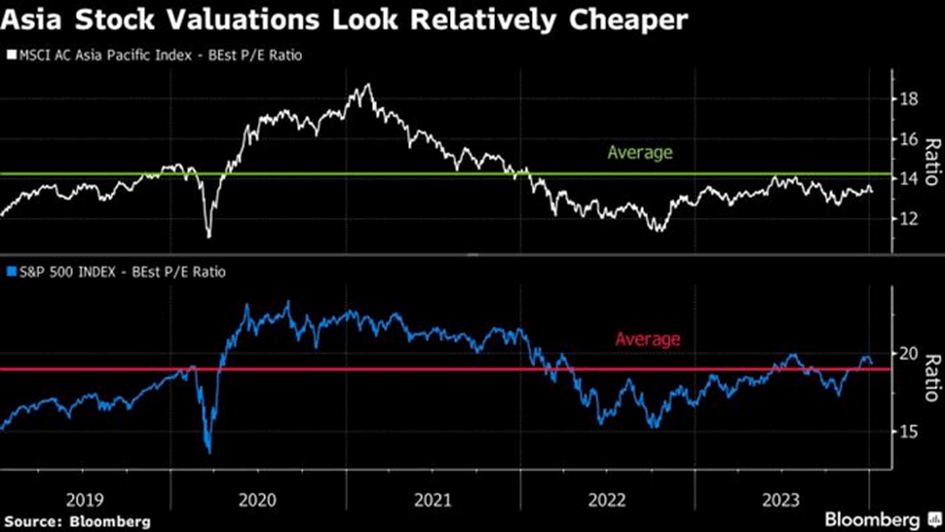
And Asia stock valuations continue to be look cheaper than in the US:
Asia stock valuations look relatively cheaper (Bloomberg - X/Twitter)
Us being "contrarian" at play, we are still ok in 2024 going against the "negative narrative" (disclosure we are long Alibaba).
In our last musing we also told you that we have been riding the Uranium play via ETF URNM and via Kazatomprom because we like long-term value plays (hence our "cheap" December 2020 call on coal laggards BTU and ARLP at the time).
As such we see these deep "unloved value" positions as part of the long-term plays we like to put on:
Uranium Price Return Index since 2015 (Macronomics - Eikon Refinitiv)
Uranium is still a very compelling trade in 2024 regardless of the "stellar" performance of 2023 for "scarcity reasons" and yes we have been riding this trade earlier than 2023 if you ask:
Uranium soaring demand (Bloomberg - X/Twitter)
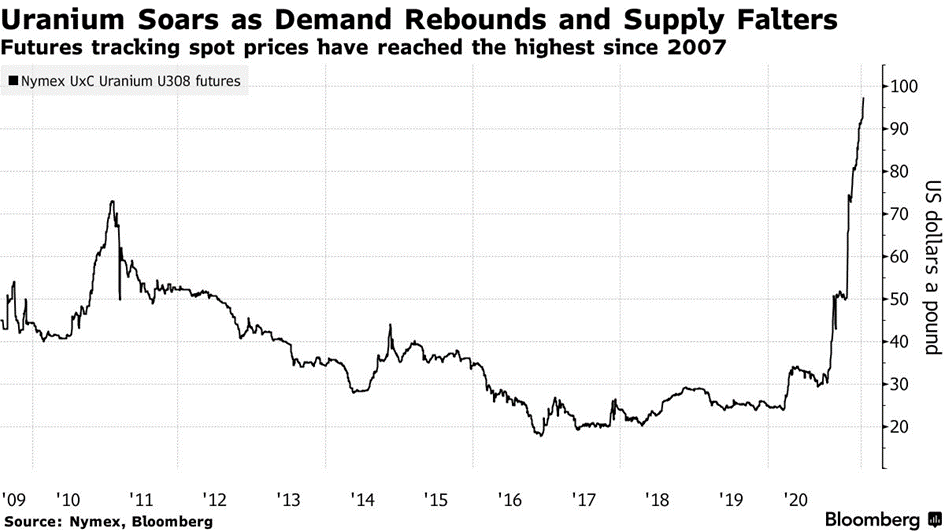
"Kazatomprom, the world's biggest uranium miner, warns that it's likely to fall short of its production targets over the next two years, adding another risk to supply as demand for the nuclear fuel rebounds" - Bloomberg
On the subject of "scarcity" we touched on the subject in our conversation " The Scarcity Principle " in November 2022. ETF URNM 4-year chart below:
URNM ETF Trade Close (Macronomics - Eikon Refinitv)
Whereas it is never easy to identify a "convex" trade but when you do, if you have the "macro" guts, you need to "pile in" in Druckenmiller fashion. For instance, Druckenmiller is not a fan of asset diversification. He has recommended focusing on a single type of asset and closely monitoring it. According to him, putting all of your eggs in one basket is fine as long as you keep a close eye on the basket. "Overconcentrating" on certain trades, can result in massive gains within certain trading periods. Identifying the right opportunities of course is the most difficult exercise and "convex" trades do not come very often.
We posited as well in our most recent conversation that continued falling real yields should be a boon in supporting gold prices in true Gibson paradox fashion. We continue to view positively the "barbaric relic" in 2024, particularly in a very eventful geopolitical and electoral environment.
Recently we had an interesting conversation with Andre Chelhot, CFA on "debt".
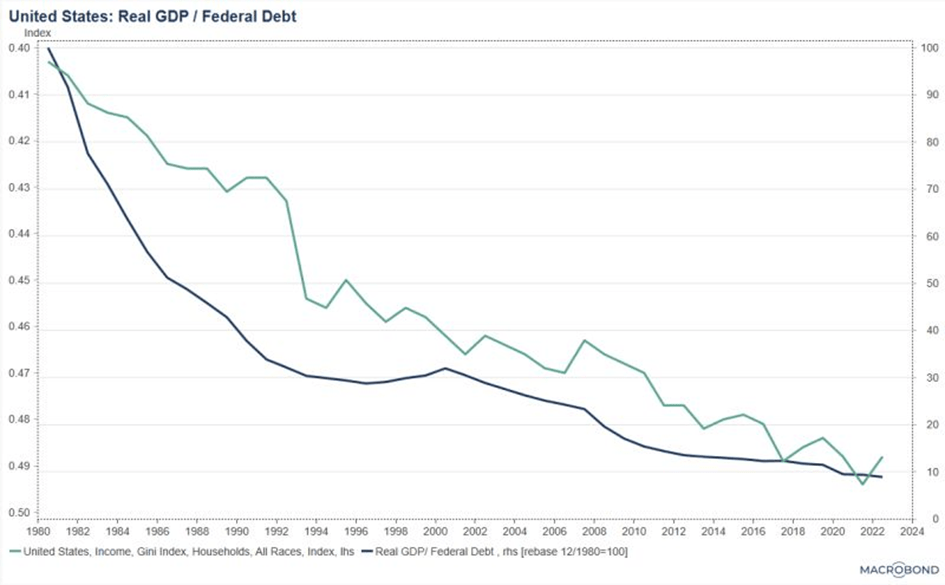
I had a very interesting debate today about the benefits of debt with a fellow very talented economist. Lots of market participants are claiming nowadays that debt creates wealth, they don't however specify what kind of wealth it creates. Is it real wealth or financial paper wealth? The below chart depicts the ratio of real GDP to Government Federal debt rebased at 100 in 1980. I used real GDP and not nominal GDP because it measures the US economy's REAL production be it in goods or services. This descending line tells you that every dollar of debt in 2023 creates only 10% of REAL production compared to what every dollar of debt used to produce in 1980. I also added to that chart the Gini coefficient that measures income and wealth inequality (inverted scale). The two lines move together with a bit of lag.
A further rise in government debt will 1) yield very little real production even if it creates more paper wealth and is concentrated in very few hands and 2) lead to a further deterioration in inequality. The last time this phenomenon took place was in the late 1920s and we all know what took place in 1929.
US Real GDP / Federal Debt (Andre Chelhot CFA - LinkedIn)
We added our comments below Andre's Linkedin post for those of you who are more "curious". We would just like to point out what we said about debt in 2013 in one of our musings:
"If a country has 100% debt to GDP, it means that this country has roughly bought growth at a 2% rate for 50 years. Last time France's budget was balanced was in 1974 and debt to GDP was around 20% in 1981.
Debt is like cholesterol, there is bad cholesterol that can't dissolve in the blood (Low-density lipoprotein) and good cholesterol (High-density lipoprotein).
When too much LDL (bad cholesterol) circulates in the blood, it can slowly build up in the inner walls of the arteries that feed the heart and brain. This condition is known as atherosclerosis, and heart attack or stroke can result.
In 2008, we came very close to a global heart failure. The world had a stroke.
But what led to the bad cholesterol in the first place? Bad credit/debt. So betting on a government making the right choice of allocation with "fiscal stimulus" is wishful thinking, we think.
Government policies favoring housing bubbles have led to mis-allocation of credit/debt (bad cholesterol), like in the US, the UK, Hungary, Ireland and Spain. Bad cholesterol (the "credit stroke) has led to "Balance Sheet Recession".
Government policies favoring infrastructure investment is good cholesterol:
One can posit that President Eisenhower when he signed the 1956 bill that authorized the Interstate Highway System in 1956 was of great benefit to the US. In his parting speech of the White House on the 17th of January 1961, he warned about the risk of bad cholesterol (military complex) but that's another story..." - Macronomics 2013
As a reminder this what Sir James Goldsmith said on the fallacy of Balance accounting:
"The idea that accounts must balance, and that inflows must ultimately match outflows, is an accountant's idea.
But there is a fundamental misunderstanding here. If you make a loss, perhaps because you own a business that is trading unprofitably or because you have made a bad investment, you will not get rid of the loss by borrowing the amount needed to pay for it. You will have avoided or postponed a personal liquidity crisis, but you will still be poorer by the amount of the loss. You will also have to pay interest on the loan.
Alternatively, you might sell your house and rent somewhere else to live. You will have used the proceeds of the sale to pay your debts, but you will remain poorer by the value of the house. And in future, you will have to pay rent.
When the Asian countries, as mentioned by the European Commission, invest their 'excess cash' abroad, normally they do so by buying into businesses or by lending money. The latter normally takes the form either of buying government debt or of deposits, say in sterling or dollars, in the banking system. Now consider the position of the nations which, unlike the Asian countries, import more than they export and which, as a result, have a deficit as opposed to an excess of cash.
To finance their deficit, businesses or other assets are sold and debt is issued. This puts them in exactly the same position as an individual who sells his house or borrows money to cover his debts. Such a haemorrhage can last only a limited time before ending in bankruptcy." - Sir Jimmy Goldsmith
What is going to happen when Middle East countries and Asian countries will not invest their "excess cash abroad" by buying into US or European government debt? Could Russian Central banks asset seizure change the flows from West to East? Would Middle East or Asian countries be better off recycling with their trading partners in local currencies? We wonder.
"That men do not learn very much from the lessons of history is the most important of all the lessons of history." - Aldous Huxley
For further details see:
The Year Of The Dragon