AFRM - These 14%+ Sucker Yields Could Cut Dividend But There's A Better Way
2023-06-07 07:00:00 ET
Summary
- High-yield dividend stocks are appealing, but they carry high amounts of risk.
- I demonstrate multiple examples.
- We present our new strategy to achieve high yields and 76 trades to snipe at market open.
Written by Sam Kovacs
Introduction
Economic conditions are tough for everyone. Prices of real estate, food, utilities are up all over.
And investors who rely on their dividend income to fund expenses are finding themselves in between a rock and a hard place.
Sure, they can invest in high yielding stocks to get more income, which they need to live on. Unfortunately, as we will see, doing so carries a high risk, both for your income and the value of your capital.
Robert and I have made it our mission and focus to help individuals reach their income goals without having to take unfathomable amounts of risk. This is what we've been teaching and sharing at the Dividend Freedom Tribe for the past 30 months.
It's a (I'll say it myself) brilliant model. Investors focus on high quality dividend stocks, which they buy low, occasionally sell when too high, and get paid growing dividends to wait.
The problem is that it caters to investors that either have:
- ample resources, or
- ample time.
Unfortunately, a large number of individuals have neither. And the consequence of this is a declining standard of living for millions of Americans in retirement.
This is why we see annual household spending go from an average $60,000 for 45-54 year-olds, to $45K for 65-74 year-olds, to $34,000 for individuals 75 and older. Investors are not getting the returns they need on their nest egg, which, by the time they reach retirement, averages about $400,000.
Once we take out an average social security check of $21,000 per year, individuals are needing $24,000 after tax to get to that average $45K expenditure. That's a 6% yield on their $400K, after tax. If they can get 6% from their investments, their nest egg pays for the taxes and dwindles year by year.
Or they venture into high yield investing, focusing on investment vehicles which offer higher yields.
On the face of it, that would solve all their issues. If they can get 10% to 15% yields, that would provide $40K to $60k before taxes on top of their social security, which would mean they would be able to maintain a comfortable standard of living throughout retirement.
But high yields come at a price
Let's take the example of Global Net Lease ( GNL ), a triple net lease REIT with a shaky history.
Had you bought in the summer of 2018, when a couple of bullish reports were published on the stock, you would have bought at around $20, when the stock was paying $2.13 in dividends annually.
This would have initially been a nice 10.6% yield on your capital, until the first quarter of 2020 when the dividend was cut by 25%, reducing the yield on your original investment to 7.9%.
Still an amount sufficient to hack it.
And by June 2021, you would have had an opportunity to sell again just below your purchase price, and call it quits.
GNL DFT Chart (Dividend Freedom Tribe)
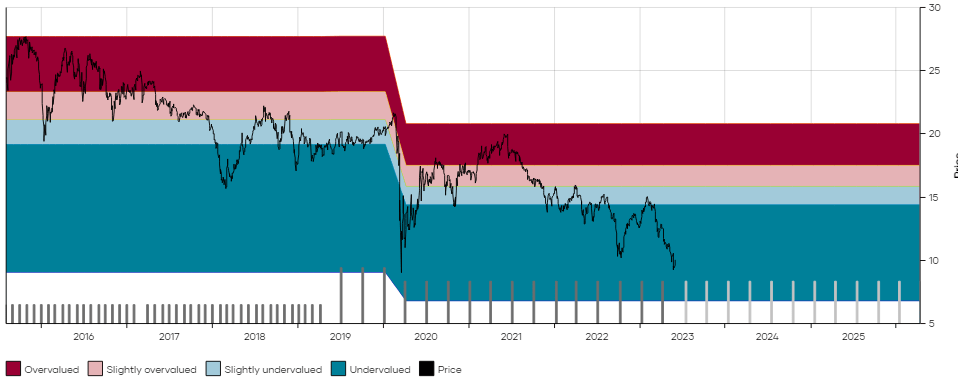
But if you didn't, that's where the trouble began.
Since then, the stock has been declining, to where it is now trading at $9.95. In 5 years of holding GNL, an investor would have achieved a 50% loss of capital, and a 25% cut in their annual income.
And there are fears that the worst might not be over. As GNL has been aggressively emitting new shares to finance growth, AFFO/share has been declining despite overall AFFO picking up. With debt maturities approaching, which will have to be rolled over at higher rates, the increase in costs is likely to hinder AFFO, forcing another cut.
We've always stayed away from GNL, and have the SA community to thank for that as most authors have been correctly bearish for years.
Of course, not all high yielding stocks are sucker yields.
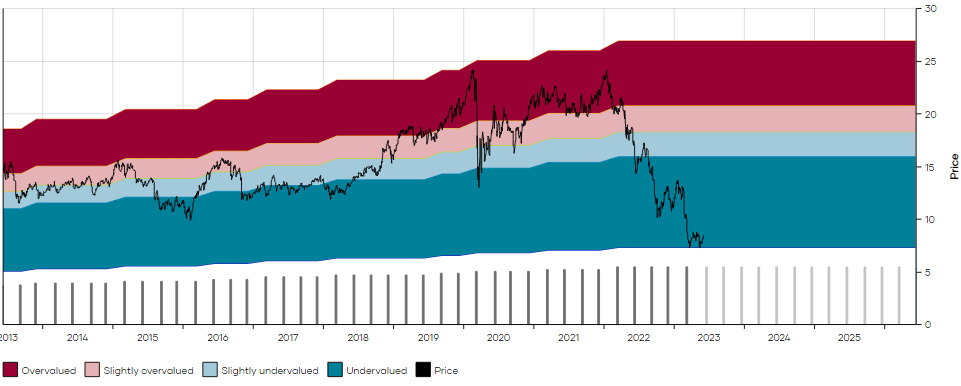
Our favorite high yield stock, Arbor Realty ( ABR ) is up 18% since we suggested buying it in March , after discarding a nonsensical short report which sent the stock down.
ABR DFT Chart (Dividend Freedom Tribe)
That being said, we also suggested investors buy in June 2022 at $16.
High yield investors who saw their position go down 30% from $16 to $11.5 might have told themselves "oh, not again".
And the volatility of ABR's stock price over the past 7 years talks tons to the emotional rollercoaster which high yield dividend investors must go through.
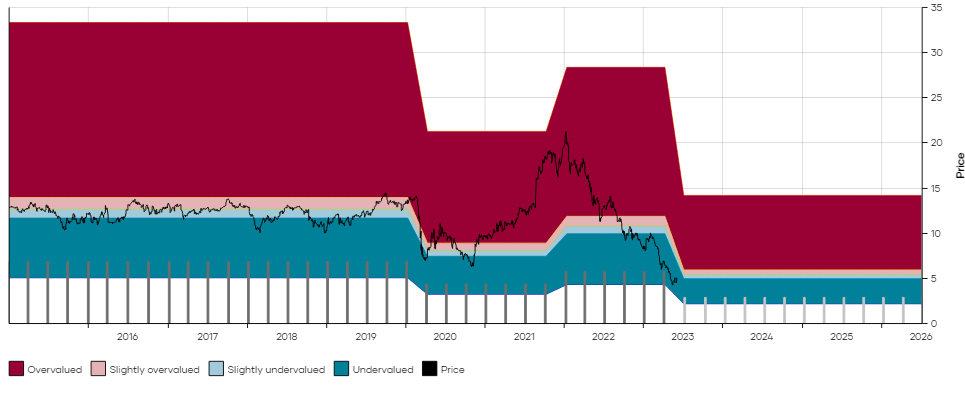
While I'm very confident in ABR's prospects, there is another high yield recommendation which I'm not so confident about: Medical Properties Trust ( MPW ).
We refrained from buying MPW between 2018 and 2022 as we viewed the stock as overpriced, but then a year ago, ended up catching a falling knife, suggesting investors initiate a small buy anywhere below $17.
This resulted in a 50% loss of capital so far...Ouch.
MPW DFT Chart (Dividend Freedom Tribe)
In February, we gave members of the Dividend Freedom Tribe, a big article, summarizing the analysis provided by all key SA authors on the stock, and then our take on the situation.
At the lower end of the range, MPW would pay 95% of its AFFO as a dividend. If you count with the higher end of the AFFO forecast, the payout could be as low as 83%.
The dividend has been around the 90% mark a couple of times since 2012.
Management didn't cut then. It was also a very different environment, marked by easy money, a supportive stock market, and growth in the business.
I'm inclined to say that management has the "ability" to keep the dividend.
But does it have the willingness to do so?
So far so good...
Nobody has a crystal ball with these things.
I believe it is possible that management will decide to cut its dividend, playing into the short-investors hands, and hoping the stock is so depressed the market won't care.
I'd say this is 30-35% likely.
The question will then be by how much will the dividend be cut.
A 20% dividend cut would bring the dividend back to a very healthy 76% payout ratio of the lowest AFFO projection.
This would be as low as the payout ratio would have been in the past decade.
It would also be the payout ratio which at our current yield on cost of 7.56% would bring the yield down to 6%.
This would be the maximum "acceptable" loss on the dividend.
I'd say that it is unlikely the dividend is cut by more than this as it would be a clear treason of investors.
The prospects of an increase in dividend are next to none. The prospects of a flat dividend, I'd say are about 2/3.
In the meantime, we're holding to our position in the High Yield portfolio, which is less than 1% of the portfolio.
This isn't an article about MPW, it's an article suggesting that investing in high yielding stocks is a tricky, volatile, and that the high income comes at a price.
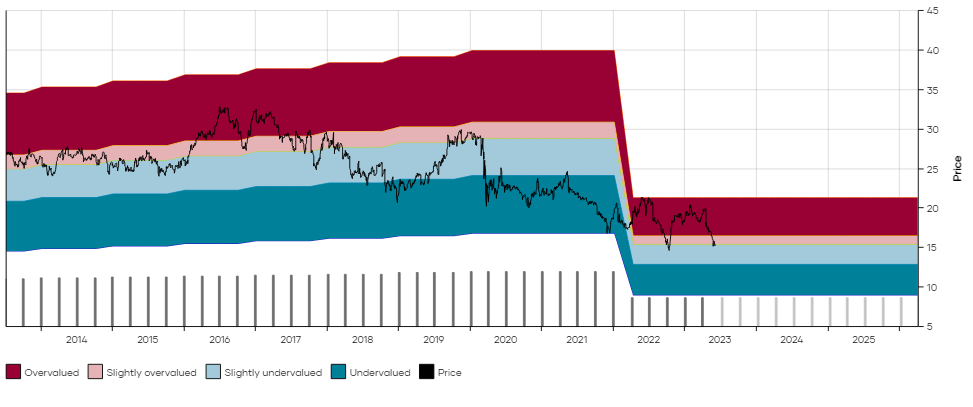
This year, City Office REIT ( CIO ) cut its dividend by 50%.
CIO DFT Chart (Dividend Freedom Tribe)
Last year, AT&T ( T ) cut its dividend by 60% due to corporate action making it necessary.
T DFT Chart (Dividend Freedom Tribe)
While high yield investing is possible, it is extremely difficult to reach sufficient diversification without including some stocks which will cut their dividend and give you a significant haircut to both your income and the value of your capital.
Do this often enough, and you're no better than you would have been with another strategy, or more likely, you'd be worse off.
But there has to be another way, right?
There is a better way
If you have ample time, and/or ample resources, we believe that the methodology we use at the Dividend Freedom Tribe is the way:
- Take account of your assets, saving power, and time to retirement.
- Use our tools to project the yield and dividend growth rates required to reach your target income in retirement.
- Buy high quality dividend stocks low, get paid to wait, and sell them high to increase your income.
But if you need to generate high levels of yield, let's say 10-15%, you cannot achieve this safely by investing in equities or in preferred equities.
As we have seen above, the risk to your capital is just too high.
The better way is to sell cash secured puts to generate income.
We have been developing a framework which leverages our technical expertise for investors to safely generate high yields by selling put options.
This is how we will approach selling put options:
- You sell someone the right to sell you the stock at a predetermined price (below the current price) by a predetermined date.
- You set aside the necessary cash to purchase the stock in case of assignment.
- You collect a premium today.
- If the stock does not dip below the price, you keep the premium and repeat.
- If the stock dips below the price, you’ll repurchase the option at a higher price before being assigned and take a minor loss.
You've likely heard of this strategy before, but we have enhanced it in many ways.
First, we sift through over 100,000 options every day to identify those with high annual yields.
We cast a rather wide net, looking at all of the 2,000 largest US listed stocks. This gives us a list of stocks with a cut off of market cap around $1bn.
We calculate an annualized yield by looking at the premium we could get and projecting that to an annual amount of income.
For example, if we see an option with a bid of $1 on a $100 strike price, with one month to expiration, we can project that over the course of the year, we could sell that option 12 times, getting $12 or 12% of the $100 we would have to set aside to secure the put.
We use our high end servers to make these 100s of thousands of computations daily. This creates a list of opportunities which can provide high yield.
But for this strategy to be effective, we need to minimize assignment. So we need to apply various filters to find the stocks which are least likely to dip below the strike price between now and expiration.
Here we employ a variety of strategies which will be clearly explained in future articles by the Options By Kovacs account on Seeking Alpha, but include:
- avoiding overlap with earnings announcements.
- weeding out the stocks with the worst momentum indicators.
- giving a sufficient margin of safety.
- reducing risk by using our proprietary assignment risk ratio, as well as implied volatility as per the Black & Scholes model.
We then employ advanced strategies like buying back the options before expiration to boost our yield and/or minimize our losses on the fraction of trades that go against our way.
On any given day, we identify a list of 30 to 120 option trades which provide yields between 10% and 20%. While there are opportunities even above this level of yield, we have found that they increased risk unnecessarily.
So as the market opens today, these are the trades which we are seeking to execute. Remember that prices (and therefore yields) might move in or out of your favor at market open.
| Ticker |
| Underlying last price |
| Contract Name |
| Exp Date |
| Last Price |
| Strike |
| DFT Buy Below |
| Bid |
| Ask |
| Bid/Ask spread |
| Days before exp |
| In the money |
| Margin Of Safety |
| Yield |
| Assignment risk |
| Std Dev Safety |
| Implied Volatility |
| Volume |
| Next Earnings Date |
| Axcelis Technologies ( ACLS ) |
| 162.83 |
| ACLS230616P00135000 |
| 6/16/2023 |
| 1 |
| 135 |
| 0.5 |
| 1.2 |
| 82.352941 |
| 9 |
| 17.091445 |
| 15.02057613 |
| 7.29 |
| 8.197174276 |
| 84.56 |
| 0 |
| 8/2/2023 |
| Axcelis Technologies ( ACLS ) |
| 162.83 |
| ACLS230616P00130000 |
| 6/16/2023 |
| 0.57 |
| 130 |
| 0.4 |
| 0.7 |
| 54.545455 |
| 9 |
| 20.162132 |
| 12.47863248 |
| 0 |
| 9.206107681 |
| 88.82 |
| 3 |
| 8/2/2023 |
| Affirm Holdings ( AFRM ) |
| 15.55 |
| AFRM230714P00011000 |
| 7/14/2023 |
| 0.28 |
| 11 |
| 0.22 |
| 0.25 |
| 12.765957 |
| 37 |
| 29.26045 |
| 19.72972973 |
| 0 |
| 2.955969142 |
| 97.65 |
| 0 |
| 8/24/2023 |
| Affirm Holdings ( AFRM ) |
| 15.55 |
| AFRM230630P00011500 |
| 6/30/2023 |
| 0.14 |
| 11.5 |
| 0.13 |
| 0.16 |
| 20.689655 |
| 23 |
| 26.045016 |
| 17.93950851 |
| 0 |
| 4.275166377 |
| 96.68 |
| 6 |
| 8/24/2023 |
| Affirm Holdings ( AFRM ) |
| 15.55 |
| AFRM230616P00012000 |
| 6/16/2023 |
| 0.06 |
| 12 |
| 0.05 |
| 0.06 |
| 18.181818 |
| 9 |
| 22.829582 |
| 16.89814815 |
| 0 |
| 8.240911349 |
| 112.35 |
| 52 |
| 8/24/2023 |
| Affirm Holdings ( AFRM ) |
| 15.55 |
| AFRM230616P00011500 |
| 6/16/2023 |
| 0.04 |
| 11.5 |
| 0.03 |
| 0.04 |
| 28.571429 |
| 9 |
| 26.045016 |
| 10.57971014 |
| 0 |
| 9.0589203 |
| 116.6 |
| 4 |
| 8/24/2023 |
| C3.ai ( AI ) |
| 35.32 |
| AI230630P00020000 |
| 6/30/2023 |
| 0.25 |
| 20 |
| 0.25 |
| 0.3 |
| 18.181818 |
| 23 |
| 43.374858 |
| 19.83695652 |
| 0 |
| 4.795792877 |
| 143.53 |
| 106 |
| 8/30/2023 |
| C3.ai ( AI ) |
| 35.32 |
| AI230630P00021000 |
| 6/30/2023 |
| 0.33 |
| 21 |
| 0.25 |
| 0.4 |
| 46.153846 |
| 23 |
| 40.543601 |
| 18.89233954 |
| 0 |
| 4.534564327 |
| 141.89 |
| 90 |
| 8/30/2023 |
| C3.ai ( AI ) |
| 35.32 |
| AI230616P00022000 |
| 6/16/2023 |
| 0.1 |
| 22 |
| 0.1 |
| 0.2 |
| 66.666667 |
| 9 |
| 37.712344 |
| 18.43434343 |
| 0 |
| 9.672074173 |
| 158.13 |
| 85 |
| 8/30/2023 |
| C3.ai ( AI ) |
| 35.32 |
| AI230616P00020000 |
| 6/16/2023 |
| 0.05 |
| 20 |
| 0.05 |
| 0.1 |
| 66.666667 |
| 9 |
| 43.374858 |
| 10.13888889 |
| 0 |
| 10.60716051 |
| 165.84 |
| 419 |
| 8/30/2023 |
| AutoNation ( AN ) |
| 136.66 |
| AN230616P00125000 |
| 6/16/2023 |
| 0.56 |
| 125 |
| 0.4 |
| 0.6 |
| 40 |
| 9 |
| 8.532124 |
| 12.97777778 |
| 7.69 |
| 7.566696103 |
| 45.73 |
| 2 |
| 7/20/2023 |
| Array Technologies ( ARRY ) |
| 23.17 |
| ARRY230721P00017500 |
| 7/21/2023 |
| 0.3 |
| 17.5 |
| 0.25 |
| 0.4 |
| 46.153846 |
| 44 |
| 24.471299 |
| 11.85064935 |
| 0 |
| 2.885579952 |
| 70.35 |
| 24 |
| 8/8/2023 |
| Baxter International ( BAX ) |
| 41.65 |
| BAX230707P00039000 |
| 7/7/2023 |
| 0 |
| 39 |
| 0.35 |
| 0.45 |
| 25 |
| 30 |
| 6.362545 |
| 10.91880342 |
| 7.69 |
| 2.701953409 |
| 28.65 |
| 0 |
| 7/27/2023 |
| Carnival ( CCL ) |
| 12.3 |
| CCL230616P00010000 |
| 6/16/2023 |
| 0.04 |
| 10 |
| 0.03 |
| 0.04 |
| 28.571429 |
| 9 |
| 18.699187 |
| 12.16666667 |
| 3.93 |
| 9.281066265 |
| 81.71 |
| 140 |
| 6/22/2023 |
| Crinetics Pharma ( CRNX ) |
| 21.78 |
| CRNX230616P00017500 |
| 6/16/2023 |
| 0 |
| 17.5 |
| 0.05 |
| 2.55 |
| 192.307692 |
| 9 |
| 19.651056 |
| 11.58730159 |
| 2.02 |
| 3.204114911 |
| 248.73 |
| 0 |
| 8/9/2023 |
| Capital Southwest ( CSWC ) |
| 18.84 |
| CSWC230616P00017500 |
| 6/16/2023 |
| 0.1 |
| 17.5 |
| 17 |
| 0.05 |
| 0.1 |
| 66.666667 |
| 9 |
| 7.112527 |
| 11.58730159 |
| 2.8 |
| 6.819207283 |
| 42.3 |
| 5 |
| 7/31/2023 |
| Delta Air Lines ( DAL ) |
| 37.1 |
| DAL230616P00034000 |
| 6/16/2023 |
| 0.11 |
| 34 |
| 0.09 |
| 0.11 |
| 20 |
| 9 |
| 8.355795 |
| 10.73529412 |
| 6.44 |
| 8.235089131 |
| 41.15 |
| 35 |
| 7/12/2023 |
| DraftKings ( DKNG ) |
| 25.3 |
| DKNG230721P00020000 |
| 7/21/2023 |
| 0.29 |
| 20 |
| 0.25 |
| 0.27 |
| 7.692308 |
| 44 |
| 20.948617 |
| 10.36931818 |
| 0 |
| 3.009669157 |
| 57.74 |
| 62 |
| 8/4/2023 |
| Elevance Health ( ELV ) |
| 480.43 |
| ELV230623P00430000 |
| 6/23/2023 |
| 5.8 |
| 430 |
| 3.4 |
| 7.2 |
| 71.698113 |
| 16 |
| 10.496847 |
| 18.0377907 |
| 2.41 |
| 7981.977163 |
| 0.03 |
| 3 |
| 7/19/2023 |
| Elevance Health ( ELV ) |
| 480.43 |
| ELV230630P00435000 |
| 6/30/2023 |
| 7.6 |
| 435 |
| 4.7 |
| 8.7 |
| 59.701493 |
| 23 |
| 9.456112 |
| 17.14642679 |
| 5.42 |
| 5002.146376 |
| 0.03 |
| 5 |
| 7/19/2023 |
| Elevance Health ( ELV ) |
| 480.43 |
| ELV230616P00400000 |
| 6/16/2023 |
| 6.64 |
| 400 |
| 1.3 |
| 6 |
| 128.767123 |
| 9 |
| 16.741253 |
| 13.18055556 |
| 0 |
| 5222.698522 |
| 0.13 |
| 7 |
| 7/19/2023 |
| Elevance Health ( ELV ) |
| 480.43 |
| ELV230616P00380000 |
| 6/16/2023 |
| 3.3 |
| 380 |
| 1.15 |
| 2.65 |
| 78.947368 |
| 9 |
| 20.90419 |
| 12.27339181 |
| 0 |
| 1971.583831 |
| 0.43 |
| 7 |
| 7/19/2023 |
| EPR Properties ( EPR ) |
| 42.71 |
| EPR230616P00040000 |
| 6/16/2023 |
| 0.15 |
| 40 |
| 0.1 |
| 0.2 |
| 66.666667 |
| 9 |
| 6.345118 |
| 10.13888889 |
| 6.79 |
| 7.45883472 |
| 34.5 |
| 14 |
| 7/31/2023 |
| First American Financial ( FAF ) |
| 55.29 |
| FAF230616P00050000 |
| 6/16/2023 |
| 0.35 |
| 50 |
| 0.15 |
| 4.8 |
| 187.878788 |
| 9 |
| 9.567734 |
| 12.16666667 |
| 6.02 |
| 2.886874208 |
| 134.41 |
| 0 |
| 7/27/2023 |
| Harrow Health ( HROW ) |
| 20.02 |
| HROW230616P00015000 |
| 6/16/2023 |
| 0.4 |
| 15 |
| 0.1 |
| 0.35 |
| 111.111111 |
| 9 |
| 25.074925 |
| 11.06060606 |
| 0 |
| 3.340419195 |
| 124.54 |
| 0 |
| 8/14/2023 |
| Host Hotels ( HST ) |
| 17.41 |
| HST230721P00010000 |
| 7/21/2023 |
| 0 |
| 10 |
| 0.15 |
| 0.5 |
| 107.692308 |
| 44 |
| 42.561746 |
| 12.44318182 |
| 0 |
| 0 |
| 0 |
| 8/2/2023 |
| ImmunoGen ( IMGN ) |
| 15.37 |
| IMGN230721P00012000 |
| 7/21/2023 |
| 0.25 |
| 12 |
| 0.25 |
| 0.35 |
| 33.333333 |
| 44 |
| 21.92583 |
| 17.28219697 |
| 0 |
| 2.632195696 |
| 69.1 |
| 12 |
| 7/28/2023 |
| MongoDB ( MDB ) |
| 388.57 |
| MDB230721P00310000 |
| 7/21/2023 |
| 4.22 |
| 310 |
| 3.95 |
| 4.4 |
| 10.778443 |
| 44 |
| 20.220295 |
| 10.57001466 |
| 0 |
| 2.941198277 |
| 57.03 |
| 24 |
| 8/31/2023 |
| Madrigal ( MDGL ) |
| 266.53 |
| MDGL230721P00200000 |
| 7/21/2023 |
| 3.9 |
| 200 |
| 3 |
| 5.1 |
| 51.851852 |
| 44 |
| 24.961543 |
| 12.44318182 |
| 0 |
| 2.604620679 |
| 79.5 |
| 15 |
| 8/3/2023 |
| Madrigal ( MDGL ) |
| 266.53 |
| MDGL230623P00195000 |
| 6/23/2023 |
| 2.42 |
| 195 |
| 1 |
| 5.2 |
| 135.483871 |
| 16 |
| 26.837504 |
| 11.69871795 |
| 0 |
| 4.720359068 |
| 129.7 |
| 0 |
| 8/3/2023 |
| Madrigal ( MDGL ) |
| 266.53 |
| MDGL230630P00210000 |
| 6/30/2023 |
| 6.2 |
| 210 |
| 1.5 |
| 6.3 |
| 123.076923 |
| 23 |
| 21.20962 |
| 11.33540373 |
| 0 |
| 3.488314334 |
| 96.49 |
| 0 |
| 8/3/2023 |
| MKS Instruments ( MKSI ) |
| 95.33 |
| MKSI230616P00085000 |
| 6/16/2023 |
| 0.55 |
| 85 |
| 0.3 |
| 0.65 |
| 73.684211 |
| 9 |
| 10.836043 |
| 14.31372549 |
| 7.46 |
| 7.27344848 |
| 60.42 |
| 12 |
| 8/2/2023 |
| MKS Instruments ( MKSI ) |
| 95.33 |
| MKSI230616P00080000 |
| 6/16/2023 |
| 0.3 |
| 80 |
| 0.2 |
| 0.75 |
| 115.789474 |
| 9 |
| 16.080982 |
| 10.13888889 |
| 1.21 |
| 9.18295071 |
| 71.02 |
| 16 |
| 8/2/2023 |
| MicroStrategy ( MSTR ) |
| 276.36 |
| MSTR230714P00215000 |
| 7/14/2023 |
| 5.55 |
| 215 |
| 4.35 |
| 5.55 |
| 24.242424 |
| 37 |
| 22.202924 |
| 19.95914519 |
| 0 |
| 2.690441496 |
| 81.41 |
| 15 |
| 8/1/2023 |
| MicroStrategy ( MSTR ) |
| 276.36 |
| MSTR230630P00215000 |
| 6/30/2023 |
| 1.62 |
| 215 |
| 2.62 |
| 3.4 |
| 25.913621 |
| 23 |
| 22.202924 |
| 19.33872599 |
| 0 |
| 4.212202625 |
| 83.65 |
| 2 |
| 8/1/2023 |
| MicroStrategy ( MSTR ) |
| 276.36 |
| MSTR230616P00215000 |
| 6/16/2023 |
| 0.92 |
| 215 |
| 0.77 |
| 1.03 |
| 28.888889 |
| 9 |
| 22.202924 |
| 14.5245478 |
| 0 |
| 9.386551814 |
| 95.93 |
| 74 |
| 8/1/2023 |
| MicroStrategy ( MSTR ) |
| 276.36 |
| MSTR230616P00210000 |
| 6/16/2023 |
| 0.7 |
| 210 |
| 0.62 |
| 0.8 |
| 25.352113 |
| 9 |
| 24.012158 |
| 11.97354497 |
| 0 |
| 9.968537412 |
| 97.69 |
| 47 |
| 8/1/2023 |
| Cloudflare ( NET ) |
| 69.91 |
| NET230721P00055000 |
| 7/21/2023 |
| 0.95 |
| 55 |
| 0.93 |
| 0.98 |
| 5.235602 |
| 44 |
| 21.327421 |
| 14.0268595 |
| 0 |
| 2.88708635 |
| 61.28 |
| 65 |
| 8/3/2023 |
| Cloudflare ( NET ) |
| 69.91 |
| NET230714P00055000 |
| 7/14/2023 |
| 0.7 |
| 55 |
| 0.67 |
| 0.79 |
| 16.438356 |
| 37 |
| 21.327421 |
| 12.01719902 |
| 0 |
| 3.471817258 |
| 60.6 |
| 4 |
| 8/3/2023 |
| Cloudflare ( NET ) |
| 69.91 |
| NET230707P00055000 |
| 7/7/2023 |
| 0.47 |
| 55 |
| 0.47 |
| 0.53 |
| 12 |
| 30 |
| 21.327421 |
| 10.3969697 |
| 0 |
| 4.323285978 |
| 60.02 |
| 4 |
| 8/3/2023 |
| Owens & Minor ( OMI ) |
| 21.1 |
| OMI230616P00017500 |
| 6/16/2023 |
| 0.17 |
| 17.5 |
| 0.05 |
| 0.3 |
| 142.857143 |
| 9 |
| 17.061611 |
| 11.58730159 |
| 3.93 |
| 7.220527339 |
| 95.83 |
| 0 |
| 8/2/2023 |
| Rocket Companies ( RKT ) |
| 8.31 |
| RKT230616P00007000 |
| 6/16/2023 |
| 0.03 |
| 7 |
| 0.02 |
| 0.03 |
| 40 |
| 9 |
| 15.76414 |
| 11.58730159 |
| 6.69 |
| 8.862260124 |
| 72.14 |
| 7 |
| 8/3/2023 |
| Schrodinger ( SDGR ) |
| 38.14 |
| SDGR230721P00030000 |
| 7/21/2023 |
| 0.6 |
| 30 |
| 0.55 |
| 0.7 |
| 24 |
| 44 |
| 21.342423 |
| 15.20833333 |
| 0 |
| 2.646414011 |
| 66.9 |
| 44 |
| 8/3/2023 |
| SLM Corp. ( SLM ) |
| 16.49 |
| SLM230616P00013000 |
| 6/16/2023 |
| 0.05 |
| 13 |
| 0.05 |
| 0.1 |
| 66.666667 |
| 9 |
| 21.164342 |
| 15.5982906 |
| 0 |
| 9.562518465 |
| 89.76 |
| 2 |
| 8/2/2023 |
| SLM Corp. ( SLM ) |
| 16.49 |
| SLM230616P00014000 |
| 6/16/2023 |
| 0.2 |
| 14 |
| 0.05 |
| 0.5 |
| 163.636364 |
| 9 |
| 15.100061 |
| 14.48412698 |
| 0.81 |
| 5.575303664 |
| 109.84 |
| 0 |
| 8/2/2023 |
| Super Micro Computer ( SMCI ) |
| 223.66 |
| SMCI230721P00175000 |
| 7/21/2023 |
| 3.4 |
| 175 |
| 3.1 |
| 3.8 |
| 20.289855 |
| 44 |
| 21.756237 |
| 14.69480519 |
| 0 |
| 2.686882189 |
| 67.17 |
| 28 |
| 8/8/2023 |
| Super Micro Computer ( SMCI ) |
| 223.66 |
| SMCI230714P00175000 |
| 7/14/2023 |
| 2.05 |
| 175 |
| 2.15 |
| 3.1 |
| 36.190476 |
| 37 |
| 21.756237 |
| 12.11969112 |
| 0 |
| 3.192359653 |
| 67.23 |
| 1 |
| 8/8/2023 |
| Super Micro Computer ( SMCI ) |
| 223.66 |
| SMCI230630P00175000 |
| 6/30/2023 |
| 1.32 |
| 175 |
| 1.2 |
| 1.45 |
| 18.867925 |
| 23 |
| 21.756237 |
| 10.88198758 |
| 0 |
| 4.953544157 |
| 69.7 |
| 6 |
| 8/8/2023 |
| Super Micro Computer ( SMCI ) |
| 223.66 |
| SMCI230630P00177500 |
| 6/30/2023 |
| 3.49 |
| 177.5 |
| 1.15 |
| 1.85 |
| 46.666667 |
| 23 |
| 20.638469 |
| 10.28169014 |
| 0 |
| 4.761900767 |
| 68.78 |
| 0 |
| 8/8/2023 |
| SoFi Tech ( SOFI ) |
| 7.25 |
| SOFI230721P00005500 |
| 7/21/2023 |
| 0.11 |
| 5.5 |
| 0.1 |
| 0.11 |
| 9.52381 |
| 44 |
| 24.137931 |
| 15.08264463 |
| 0 |
| 2.742195427 |
| 73.02 |
| 250 |
| 8/1/2023 |
| SoFi Tech ( SOFI ) |
| 7.25 |
| SOFI230616P00005500 |
| 6/16/2023 |
| 0.03 |
| 5.5 |
| 0.02 |
| 0.03 |
| 40 |
| 9 |
| 24.137931 |
| 14.74747475 |
| 0 |
| 9.012402991 |
| 108.62 |
| 235 |
| 8/1/2023 |
| SoFi Tech ( SOFI ) |
| 7.25 |
| SOFI230630P00005500 |
| 6/30/2023 |
| 0.06 |
| 5.5 |
| 0.05 |
| 0.06 |
| 18.181818 |
| 23 |
| 24.137931 |
| 14.42687747 |
| 0 |
| 4.600197846 |
| 83.27 |
| 33 |
| 8/1/2023 |
| TG Therapeutics ( TGTX ) |
| 25.85 |
| TGTX230623P00019000 |
| 6/23/2023 |
| 0 |
| 19 |
| 0.1 |
| 1.6 |
| 176.470588 |
| 16 |
| 26.499033 |
| 12.00657895 |
| 0 |
| 3.624807781 |
| 166.77 |
| 0 |
| 8/1/2023 |
| TG Therapeutics ( TGTX ) |
| 25.85 |
| TGTX230623P00020000 |
| 6/23/2023 |
| 0.55 |
| 20 |
| 0.1 |
| 0.85 |
| 157.894737 |
| 16 |
| 22.630561 |
| 11.40625 |
| 0 |
| 4.343061129 |
| 118.87 |
| 0 |
| 8/1/2023 |
| TG Therapeutics ( TGTX ) |
| 25.85 |
| TGTX230616P00020000 |
| 6/16/2023 |
| 0.2 |
| 20 |
| 0.05 |
| 0.2 |
| 120 |
| 9 |
| 22.630561 |
| 10.13888889 |
| 0 |
| 7.704146564 |
| 119.13 |
| 181 |
| 8/1/2023 |
| 10x Genomics ( TXG ) |
| 54.98 |
| TXG230616P00040000 |
| 6/16/2023 |
| 0.1 |
| 40 |
| 0.1 |
| 4.9 |
| 192 |
| 9 |
| 27.246271 |
| 10.13888889 |
| 0 |
| 9.985429996 |
| 110.66 |
| 4 |
| 8/7/2023 |
| Upstart Holdings ( UPST ) |
| 28.23 |
| UPST230707P00019500 |
| 7/7/2023 |
| 1.2 |
| 19.5 |
| 0.3 |
| 0.37 |
| 20.895522 |
| 30 |
| 30.924548 |
| 18.71794872 |
| 0 |
| 3.713468964 |
| 101.32 |
| 0 |
| 8/8/2023 |
| Upstart Holdings ( UPST ) |
| 28.23 |
| UPST230721P00017500 |
| 7/21/2023 |
| 0.39 |
| 17.5 |
| 0.38 |
| 0.42 |
| 10 |
| 44 |
| 38.00921 |
| 18.01298701 |
| 0 |
| 2.933603228 |
| 107.48 |
| 15 |
| 8/8/2023 |
| Upstart Holdings ( UPST ) |
| 28.23 |
| UPST230616P00022000 |
| 6/16/2023 |
| 0.09 |
| 22 |
| 0.07 |
| 0.12 |
| 52.631579 |
| 9 |
| 22.068721 |
| 12.9040404 |
| 0 |
| 9.467991731 |
| 94.53 |
| 69 |
| 8/8/2023 |
| Upstart Holdings ( UPST ) |
| 28.23 |
| UPST230623P00020000 |
| 6/23/2023 |
| 0.1 |
| 20 |
| 0.11 |
| 0.13 |
| 16.666667 |
| 16 |
| 29.153383 |
| 12.546875 |
| 0 |
| 6.610949847 |
| 100.6 |
| 17 |
| 8/8/2023 |
| Vir Biotechnology ( VIR ) |
| 26.68 |
| VIR230721P00020000 |
| 7/21/2023 |
| 0.7 |
| 20 |
| 0.3 |
| 0.75 |
| 85.714286 |
| 44 |
| 25.037481 |
| 12.44318182 |
| 0 |
| 2.535676817 |
| 81.91 |
| 0 |
| 8/8/2023 |
| Viking Therapeutics ( VKTX ) |
| 23.07 |
| VKTX230721P00017000 |
| 7/21/2023 |
| 0.59 |
| 17 |
| 0.25 |
| 0.45 |
| 57.142857 |
| 44 |
| 26.311227 |
| 12.19919786 |
| 0 |
| 2.534118025 |
| 86.13 |
| 0 |
| 7/26/2023 |
| Viking Therapeutics ( VKTX ) |
| 23.07 |
| VKTX230616P00017500 |
| 6/16/2023 |
| 0.4 |
| 17.5 |
| 0.05 |
| 1.75 |
| 188.888889 |
| 9 |
| 24.14391 |
| 11.58730159 |
| 0 |
| 3.978747203 |
| 246.1 |
| 0 |
| 7/26/2023 |
| Viking Therapeutics ( VKTX ) |
| 23.07 |
| VKTX230616P00018000 |
| 6/16/2023 |
| 0.1 |
| 18 |
| 0.05 |
| 0.25 |
| 133.333333 |
| 9 |
| 21.976593 |
| 11.2654321 |
| 0 |
| 6.819748614 |
| 130.69 |
| 0 |
| 7/26/2023 |
| VMware ( VMW ) |
| 134.41 |
| VMW230616P00125000 |
| 6/16/2023 |
| 0.4 |
| 125 |
| 0.4 |
| 0.5 |
| 22.222222 |
| 9 |
| 7.000967 |
| 12.97777778 |
| 2.23 |
| 7.880325192 |
| 36.03 |
| 7 |
| 8/31/2023 |
| Varex Imaging ( VREX ) |
| 22 |
| VREX230616P00020000 |
| 6/16/2023 |
| 0 |
| 20 |
| 0.05 |
| 1.8 |
| 189.189189 |
| 9 |
| 9.090909 |
| 10.13888889 |
| 4.27 |
| 3.743013933 |
| 98.5 |
| 0 |
| 8/1/2023 |
| Wayfair ( W ) |
| 46.25 |
| W230707P00035000 |
| 7/7/2023 |
| 1.78 |
| 35 |
| 0.54 |
| 0.67 |
| 21.487603 |
| 30 |
| 24.324324 |
| 18.77142857 |
| 0 |
| 3.516050242 |
| 84.17 |
| 0 |
| 8/3/2023 |
| Wayfair ( W ) |
| 46.25 |
| W230630P00035000 |
| 6/30/2023 |
| 0.48 |
| 35 |
| 0.41 |
| 0.49 |
| 17.777778 |
| 23 |
| 24.324324 |
| 18.59006211 |
| 0 |
| 4.328509252 |
| 89.18 |
| 6 |
| 8/3/2023 |
| Wayfair ( W ) |
| 46.25 |
| W230616P00033000 |
| 6/16/2023 |
| 0.12 |
| 33 |
| 0.09 |
| 0.11 |
| 20 |
| 9 |
| 28.648649 |
| 11.06060606 |
| 0 |
| 10.29928086 |
| 112.81 |
| 2 |
| 8/3/2023 |
| Wayfair ( W ) |
| 46.25 |
| W230616P00032000 |
| 6/16/2023 |
| 0.09 |
| 32 |
| 0.08 |
| 0.1 |
| 22.222222 |
| 9 |
| 30.810811 |
| 10.13888889 |
| 0 |
| 10.47401142 |
| 119.3 |
| 14 |
| 8/3/2023 |
| Western Digital ( WDC ) |
| 39 |
| WDC230616P00035000 |
| 6/16/2023 |
| 0.09 |
| 35 |
| 0.09 |
| 0.11 |
| 20 |
| 9 |
| 10.25641 |
| 10.42857143 |
| 7.09 |
| 9.151912434 |
| 45.45 |
| 13 |
| 8/4/2023 |
| Zentalis ( ZNTL ) |
| 24.68 |
| ZNTL230616P00020000 |
| 6/16/2023 |
| 0.36 |
| 20 |
| 0.05 |
| 0.6 |
| 169.230769 |
| 9 |
| 18.962723 |
| 10.13888889 |
| 6.95 |
| 6.183515059 |
| 124.37 |
| 372 |
| 8/8/2023 |
The arithmetic I ran on the list of options above suggests that investors with a $400K portfolio could achieve a 13.5% annualized yield with an average 19 days to expiration. Furthermore no more than 4.7% of the funds would be exposed to a single contract, and there would be no exposure to any of the contracts with a strike price higher than $160 (to maintain this diversification and avoid concentration).
We calculate that the weighted move to assignment is 5.8 standard deviations from the mean based on implied volatility, and the overall portfolio has a 1.76% assignment risk, meaning that we can expect less than 2% of these trades to need to be managed to the downside.
After accounting for downside management and typical broker commissions, investors are looking at a very diversified portfolio which will likely yield more than 12% net of commissions.
Black Swan events are the large tail end risk of the strategy, if a stock gaps much lower than the strike, the position results in losses.
Just like an insurance company, this is a risk that is managed through diversification, and unlike an insurance company, we underwrite risk with limited timelines (20 days on average).
While it would be possible for investors to deploy $400,000 across all of these opportunities in one day, the way we would approach it would be slightly different.
Since we've been trading this strategy, our trade lists seem to converge towards 18-22 days to expiration. This is because the bulk of the good opportunities for short put trades happen with expirations between 5 and 50 days.
We would suggest that a better approach to this would be to aim to deploy 10% of capital per day. In this way, all capital would be deployed within 10 trading days, or 14 days, giving one week lead time on average expirations, which would allow investors to be more selective with their trades, get even better diversification, and achieve higher yields.
In so doing, the weighted portfolio yield could easily move from an annualized 13.5% gross (12% expected net), to an annualized 16-17% gross (14.5% to 15.5% net), by excluding anything with a yield below 12%, and anything with an assignment risk above 7% or 8%.
Conclusion
To achieve a safe high yield, you cannot do what everyone is doing. The reason that high yields on stocks are high is that they carry high risk.
Selling put options is a strategy which is not often used by retail investors as it seems overly complicated.
When it is done, it is often done in a naïve, hope for the best approach, which brings on its own set of risks.
Robert and I have decided that we would take an advanced, tech enhanced version of this strategy and bring it to income investors who either need, want, or demand high income from their savings.
For further details see:
These 14%+ Sucker Yields Could Cut Dividend, But There's A Better Way