CRGY - These 15 Stocks Have Exhibited The Highest Correlation With Oil Prices Over The Last Month
2023-10-13 10:07:18 ET
Summary
- Recent attacks by terrorists from the Gaza Strip on Israel have raised concerns about the stability of global energy markets.
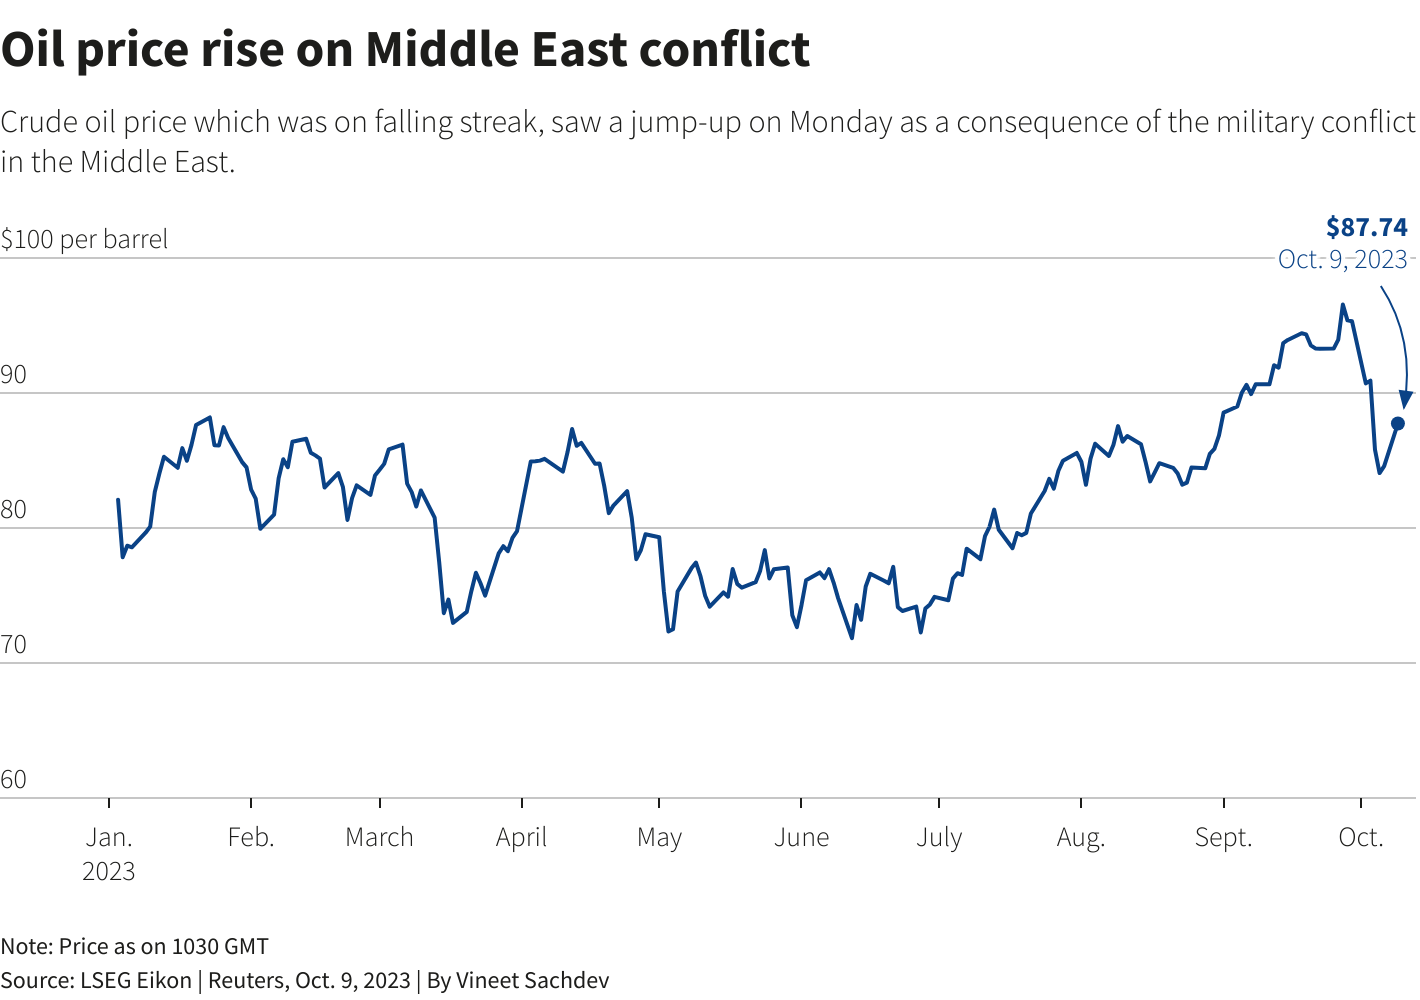
- Crude oil has been one of the most dynamic commodities in the market in 2023, surging from $70 per barrel to $95 per barrel (a 35% increase) since July 1.
- The potential involvement of Iran in the hostilities and the risk of disruptions in the Strait of Hormuz pose threats to global energy markets.
By Andrew Prochnow
As the Russo-Ukrainian war continues to unfold in Eastern Europe, another tragic incident occurred on October 7, when terrorists from the Gaza Strip executed a heinous surprise assault on Israel. While the geopolitical consequences of this event are of immense significance, the immediate focus for global investors and traders revolves around the stability of the worldwide energy markets.
Israel and the Gaza Strip are not significant crude oil exporters themselves, but the broader Middle East region plays a pivotal role as a supplier of global energy resources. It's worth noting that estimates indicate the Middle East holds up to 48% of the world's proven crude oil reserves. Consequently, the recent escalation between Israel and Palestine presents a threat to global energy markets, as it has the potential to trigger a chain reaction of violence in other parts of the region.
Currently, a major concern is the potential involvement of Iran in the hostilities, which could ensnare other Middle Eastern countries. Many experts have suggested that Iran may have supported the terrorist organization Hamas in planning and preparing for the recent attacks on Israel. Regardless of the veracity of these claims, tensions could rapidly escalate between these historical adversaries.
The primary and most pressing concern at the moment is the potential for further loss of life, especially among innocent civilians. Beyond that, there is the risk that Iran may attempt to disrupt the global economy by obstructing traffic in the strategically vital Strait of Hormuz. This waterway is critical as it lies at the only passage between the Persian Gulf and the open sea. Estimates indicate that approximately 33% of the world's liquefied natural gas and roughly 25% of the world's total annual oil consumption pass through this crucial waterway.
Unfortunately, global energy markets are exceptionally vulnerable at this juncture due to the disruptions stemming from the ongoing war between Russia and Ukraine. This means that any additional supply shocks could introduce significant chaos and undoubtedly inject fresh volatility into the prices of crude oil, natural gas, and other key commodities.
The heightened risk of further market disruptions helps to explain the recent 18% jump in the CBOE Crude Oil Volatility Index (OVX) over the last five days and the more than 60% increase over the past month.
Crude oil has been one of the most dynamic commodities in the market in 2023, surging from $70 per barrel to $95 per barrel (a 35% increase) between July 1 and September 30. However, oil prices corrected in early October, dropping to as low as $82 per barrel. In the wake of the Hamas attacks on Israel, oil prices rebounded above $85 per barrel and are currently trading around $86 per barrel.
On Oct. 9, which was the first business day following the unexpected attacks on Israel over the weekend, most of the energy sector showed an upward movement in line with the rising crude oil prices. Many energy stocks closely followed the trend in crude oil.
Oil Sector Moves Higher on Middle East Chaos
On Monday, oil prices rallied by about 5%. The list below highlights the energy stocks making the biggest moves in the immediate aftermath of the recent Hamas attacks on Israel:
- Callon Petroleum Company (CPE), +9%
- Comstock Resources (CRK), +7%
- Matador Resources (MTDR), +7%
- Antero Resources (AR), +7%
- Marathon Oil (MRO), +7%
- Ovintiv (OVV), +6%
- Permian Resources (PR), +6%
- Murphy Oil (MUR), +6%
- Kosmos Energy (KOS), +6%
- SM Energy (SM), +6%
- ConocoPhillips (COP), +6%
- Devon Energy (DVN), +5%
- EOG Resources (EOG), +5%
- Crescent Energy (CRGY), +5%
- CONSOL Energy (CEIX), +5%
- Hess Corp (HES), +5%
- Coterra Energy (CTRA), +5%
- Range Resources (RRC), +5%
- Peabody Energy (BTU), +5%
- Occidental Petroleum (OXY), +5%
Some of the above symbols also appear on the list of stocks exhibiting the highest positive correlation with oil prices over the last 30 days. Listed below are the 15 stocks sharing the highest correlation with United States Oil ETF (USO) over the last month, and their associated correlation coefficients.
- Devon Energy , 0.76
- Diamondback Energy (FANG), 0.75
- Energy Select Sector SPDR Fund (XLE), 0.75
- BP Plc (BP), 0.74
- Marathon Oil , 0.73
- Hess Corp , 0.73
- Occidental Petroleum , 0.73
- Oil & Gas Exploration & Production ETF (XOP), 0.73
- ConocoPhillips , 0.73
- EOG Resources , 0.72
- APA Corp , 0.71
- Exxon Mobil (XOM), 0.71
- VanEck Oil Services ETF (OIH), 0.70
- Halliburton Company (HAL), 0.68
- Chevron Corp (CVX), 0.59
Just as a reminder, when two assets exhibit a positive correlation, meaning they tend to move in the same direction, the correlation value falls within the range of 0 to 1. On the other hand, when two assets are negatively correlated, indicating they move in opposite directions, the correlation falls between -1 and 0.
Correlations are typically classified as non-existent, weak, semi-strong, or strong, depending on the extent to which the two assets are linked. For instance, a correlation of 0.15 might be considered a "weak positive correlation," while a correlation of 0.75 could be termed a "strong positive correlation." Conversely, a correlation of -0.20 might be categorized as a "weak negative correlation," while a correlation of -0.80 could be described as a "strong negative correlation."
As a result, the oil stocks mentioned earlier (with correlation coefficients exceeding 0.70) all share a relatively strong correlation with oil prices, or more precisely, with the United States Oil Fund. It's important to note that the oil-focused volatility gauge, the CBOE Crude Oil Volatility Index, is also closely linked to options activity in USO.
Monitoring Volatility in the Oil Sector
Beyond trading crude oil based on its price direction, which involves going long or short, investors and traders in the energy sector can also engage in trading crude oil based on its volatility.
The CBOE Crude Oil Volatility Index monitors volatility in the crude oil market much like the CBOE Volatility Index tracks volatility in the S&P 500 (VIX).
The OVX offers a real-time estimate of the expected 30-day volatility in the crude oil market using options associated with the United States Oil Fund. Interpreting the OVX is relatively straightforward because its mechanics closely resemble those of the VIX.
For example, if crude oil is trading at $100 per barrel, an OVX reading of 20 would suggest that over the next 12 months, crude oil prices are expected to settle within a range between $80 and $120 (which is 20% of $100, or $20), with a 68% degree of confidence. Additionally, this example would imply that crude oil is expected to trade within a range of $60 to $140 with a 95% degree of confidence or between $40 and $160 with a 99.7% degree of confidence over the next 12 months.
Currently, the OVX is trading around 40 and has fluctuated within a range of approximately 23 to 60 over the past 52 weeks. In the last five days, the OVX has surged by about 18%, rising from 33 to nearly 40.
During the past 30 days, the OVX has witnessed a remarkable 60% increase due to the sharp correction in oil prices in early October, leading to heightened volatility ahead of the October 8 attacks on Israel.
The highest point ever recorded for the OVX occurred in March 2020, when it soared to 190 during the onset of the COVID-19 pandemic, as illustrated below.
bicmagazine.com
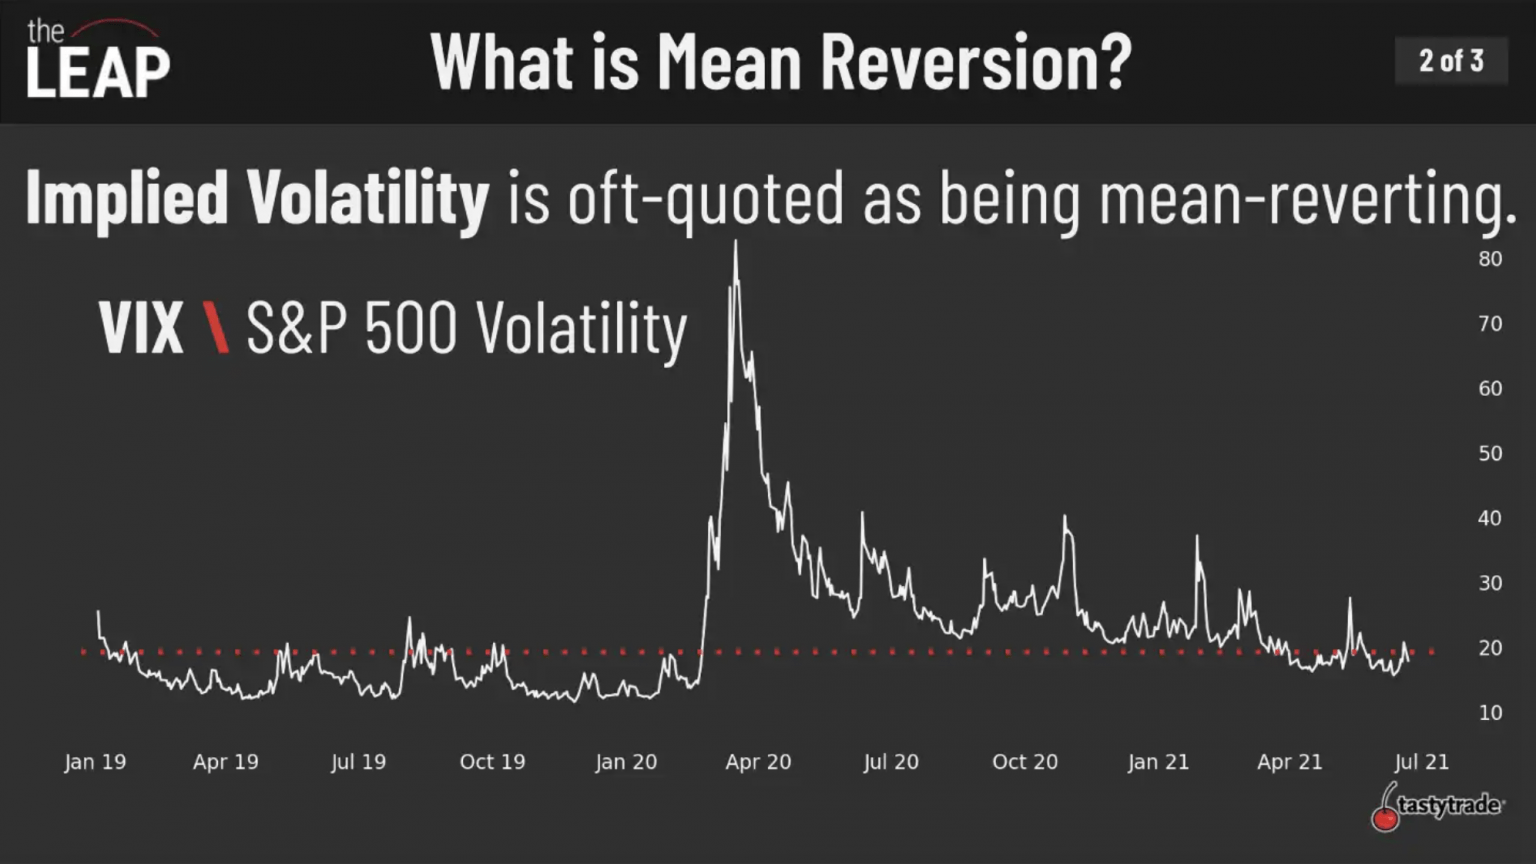
Trading Oil-Related Volatility Using Mean Reversion
As most market participants are well aware, volatility in the financial markets has proven over time to be mean-reverting .
In the trading world, mean reversion refers to the tendency of financial instruments to move toward their average price over time. Historical data has demonstrated beyond any reasonable doubt that volatility tends to move toward its average over time .
Investors and traders frequently engage in buying or selling volatility based on their perception of its relative value. To illustrate, consider a scenario in which the 30-day historical volatility of stock XYZ stands at 20, while the implied volatility (market-based volatility) for options with a one-year duration is priced at 30. In this situation, there exists a theoretical opportunity to sell options in stock XYZ with the expectation that actual volatility will be lower than what the market is pricing.
Suppose an investor or trader opts to sell options with a volatility level of 30%, while the underlying stock XYZ historically moves with a volatility of 20%. In such a case, this position theoretically generates a profit.
While most investors and traders keep an eye on the VIX to assess potential options and volatility prospects, the OVX proves equally valuable when exploring volatility-focused opportunities within the oil sector.
Currently, the OVX is trading below its long-term median, which typically hovers around 68. Nevertheless, considering that the OVX has traded within the range of 24 to 60 over the past 52 weeks, the present reading of 39-40 is reasonably close to the OVX's recent midpoint range.
In the future, investors and traders might consider adding the OVX to their watchlists to monitor and capitalize on potential opportunities in the crude oil sector stemming from ongoing developments in Eastern Europe and the Middle East.
To pinpoint specific opportunities, market participants can refer to metrics like Implied Volatility Rank (IV Rank), which gauges whether implied volatility is high or low for a specific underlying asset based on a year's worth of implied volatility data. For instance, if a hypothetical stock XYZ witnessed implied volatility fluctuating between 30 and 60 over the past year, and the current implied volatility stands at 45, XYZ would have an IV Rank of 50%. If the implied volatility is presently trading at 60 for XYZ, the IV Rank would reach 100%.
Volatility traders often consider selling options or volatility when the IV Rank exceeds 50%, although the specific threshold can vary depending on individual outlook and risk tolerance.
Options sales within the realm of the oil sector may become more enticing if the OVX continues to climb, surpassing milestones such as its 52-week high of 60 or even rising beyond its long-term median of 68.
Andrew Prochnow has more than 15 years of experience trading the global financial markets, including 10 years as a professional options trader. Andrew is a frequent contributor Luckbox Magazine.
Note: The OVX data was provided courtesy of tastylive.
For further details see:
These 15 Stocks Have Exhibited The Highest Correlation With Oil Prices Over The Last Month