SLOFF - Third Avenue Small-Cap Value Fund Q2 2023 Portfolio Manager Commentary
2023-07-20 07:30:00 ET
Summary
- Third Avenue Management is a New York City-based asset manager founded in 1986 that utilizes a disciplined, value-oriented, and asset-based approach to investing in publicly traded securities.
- The Third Avenue Small-Cap Value Fund returned 2.98% during the second quarter of 2023 versus 3.18% for the Fund’s most relevant benchmark, the Russell 2000 Value Index.
- There were 26 positions in the Fund at quarter-end, unchanged from March 31, 2023.
Dear Fellow Shareholders,
The Third Avenue Small-Cap Value Fund (the "Fund") returned 2.98% during the second quarter of 2023 versus 3.18% for the Fund's most relevant benchmark, the Russell 2000 Value Index 1 (the "Index"). During the first half of 2023, the Fund returned 7.27% versus 2.50% for the Index. Unlike last quarter where volatility was extreme, second-quarter returns methodically crept higher. Large-cap technology companies once again dominated other asset classes. Valuation distortions are bordering on absurd! The historical significance of recent valuation disparities and the opportunity it presents for small caps will be discussed later in this letter.
Absolute performance in the quarter was driven by continued strength from investments involved in resource conversion activities outlined in the 1Q 2023 Shareholder Letter . It foreshadowed impressive performance as the actions were seemingly well-received by investors. Three of the four companies highlighted last quarter were top performers in the second quarter. Tidewater ( TDW ) shares rose 25% as the purchase of 37 vessels from Solstad Offshore ( SLOFF ), which boosted the size of the fleet by nearly 20%, appears well-timed when coupled with a pivot by the major oil producers towards increased offshore spending resulting in improving earnings for offshore oil services companies. Westaim ( WEDXF ) ( WED:CA ) rose 25% after the successful IPO of its Skyward Specialty insurance unit. Skyward's shares have risen 66% since the IPO. Westaim took advantage of Skyward's strength by launching a secondary offering in the second quarter. Westaim plans to retire approximately 10% of its own shares with the proceeds. The share repurchase will be highly accretive as it was executed at a discount to book value. The Liberty Braves ( BATRA ) tracking stock rose 18% in anticipation of its IPO in mid-July. It currently is a subsidiary of Liberty Media Corporation and listed as a tracking stock. The IPO will convert the security from a tracking stock to a standalone public entity. Given that John Malone and Liberty Media control the company, it opens up possibilities for future asset monetization strategies.
Homebuilder, Tri-Pointe ( TPH ), rose nearly 30% during the quarter as the homebuilding industry is experiencing unexpectedly strong demand despite higher interest rates. Nearly two-thirds of U.S. home borrowers have mortgages with rates below 4% which has stifled the resale market and provided an opportunity for homebuilders to fill the gap. Homebuilders traditionally provide 10% of home sales, but with homeowners reluctant to sell their homes given below-market-rate mortgages, new builds now account for roughly one-third of home sales. As a result, Tri-Pointe is delivering more homes at higher-than-expected prices despite rising interest rates.
Relative performance was diluted predominantly by select financial companies. Casualty insurer, ProAssurance ( PRA ) declined 18% after a weak 1Q 2023 earnings report. Loss costs were higher than projections which are prolonging the turnaround process. The company remains well-capitalized and trades at a 20% discount to tangible book value. Social inflation (loss costs rising at a faster rate than inflation) is rising due to elevated jury verdicts. ProAssurance is adjusting pricing for the new reality. The current valuation is in deep value territory and the strong balance sheet gives the company time to adjust pricing.
The other two material laggards were banks, Washington Trust ( WASH ) and Southside Bancshares ( SBSI ). Both banks are small (less than $10B in total assets) so should avoid many of the potential regulatory changes that larger banks will likely face. On the other hand, investors are worried about their ability to compete against larger players in a changing environment. As highlighted last quarter, these companies have endured many other cycles and we remain optimistic their strong balance sheets, pristine credit history, and long-term oriented corporate cultures will help them manage through current uncertainties.
Activity
Investors Title ( ITIC ) was added to the portfolio in the second quarter. The investment thesis is highlighted below. EMCOR Group ( EME ) and Madison Square Garden Entertainment ( MSGS ) were eliminated in the second quarter. EMCOR Group has been in the portfolio for nearly twelve years and was an outstanding performer as the company generated a 20% annualized return over the holding period. The market capitalization was approaching $8 billion when we exited the position. Consistent with our strategy, we prefer to own companies with market capitalizations below $3 billion. Yet, we do not have a "hard sell" when market capitalizations surpass $3 billion. Instead, it becomes an easier candidate for sale when valuations are elevated. We believe the combination of valuation and market capitalization achieved in the second quarter justified exiting the position. We wish the management team well as they have built an outstanding company. Madison Square Garden Entertainment was sold after being spun off from Sphere Entertainment Company ( SPHR ) during the quarter. Our thoughts on the spin were outlined in the 1Q 2023 letter. As often happens after a spin-off, investors pick sides. Given the valuation disparities in the post-spin period, Fund Management believed Sphere Entertainment offered a better risk/reward proposition. First, Fund Management preferred Sphere's balance sheet. In addition, according to our analysis, we believed Sphere's Las Vegas assets were being valued at just $200 million despite Sphere investing over $2 billion in the project. The venue opens in September with U2 beginning its residency. A successful opening could help change the narrative around the project. Finally, Sphere retained shares of Madison Square Garden Entertainment as part of the spin-off. Madison Square Garden Entertainment repurchased a portion of those shares late in the second quarter which further boosted Sphere's financial position further improving the risk and return profile of the security.
Investors Title is a company Fund Management has known and admired for years, but it did not meet our strict valuation criteria to justify an investment. Luckily, as the valuation approached book value in the second quarter, it provided an opportunity to initiate a position.
ITIC is a North Carolina-based title insurer. The Fine family owns 29% of the shares and has relied on predominantly organic growth to build the company over the past 50 years. ITIC has many attributes we admire including high insider ownership, a conservative operational culture, a concentrated industry structure, and visible growth potential. The shares have been under pressure due to short-term industry concerns versus company-specific issues. Given rising interest rates causing a slowdown in refinancing activity, the share price declined 50% from previous highs. Trading close to book value, we thought it presented a positive asymmetric risk/return opportunity. ITIC has compounded book value at double-digit rates over long periods of time. The underwriting history is stellar and, given the footprint in faster-growing geographies such as the Carolinas, Georgia, and Texas, it has been able to grow organically. The balance sheet provides an additional layer of safety with healthy reserves and no debt. Over longer periods of time, ITIC has traded at a 50% premium to tangible book value. We expect a reversion to historical valuation levels over time given the strong operational history. Two additional catalysts are additive to the investment thesis. First, ITIC management is highly disciplined about returning excess capital through either share buybacks or special dividends. We are confident capital will be returned to us during our ownership. Second, ITIC's founder is 88 years old and his two sons are over 55. At some point, they may choose to sell to a larger competitor given the concentration in the industry.
Portfolio Update
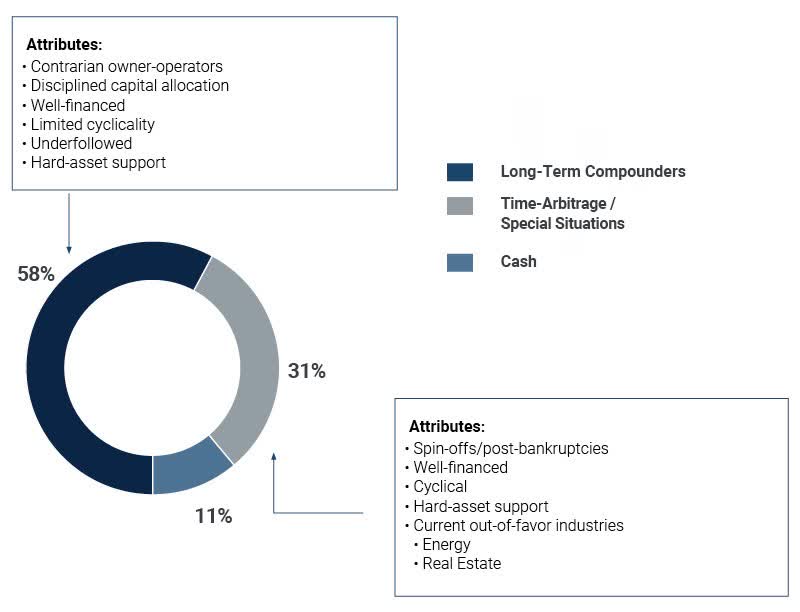
There were 26 positions in the Fund at quarter-end, unchanged from March 31, 2023. Cash at quarter-end stood at approximately 11%, up from 10% on March 31, 2023.
In our approach to portfolio construction, Fund Management categorizes holdings as either long-term compounders or time-arbitrage/special-situation positions based on the companies' characteristics. At the end of the second quarter, long-term compounders represented approximately 58% of the portfolio, and time-arbitrage/special-situation positions represented approximately 31%.
The Fund's compounder category (or "bucket") includes companies such as Seaboard ( SEB ) (conglomerate), MYR Group ( MYRG ) (engineering and construction), and FRP Holdings ( FRPH ) (real estate developer/ aggregates). We believe balance sheet strength and prudent capital allocation should allow these companies to compound NAV for many years to come. Financial services companies are roughly half of the compounder category, and well-capitalized regional banks make up 15% of the total portfolio.
The time-arbitrage/special-situations bucket is predominantly comprised of energy services company Tidewater, real estate-related holdings such as InvenTrust Properties Corp. ( IVT ), and other out-of-favor, misunderstood companies such as Sphere Entertainment Company. All of these companies are cyclical or misunderstood, but given their strong financial positions, Fund Management believes they have the luxury of time and capital to invest and grow until the clouds dissipate.
The Fund's weighted-average discount to our mid-case, conservative NAV estimates rose to 13% in the second quarter from 11.5% last quarter due to changes in portfolio positioning and rising NAV estimates. It is gratifying when the portfolio discount is rising along with positive absolute performance as it indicates NAV estimates are growing at a faster pace than share prices.
Following is a visual overview of the portfolio:
Asset Allocation As Of June 30, 2023
Why Small Caps? Price Matters
At 10 times revenues, to give you a 10-year payback, I have to pay you 100% of revenues for 10 straight years in dividends. That assumes I can get that by my shareholders. That assumes I have zero cost of goods sold, which is very hard for a computer company. That assumes zero expenses, which is really hard with 39,000 employees. That assumes I pay no taxes, which is very hard. And that assumes you pay no taxes on your dividends, which is kind of illegal. And that assumes with zero R&D for the next 10 years, I can maintain the current revenue run rate."
- Scott McNealy, Co-Founder Sun Microsystems (Business Week, 2002)
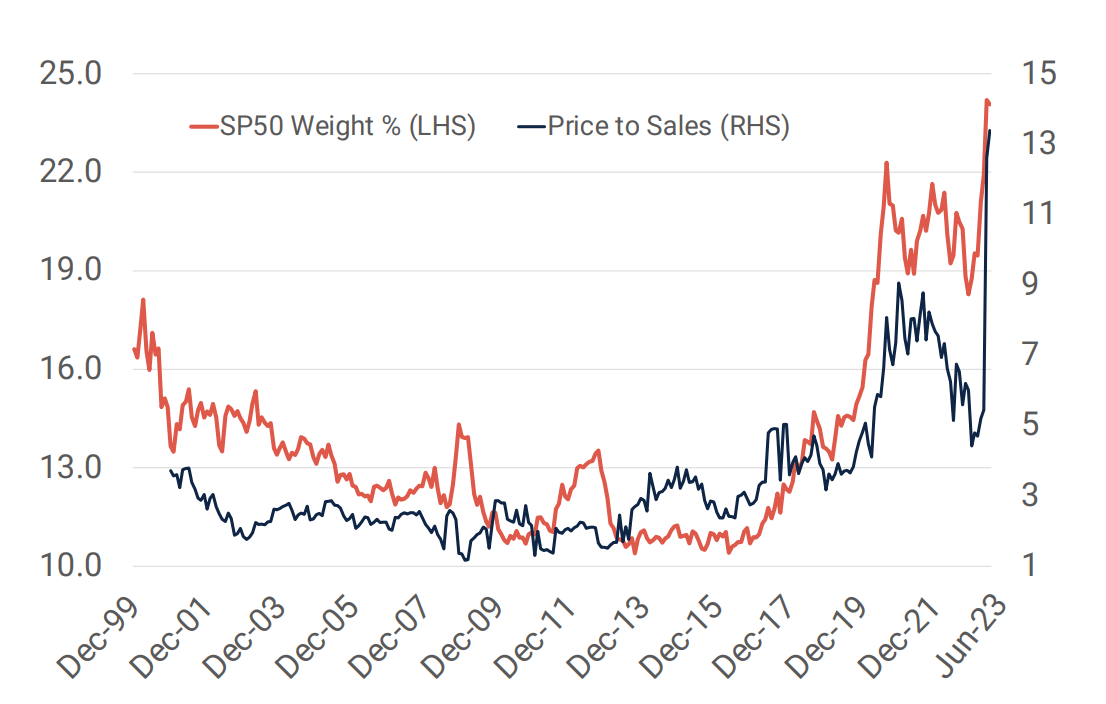
When meeting with prospects and clients, we are often asked the question, why small-caps? The argument has been tough to make given the considerable underperformance versus large-caps over the past five years. As we have pointed out in the past, small caps have outperformed large caps over longer periods despite recent underperformance. Over the past five years, the Russell 2000 Index has underperformed the Russell 1000 3 Index by over 7% per year. Given what has taken place in the post-Covid period, Scott McNealy's timeless quote above appears quaint as the top 5 holdings in the S&P 500 Index (large-cap proxy) comprise 24% of the index and are trading at 13X sales! The chart below illustrates the historical significance of the trend. Fund Management believes the risks in large-caps are greater this cycle than in the late 90s technology bubble. The valuations and weights of the top five companies are exceptionally high exceeding the levels achieved during the tech bubble. What is different this time is during the tech bubble, many of the 10X revenues companies were less widely held. In this cycle, the most popular companies are also extremely overvalued and owned by a wide swath of passive and active investors alike. Know what you own is a common refrain at Third Avenue. Mutual fund investors need to be vigilant about risk control as many portfolios are heavily weighted with overvalued companies where the herd is chasing narratives versus fundamentals.
Price To Sales Ratio And Weight Of The Top 5 Stocks In The S&P 500 Index
Source: FactSet; Standard & Poor's; Jefferies Note: SP50 = S&P 500 Index
In addition to the data above, the following are supporting data points punctuating the historical distortions embedded in US equity markets today:
- The Russell 2000 Index has lagged the S&P 500 Index in 8 of the last 9 quarters
- Apple's market capitalization exceeds the entire market capitalization of the Russell 2000 Index
- Small-caps only represent 4.3% of the market vs 7% over longer periods of time
- Top 5 companies in the S&P 500 Index 2 are 3.4X the size of the Russell 2000 Index
The are many narratives justifying recent outperformance by mega-cap stocks. Fund Management firmly believes that price paid is the ultimate arbiter of future investment performance. A change in leadership given the valuation disparities described in this letter seems inevitable. We published a white paper in the second quarter ( You Aren't Getting Paid to Invest in U.S. Large Cap Stocks Whitepaper ) outlining the attractiveness of small-caps versus large-caps. In the whitepaper, we reviewed performance since 2007 or roughly the beginning of the great financial crisis period when monetary policy made a dramatic shift.
After fielding questions about the white paper, we decided to expand the study back to the late 80s. The results below were striking. The data below shows earnings yields (earnings per share/price) of small-caps (Russell 2000 Index) versus large-caps (Russell 1000 Index) since 1989. The relative earnings yield of small caps has not been as attractive as they are currently in well over three decades.
Russell 2000 Index Vs. Russell 1000 Index Earning Yield
Source: FTSE Russell; Jefferies
Note: Performance starting from January 1990
As shown in the table above, the earnings yield spread between small-caps and large-caps is in the top quintile of observations over the past 30-plus years. In previous periods, when such a large spread has occurred, small-caps have outperformed by an average of more than 25% over the subsequent 36 months. It is important to point out that many investors consider the early 2000s a "lost decade" as the S&P 500 Index was flat for 10 years. That was not the case for small-caps which rose 50% over the 2000-2009 period exceeding the S&P 500 Index return by 4% on an annualized basis.
Conclusion
Despite small-caps being deeply out of favor, our conviction remains high that investors will reengage with the asset class as valuations begin reverting to the mean. Price matters over time. In addition, our approach of investing in underfollowed, well-capitalized companies in a rising interest rate environment will likely be rewarded as well. McNealy's ended his quote by asking, "What were you thinking?". We believe many investors following the herd into overvalued large-cap stocks will be asking the same question a few years from now.
Lastly, it was gratifying to see resource conversion activities were a critical driver of returns in the second quarter. The Fund includes many securities that do not lend themselves to conventional analysis. The Fund's high active share 4 (99%) is a by-product of the investment strategy. Sticking with the fundamentals rather than widely held narratives will likely rise in importance as bubbles inflated in the post-Covid era begin to deflate.
We thank you for your continued support and look forward to writing to you again next quarter. In the interim, please don't hesitate to contact us with any questions, comments, or ideas at clientservice@thirdave.com .
Sincerely,
Vic Cunningham - CFA
Important Information
This publication does not constitute an offer or solicitation of any transaction in any securities. Any recommendation contained herein may not be suitable for all investors. Information contained in this publication has been obtained from sources we believe to be reliable, but cannot be guaranteed.
The information in this portfolio manager letter represents the opinions of the portfolio manager(s) and is not intended to be a forecast of future events, a guarantee of future results, or investment advice. Views expressed are those of the portfolio manager(s) and may differ from those of other portfolio managers or of the firm as a whole. Also, please note that any discussion of the Fund's holdings, the Fund's performance, and the portfolio manager(s) views are as of March 31, 2023 (except as otherwise stated), and are subject to change without notice. Certain information contained in this letter constitutes "forward-looking statements," which can be identified by the use of forward-looking terminology such as "may," "will," "should," "expect," "anticipate," "project," "estimate," "intend," "continue" or "believe," or the negatives thereof (such as "may not," "should not," "are not expected to," etc.) or other variations thereon or comparable terminology. Due to various risks and uncertainties, actual events or results or the actual performance of any fund may differ materially from those reflected or contemplated in any such forward-looking statement. Current performance results may be lower or higher than performance numbers quoted in certain letters to shareholders.
Date of first use of portfolio manager commentary: July 14, 2023
- The Russell 2000 ® Value Index measures the performance of the small-cap value segment of the US equity universe. It includes those Russell 2000® companies with lower price-to-book ratios and lower forecasted growth values. The Russell 2000® Value Index is constructed to provide a comprehensive and unbiased barometer for the small-cap value segment. The index is completely reconstituted annually to ensure larger stocks do not distort the performance and characteristics of the true small-cap opportunity set and that the represented companies continue to reflect value characteristics.
- S&P 500 Index , or Standard & Poor's 500 Index, is a market-capitalization-weighted index of 500 leading publicly traded companies in the U.S.
- The Russell 1000 ® Index measures the performance of the large-cap segment of the US equity universe. It is a subset of the Russell 3000® Index and includes approximately 1,000 of the largest securities based on a combination of their market cap and current index membership. The Russell 1000 represents approximately 93% of the Russell 3000® Index, as of the most recent reconstitution. The Russell 1000® Index is constructed to provide a comprehensive and unbiased barometer for the large-cap segment and is completely reconstituted annually to ensure new and growing equities are included. Source: FTSE Russell
- Active Share is the percentage of a fund's portfolio that differs from the benchmark index. The Russell 2000 Value Index measures the performance of those Russell 2000 companies with lower price-to-book ratios and lower forecasted growth values.
FUND PERFORMANCE
As of June 30, 2023
| 3 mo |
| 1 yr |
| 3 yr |
| 5 yr |
| 10 yr |
| Inception |
| Inception Date |
| Third Ave Small-Cap Value Fund (Inst. Class) |
| 2.98% |
| 15.02% |
| 17.91% |
| 5.68% |
| 8.02% |
| 8.38% |
| 4/1/1997 |
| Third Ave Small-Cap Value Fund (Inv. Class) |
| 2.92% |
| 14.76% |
| 17.63% |
| 5.41% |
| 7.75% |
| 8.55% |
| 12/31/2009 |
| Third Ave Small-Cap Value Fund (Z Class) |
| 3.02% |
| 15.14% |
| 18.04% |
| 5.78% |
| N/A |
| 6.62% |
| 2/28/2018 |
TOP TEN HOLDINGS
Allocations are subject to change without notice
| TASCX |
| Tidewater Inc |
| 7.7% |
| MYR Group Inc. |
| 6.6% |
| UMB Financial Corp. |
| 5.4% |
| Seaboard Corp. |
| 4.9% |
| FRP Holdings Inc. |
| 4.3% |
| ICF International, Inc. |
| 4.2% |
| Encore Capital Group, Inc. |
| 4.2% |
| Kaiser Aluminum Corp. |
| 4.1% |
| Liberty Media Corp.- Liberty Braves, Class A |
| 4.0% |
| ProAssurance Corp. |
| 4.0% |
| Total |
| 49.4% |
Past performance is no guarantee of future results; returns include reinvestment of all distributions. The above represents past performance and current performance may be lower or higher than the performance quoted above. Investment return and principal value fluctuate so that an investor's shares, when redeemed, may be worth more or less than the original cost. For the most recent month-end performance, please visit the Fund's website at www.thirdave. com. The gross expense ratio for the Fund's Institutional, Investor, and Z share classes is 1.25%, 1.57%, and 1.19%, respectively, as of March 1, 2023.
Risks that could negatively impact returns include: fluctuations in currencies versus the US dollar, political/social/economic instability in foreign countries where the Fund invests, lack of diversification, volatility associated with investing in small-cap securities, and adverse general market conditions.
Third Avenue Funds are offered by prospectus only. The prospectus contains important information, including investment objectives, risks, advisory fees, and expenses. Please read the prospectus carefully before investing in the Funds. Investment return and principal value fluctuate so that an investor's shares, when redeemed, may be worth more or less than the original cost. For updated information or a copy of our prospectus, please call 1-800-4431021 or go to our website at www.thirdave.com .
Distributor of Third Avenue Funds: Foreside Fund Services, LLC.
Current performance results may be lower or higher than performance numbers quoted in certain letters to shareholders.
Editor's Note: The summary bullets for this article were chosen by Seeking Alpha editors.
For further details see:
Third Avenue Small-Cap Value Fund Q2 2023 Portfolio Manager Commentary