TDW - Third Avenue Small-Cap Value Fund Q2 2023 Portolio Manager Commentary
2023-10-26 11:25:00 ET
Summary
- Third Avenue Management is a New York City-based asset manager founded in 1986 that utilizes a disciplined, value-oriented, and asset-based approach to investing in publicly traded securities.
- The Third Avenue Small-Cap Value Fund outperformed its benchmark, the Russell 2000 Value Index, returning 3.88% in Q3 2023.
- The Fund utilized a strategy similar to the 1980 Oakland Athletics, focusing on fundamentals and being opportunistic in a challenging market environment.
- The Fund added positions in LSB Industries and Atlanta Braves Holdings, while eliminating Westaim and Chase Corporation from its portfolio.
The Third Avenue Small-Cap Value Fund ( TASCX , the “Fund”) returned 3.88% during the third quarter of 2023, versus a decline of 2.96% for the Fund’s most relevant benchmark, the Russell 2000 Value Index 1 ( RTY. the “Index”). During the first nine months of 2023, the Fund returned 11.43%, versus a drop of 0.53% for the Index. Generating positive absolute returns in a challenging market environment for most asset classes is gratifying.
The past quarter’s performance results reminded us of the strategy utilized by the 1980 Oakland Athletics. Their new coach, former Yankee great Billy Martin, took over managing the Athletics in 1980 after they lost 108 games the previous season. The personnel did not change much after Martin took over, but the style did. Martin combined a strict adherence to the fundamentals with a contrarian, resourceful game strategy that stunned the major leagues. The media labeled the style, “Billy Ball”. The Athletics improved defensively by focusing on the basics, thus minimizing errors. Offensively they manufactured runs unconventionally by bunting and stealing at a prodigious rate. The end result was the Athletics rose to near the top of the standings in 1980.
The Fund executed its own brand of “Billy Ball” this past quarter. The market environment lacked clear trends and faced headwinds ranging from higher interest rates to a slowing economy. Given the wide range of outcomes from an economic perspective, this is a questionable time to position portfolios for binary outcomes. We will detail our strategy for balancing portfolio risks later in the letter.
Similar to the 1980s Athletics, maintaining a strict adherence to the fundamentals, while being opportunistic, is critical. The Fund’s holdings maintain strong financial positions, so the impacts of rising rates have been muted. In addition, our valuation methods assess what companies can accomplish over a market cycle, versus near-term results. An economic slowdown does not phase us. Despite our defense-first mentality, absolute performance was boosted by resource conversion activities and a commitment to deeply out-of-favor securities that did not require much fundamental improvement to shift sentiment.
In July, Chase Corporation was acquired by KKR. The investment in Chase Industries generated over a 60% return in just over a year of ownership. Chase Corporation is a prototypical well-capitalized, owner-operator that Fund Management constantly pursues. Although happy for the Chase family and their employees, we will miss investing alongside them. In addition, the investment in Sphere outlined in last quarter’s letter paid immediate dividends in the third quarter. Sphere rose over 35% during the quarter, in anticipation of U2’s opening concert on September 29th. The inaugural show of their residency received impressive reviews and should be a catalyst for other entertainers to perform in this unrivaled venue.
Casualty insurer, ProAssurance, weighed on results last quarter after reporting poor first-quarter earnings. It snapped back in the third quarter and rose 25%, as operating performance stabilized. In addition, Hamilton Beach Brands reported a narrative-shifting quarter. The company has struggled with supply chain challenges that caused a sizable build-up in working capital. The sharp inventory increase put intense pressure on Hamilton’s valuation. As supply chain bottlenecks eased, Hamilton Beach converted inventories
into cash and used the proceeds to reduce debt. The actions were well-received, as Hamilton Beach rose 29% during the quarter. Finally, long-time holding, offshore oil services company, Tidewater Inc. rose 31% in the quarter, as more investors and operators recognized the importance of investing in fossil fuels to sustain long-term economic growth and national security. In a challenging environment for most asset classes, Energy was a considerable outperformer this past quarter, illustrating the potency of the investor pivot.
Activity
LSB Industries ( LXU ) and the Series C shares of Atlanta Braves Holdings ( BATRK ) were added to the Fund in the third quarter. The investment theses are discussed below. Westaim and Chase Corporation were eliminated. Fund Management sold Westaim, as we felt that its largest asset, insurer Skyward Specialty, was overvalued and the growth prospects for the other entities appear challenging. Chase Corporation was approaching its acquisition price late in the quarter and was also eliminated. The Chase acquisition was officially approved by shareholders on October 6th, 2023.
LSB Industries (“LXU”)
LSB Industries (“LXU”) is a pure-play U.S.-based nitrogen chemicals producer with three wholly owned facilities in Arkansas, Oklahoma and Alabama. The company’s products are sold primarily in agricultural and mining applications. LXU, a previous Fund holding, was purchased during the third quarter, as the valuation became attractive. Fund Management was also impressed with LXU’s improved balance sheet and multi-year advancement toward institutionalizing its operations and capacity expansions for significantly higher-margin derivative products, such as nitric acid. The owner-operator management team is aligned with shareholders, given significant insider holdings. Today, LXU has an opportunity to generate ample operating cash flow, shielded by a sizable net operating loss (“NOL”) balance. Its global low-cost producer advantage in the U.S. offers an additional margin of safety via the scarcity of its asset base. The current valuation implies around a 40% discount to our conservative estimate of replacement cost value.
The U.S.-focused Small-Cap Team (and the broader Third Avenue investment team) have repeatedly discussed “nearshoring” as a developing theme, with attractive investment opportunities likely to present themselves in the coming years. LXU is one such position determined to benefit from U.S. near-shoring for the following three reasons:
- (LXU is awaiting final approval for its application for the Fertilizer Production Expansion Program (FPEP) grant from the USDA Rural Development. LXU is expected to receive approximately a $100 million grant from the USDA, as it perfectly aligns with the USDA policy objectives of increasing U.S. fertilizer supply and providing new fertilizer alternatives to local agricultural producers. In addition to employing advancements in energy efficiency and decreases in greenhouse gas emissions.
- The expected 20% expansion of LXU’s low-cost, domestic capacity will enter an undersupplied nitrogen fertilizer market. Secular demand increases are expected in conjunction with rising ammonia-based fuel applications (i.e. hydrogen, renewable diesel, marine fuel) and expanding mining developments (i.e. copper). This demand growth is expected to outstrip supply and benefit existing brownfield operators (such as LXU) who control the production. Factors such as: (i) permitting delays, (ii) local residents’ opposition to new construction, and (iii) time, materials, and labor inflation have dramatically raised both the cost and timeline for completed greenfield projects, many of which have been put on hold indefinitely.
- Finally, LXU stands to benefit from the near-shoring trend of reducing transportation to improve environmental impact. A latent asset for LXU is its advanced build-out of domestic carbon sequestration capabilities, with no capital expenditure cost to the company! Moving into 2024, LXU will near its engineering objective of permanently sequestering over 450,000 metric tons of CO2 in saline formations directly under its El Dorado, Arkansas facility. This opportunity can support royalty revenues and higher margins, which holds the potential for strategic partnerships.
Fund Management has dedicated analytical resources and research efforts to capitalize on other near-shoring opportunities, and the Fund stands ready to deploy more capital into other investments.
Atlanta Braves Holdings (Series C shares)
On July 18th the Atlanta Braves Holdings, Inc. was spun off from the Liberty Media Corporation and began trading on the Nasdaq Stock Market. Consistent with other John Malonecontrolled entities, the issuance contained multiple share classes. Post IPO, despite equivalent economic value, we noticed a 16% discount between the Series C and Series A common shares. We felt the discrepancy was technical in nature and used it as an opportunity to boost the position size through the Series C shares.
Portfolio Updates
There were 26 positions in the Fund at quarter-end, unchanged from June 30, 2023. Cash at quarter-end stood at approximately 13%, up from 11% on June 30, 2023.
In our approach to portfolio construction, Fund Management categorizes holdings as either long-term compounders or timearbitrage/special-situation positions, based on the companies’ characteristics. At the end of the second quarter, long-term compounders represented approximately 59% of the portfolio, and time-arbitrage/special-situation positions represented approximately 28%.
The Fund’s compounder category (or “bucket”) includes companies such as Seaboard (conglomerate), MYR Group (engineering and construction), and FRP Holdings (real estate developer/aggregates). We believe balance sheet strength and prudent capital allocation should allow these companies to compound NAV for many years to come. Financial services companies are roughly half the compounder category, and wellcapitalized regional banks comprise 16% of the total portfolio.
The time-arbitrage/special-situations bucket predominantly comprises energy services company Tidewater, real estaterelated holdings such as InvenTrust Properties Corp., and other out-of-favor, misunderstood companies such as LSB Industries. These companies are cyclical or misunderstood, but given their strong financial positions, Fund Management believes they have the luxury of time and capital to invest and grow until the clouds dissipate.
The Fund’s weighted-average discount to our mid-case, conservative NAV estimates declined to 11% in the second quarter from 13% last quarter.
Following is a visual overview of the portfolio:
Portfolio Positioning
“The trick is to take risks and be paid for taking those risks, but to take a diversified basket of risks in a portfolio.”
Jeffrey Gundlach, Investor
Fund Management’s balanced approach to risk and return attempts to temper volatility while achieving healthy absolute returns. Careful portfolio construction is a critical driver towards that objective. By emphasizing portfolio construction and security selection, we aspire to provide market-beating returns with less volatility. We have delivered on that promise since taking over portfolio management of the Small Cap Value Fund in September 2017, as the Fund's performance has exceeded its benchmark with less volatility. A summary of Morningstar’s Risk and Return rankings is highlighted below. A recent Morningstar study, “Mind the Gap”, emphasizes the importance of balancing risk and return. According to the study, over a 10-year period, investors in mutual and exchange-traded funds lagged the performance of the products invested in by nearly 20%. The author, Jeffrey Ptak concluded that “one of the clearest takeaways is that investors are more likely to mistime their investments in highly volatile funds.”
MORNINGSTAR 5-YEAR RISK & RETURN PROFILE FOR THE THIRD AVENUE SMALL-CAP VALUE FUND 5
Category: Small Value as of September 30, 2023 Rankings are out of 420 investments.
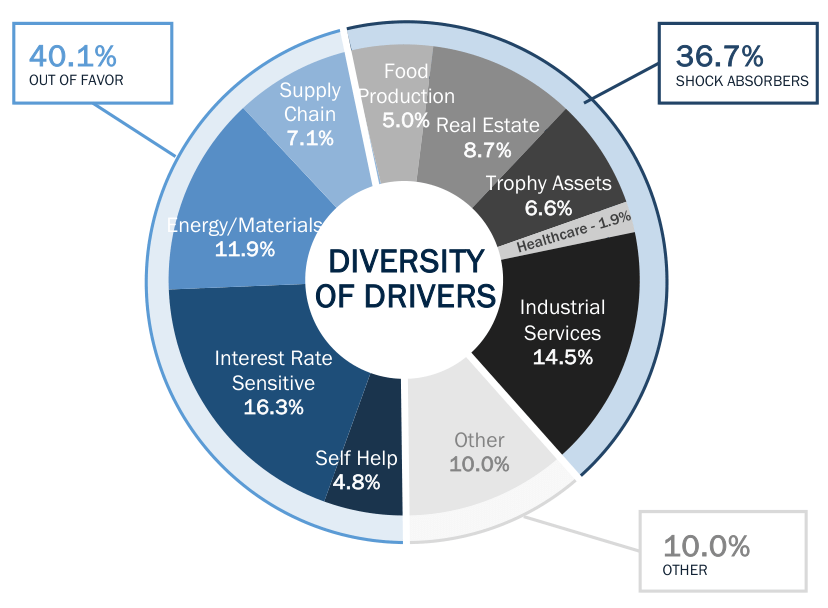
The Diversity of Drivers chart below depicts a tool we use to help monitor portfolio risks. It supplements the compounder vs. time arb/special situation classifications described earlier. A simple way to distinguish between the two is the former is broken down based on the underlying nature of the businesses, while the latter sorts investments by fluid, nearterm challenges facing the companies. For example, ProAssurance is a component of the Self-Help category in the Diversity of Drivers chart below, given company-specific challenges, yet is a compounding business over time.
Monitoring the Diversity of Drivers forces us to consider the various risks across the portfolio holdings. Commonly used sector breakdowns are insufficient as they do not account for overlapping risks. For example, rising commodity costs can impact industrial products and consumer discretionary companies similarly, but the overlapping risks are not evident using a simple sector breakdown. Moving beyond traditional sector weight analysis, we hope to avoid having too much risk allocated to a specific outcome. Overlapping risks create portfolios that achieve binary outcomes, contributing to heightened volatility and often frightening investors at the wrong time.
Following is a roadmap of how we analyze and balance the Diversity of Drivers.
| Categories are determined by Third Avenue Management Excludes cash – 13.32% for the quarter ended 9/30/23 |
Shock Absorbers
On the right-hand side of the chart are the shock absorbers. Most of these companies are compounders and tend to have predictable end markets, or assets that we are confident will hold value in varied economic environments. Admittedly, real estate is an odd fit in the shock absorber classification given the current chaos occurring in the sector. On the other hand, if you dig deeper into the Fund’s real estate investments, you will learn the companies own assets in geographies where supply is lagging demand and end-market dynamics are favorable and predictable. For example, retail REIT, InvenTrust Properties is included in this bucket. Its asset portfolio is heavily skewed towards supermarkets in fastgrowing Southeastern U.S. markets. InvenTrust earns the shock absorber label, given its potential to generate predictable cash flows. In this bucket, the risks are more predictable, thus the securities should not be as volatile.
Out of Favor
This bucket is comprised of companies in either out-of-favor industries or company-specific challenges. The categories will shift over time. Companies such as ProAssurance are included in the Self-Help bucket and Hamilton Beach is in the Supply Chain bucket. These companies tend to be more volatile and sentiment is overly pessimistic. As described earlier, small operational improvement often results in rapid valuation changes. ProAssurance and Hamilton Beach are perfect examples as both were among the worst-performing securities in the first half of the year in the Fund and were some of the best performers in the third quarter. In both cases, share prices rebounded irrespective of the broader market movements for company-specific reasons.
WHAT DRIVERS ARE WE MOST EXCITED ABOUT NOW?
| Opportunity Drivers |
| Company Tickers |
| Potential Opportunity Environment |
| Energy and Materials |
| ( TDW ) |
| Tidewater uses cash flow to paydown recent acquisition debt converting debt into equity |
| Interest Rate Sensitive |
| Net interest margins improve as cash flows are reinvested at higher rates. |
| Self-Help |
| ( HBB ) |
| Hamilton Beach converts excess working capital into cash flow, further enhancing balance sheet |
| Real Estate |
| ( FRPH ) |
| FRP Holdings continues to grow recurring cash flow assets. |
| Industrial Services |
| Companies benefit from ample government spending and a movement to renewable fuels and grid hardening |
Conclusion
Fund Management constantly monitors risk conditions. Over time, we seek to balance investment between Shock Absorbers vs. Out of Favor categories and the specific risks within those broad classifications. It is a simple tool to help balance overall portfolio risk.
Industry literature and many practitioners spend ample time on the security selection aspect of the investment process. It is vitally important. On the other hand, portfolio construction does not receive as much attention. Inattention to portfolio construction contributes to excess volatility, which has proven to hurt shareholder returns. By going through the exercises described in this letter and allocating sufficient time to portfolio construction, we hope to deliver a product that generates healthy returns and is user-friendly for our loyal shareholders.
IMPORTANT INFORMATION
We thank you for your continued support and look forward to writing to you again next quarter. In the interim, please don’t hesitate to contact us with any questions, comments, or ideas at clientservice@thirdave.com .
Sincerely,
Vic Cunningham
| FUND PERFORMANCE |
| 3Mo |
| 1Yr |
| 3Yr |
| 5Yr |
| 10Yr |
| Inception |
| Inception Date |
| Third Ave Small-Cap Value Fund (Inst. Class) |
| 3.88% |
| 23.52% |
| 19.53% |
| 6.30% |
| 7.54% |
| 8.45% |
| 4/1/1997 |
| Third Ave Small-Cap Value Fund (Inv. Class) |
| 3.80% |
| 23.20% |
| 19.21% |
| 6.04% |
| 7.28% |
| 8.68% |
| 12/31/2009 |
| Third Ave Small-Cap Value Fund (Z Class) |
| 3.91% |
| 23.67% |
| 19.65% |
| 6.41% |
| N/A |
| 7.04% |
| 2/28/2018 |
TOP TEN HOLDINGS |
| Tidewater Inc. ( TDW ) |
| 7.1% |
| MYR Group, Inc. ( MYRG ) |
| 6.2% |
| UMB Financial Corporation ( UMBF ) |
| 5.3% |
| Seaboard Corporation ( SEB ) |
| 5.0% |
| ProAssurance Corporation ( PRA ) |
| 4.8% |
| Encore Capital Group, Inc. ( ECPG ) |
| 4.7% |
| Washington Trust Bancorp, Inc. ( WASH ) |
| 4.5% |
| Atlanta Braves Holdings, Inc. ( BATRA ) |
| 4.2% |
| Kaiser Aluminum Corporation ( KALU ) |
| 4.2% |
| Hamilton Beach Brands Holding Co. ( HBB ) |
| 4.1% |
| TOTAL |
| 50.1% |
| Allocations are subject to change without notice |
| This publication does not constitute an offer or solicitation of any transaction in any securities. Any recommendation contained herein may not be suitable for all investors. Information contained in this publication has been obtained from sources we believe to be reliable, but cannot be guaranteed. The information in this portfolio manager letter represents the opinions of the portfolio manager(s) and is not intended to be a forecast of future events, a guarantee of future results or investment advice. Views expressed are those of the portfolio manager(s) and may differ from those of other portfolio managers or of the firm as a whole. Also, please note that any discussion of the Fund’s holdings, the Fund’s performance, and the portfolio manager(s) views are as of September 30, 2023 (except as otherwise stated), and are subject to change without notice. Certain information contained in this letter constitutes “forwardlooking statements,” which can be identified by the use of forward-looking terminology such as “may,” “will,” “should,” “expect,” “anticipate,” “project,” “estimate,” “intend,” “continue” or “believe,” or the negatives thereof (such as “may not,” “should not,” “are not expected to,” etc.) or other variations thereon or comparable terminology. Due to various risks and uncertainties, actual events or results or the actual performance of any fund may differ materially from those reflected or contemplated in any such forward-looking statement. Current performance results may be lower or higher than performance numbers quoted in certain letters to shareholders. Date of first use of portfolio manager commentary: October 13, 2023 1. The Russell 2000® Value Index measures the performance of small-cap value segment of the US equity universe. It includes those Russell 2000® companies with lower price-to-book ratios and lower forecasted growth values. The Russell 2000® Value Index is constructed to provide a comprehensive and unbiased barometer for the small-cap value segment. The index is completely reconstituted annually to ensure larger stocks do not distort the performance and characteristics of the true small-cap opportunity set and that the represented companies continue to reflect value characteristic. 2. S&P 500 Index, or Standard & Poor’s 500 Index, is a market-capitalization-weighted index of 500 leading publicly traded companies in the U.S. 3. The Russell 1000® Index measures the performance of the large-cap segment of the US equity universe. It is a subset of the Russell 3000® Index and includes approximately 1,000 of the largest securities based on a combination of their market cap and current index membership. The Russell 1000 represents approximately 93% of the Russell 3000® Index, as of the most recent reconstitution. The Russell 1000® Index is constructed to provide a comprehensive and unbiased barometer for the large-cap segment and is completely reconstituted annually to ensure new and growing equities are included. Source: FTSE Russell 4. Active Share is the percentage of a fund’s portfolio that differs from the benchmark index. The Russell 2000 Value Index measures the performance of those Russell 2000 companies with lower price-to-book ratios and lower forecasted growth values. 5. To determine a fund's Morningstar Risk score for a given time period (three, five, or 10 years), the fund's Morningstar risk score is plotted on a bell curve: If the fund scores in the top 10% of its category, its risk score is considered High; if it falls in the next 22.5% Above Average; a place in the middle 35% is Average; those lower still, in the next 22.5%, are Below Average and the bottom Low. Overall Morningstar risk score is a weighted average of the available three-, five-, and 10-year Morningstar risk scores. Investments with less than three years of performance history are not rated. To determine a fund's Morningstar Return score for a given time period (three, five, or 10 years), the fund's Morningstar return score is plotted on a bell curve: If the fund scores in the top 10% of its category, its return score is considered High; if it falls in the next 22.5% Above Average; a place in the middle 35% is Average; those lower still, in the next 22.5%, are Below Average and the bottom Low. Overall Morningstar return score is a weighted average of the available three-, five-, and 10-year Morningstar return scores. Investments with less than three years of performance history are not rated. Past performance is no guarantee of future results; returns include reinvestment of all distributions. The above represents past performance and current performance may be lower or higher than performance quoted above. Investment return and principal value fluctuate so that an investor’s shares, when redeemed, may be worth more or less than the original cost. For the most recent month-end performance, please visit the Fund’s website. The gross expense ratio for the Fund’s Institutional, Investor and Z share classes is 1.25%, 1.57% and 1.19%, respectively, as of March 1, 2023. Risks that could negatively impact returns include: fluctuations in currencies versus the US dollar, political/social/economic instability in foreign countries where the Fund invests, lack of diversification, volatility associated with investing in small-cap securities, and adverse general market conditions. The fund's investment objectives, risks, charges, and expenses must be considered carefully before investing. The prospectus contains this and other important information about the investment company, and it may be obtained by calling 800-443-1021 or visiting Third Avenue Management . Read it carefully before investing. Distributor of Third Avenue Funds: Foreside Fund Services, LLC. Current performance results may be lower or higher than performance numbers quoted in certain letters to shareholders. Third Avenue offers multiple investment solutions with unique exposures and return profiles. Our core strategies are currently available through '40Act mutual funds and customized accounts. If you would like further information, please contact a Relationship Manager. |
Editor's Note: The summary bullets for this article were chosen by Seeking Alpha editors.
For further details see:
Third Avenue Small-Cap Value Fund Q2 2023 Portolio Manager Commentary