QVML - Time Left In Secular Bull Equity Market - Part II
2023-12-04 14:45:00 ET
Summary
- Bill Ackman, the legendary hedge fund manager, has noted in the last two weeks that the FOMC is likely much closer to cutting rates.
- The point is that no matter what Powell and the FOMC say, monetary policy can and will change quickly.
- If there are two poster children for punishment by an inverted yield curve, it’s Charles Schwab and Regional Bank ETF.
Last week , with Part I asking the same question about time remaining in this secular bull equity market, I tried to make all the important points still thought about almost daily regarding 2001-2002, 2008, and the worst decade of stock returns for the S&P 500 since the 1930s.
The flip side of this is how long can the bear market in bonds last? After 8-10 years of zero interest rates in the last 13 years, is the bond market likely to suffer the same fate as the S&P 500 from 2000 to 2009? (Here's a blog post from August 6th, 2023, discussing the topic.)
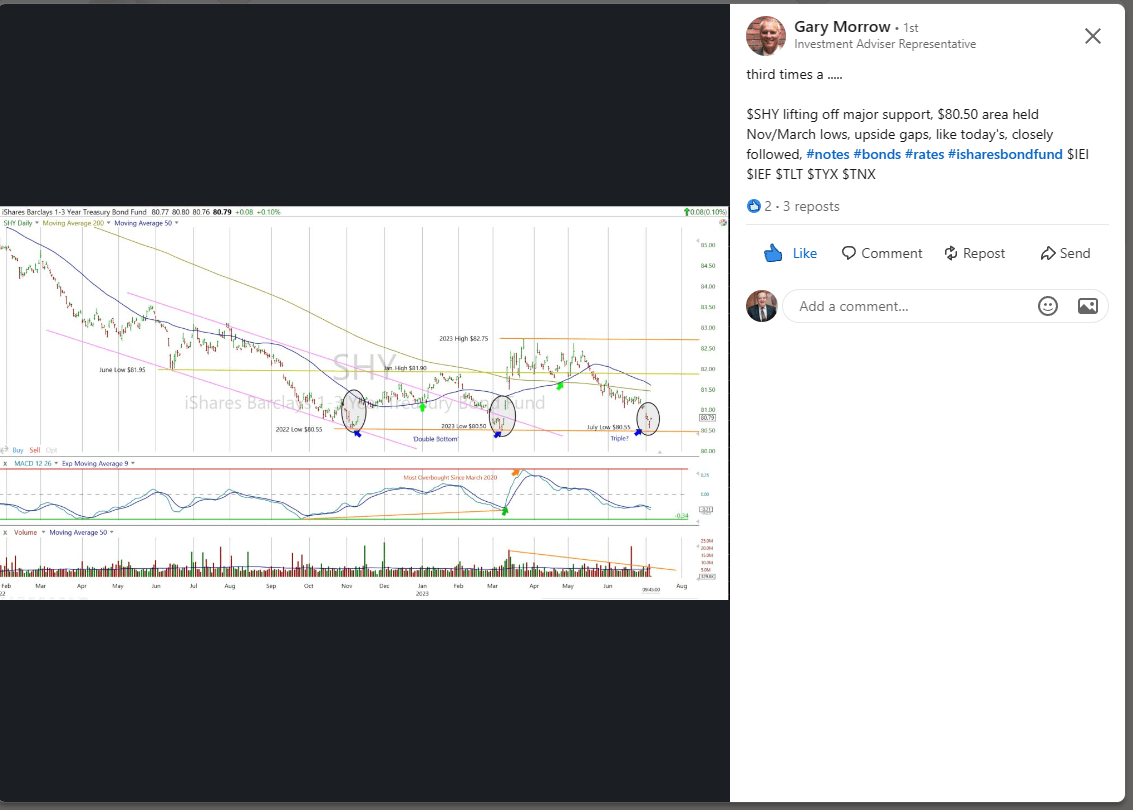
Treasuries have had a nice move already in November '23, as Gary Morrow, a technician who works with this blog on identifying bottoms and tops in stocks and sectors via charts, noted in early July '23 (chart below), the multiple bottoms in SHY (iShares 1-3 year Treasury ETF), prior to the move higher this week. No one was thinking "bond market bottom" then, and SHY was in the process of forming a bottom.
Bill Ackman, the legendary hedge fund manager, has noted in the last two weeks that the FOMC is likely much closer to cutting rates. The fall in bond market yields in the last 2 weeks is certainly supportive of that opinion.
Here's the point of all this: If readers are worried about what Jay Powell said this past week, remember that in Q4 2018, the S&P 500 fell almost 20% peak-to-trough (18.91% to be exact) from 9/30/2018 to 12/24/2018, when the FOMC and Jay Powell were tightening rates from Q4 '16 through Q4 '18, trying to return the Fed funds rate to a somewhat normal level after 8 years of ZIRP (zero interest rate policy), but after more harsh rhetoric from the December '18 FOMC presser, Powell completely reversed course in early January 2019 and started talking easier monetary policy.
From the mid-December '18 FOMC meeting presser to the change in tone in early '19, about 3 weeks had elapsed.
The point for readers is that no matter what Powell and the FOMC say, monetary policy can and will change quickly. They always tend to talk tough and be "restless" about inflation, but they will change their mind quickly and abruptly, if needed.
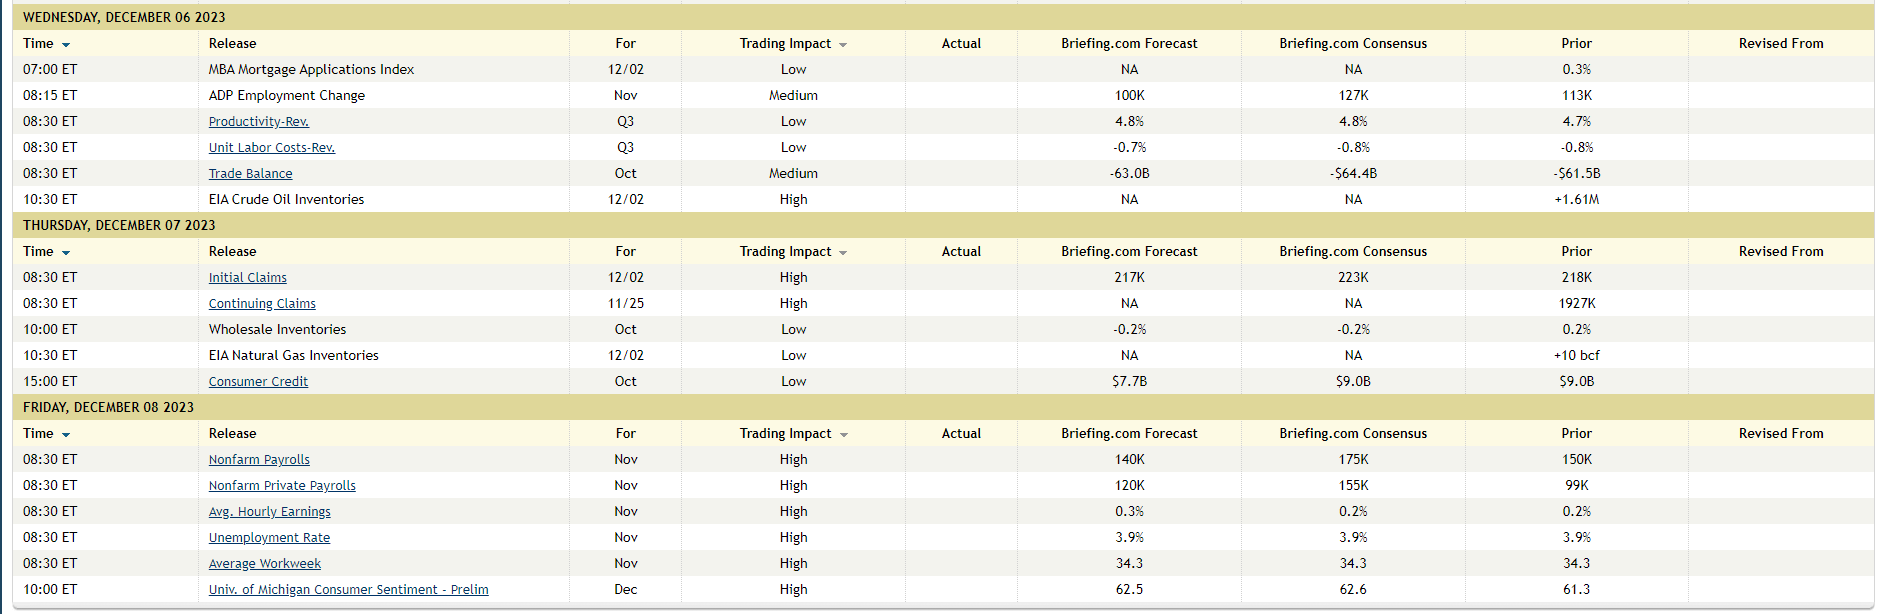
A big clue for how fast macroeconomic conditions are changing is this coming week's Friday, December 8th nonfarm payroll report:
Cut and pasted from Briefing.com, here is Briefing.com's economic calendar with ADP on Wednesday, jobless claims on Thursday and the November '23 nonfarm payroll report on Friday, December 8th, '23. (Just the days with jobs-related releases were clipped.)
The next FOMC (interest rate decision) is scheduled for Wednesday, December 13, '23. The November '23 jobs report on Friday, December 8th will likely influence this decision.
Secular bull market - con't:
There are some similarities (and big differences) to the late 1990s equity bull market and today's equity bull market:
- Concentration in mega-caps. The "Mag(nificent) 7" today is comparable to the tech weighting of 1999;
- The dramatic underperformance of small and mid-caps, equal-weight, emerging markets and international, is very similar to the late 1990s setup;
- One big difference today: The "market-cap to earnings weight" ratio of Tech in the late 1990s was roughly a low 30% market cap weight to a 13% earnings weight. Today, the earnings weight of the Mag 7 or the Top 10 names in the S&P 500 is closer to "29% to high teens". (Haven't seen an earnings weight in a while, but it was creeping up to high teens.)
- Another difference today is the sheer frenzy of the 1995 to 1999 rally (as someone who lived it). The annualized return for the S&P 500 from 1995 to 1999 was 28.5% or a cumulative return for that 60-month period of 251%;
- Today, the S&P 500 has not even cleared the July 27th, '23 high of 4,607.07 and hasn't made a new high in 23 months. The 3-year annual return for the S&P 500 is 8.85%;
- One last big difference between today's bull market and the 2000 is the behavior of high-yield credit. This could change quickly, but high-yield credit, or junk bonds, as represented by the HYG (iShares High Yield Credit ETF), returned 8.98% YTD as of 12/1/23, a high return print for the year. High yield continues to act well but stay sensitive to it. High yield is your early warning indicator for deeper recessions.
- 2022 was a post-Covid correction, given all the liquidity poured into the US economy from March 2020 to early 2022. Bonds are having a bear market given their 3-year return, but I wouldn't call a 20% correction in the S&P 500 in 2022 a "bear market" and the bounce since then a new "bull market".
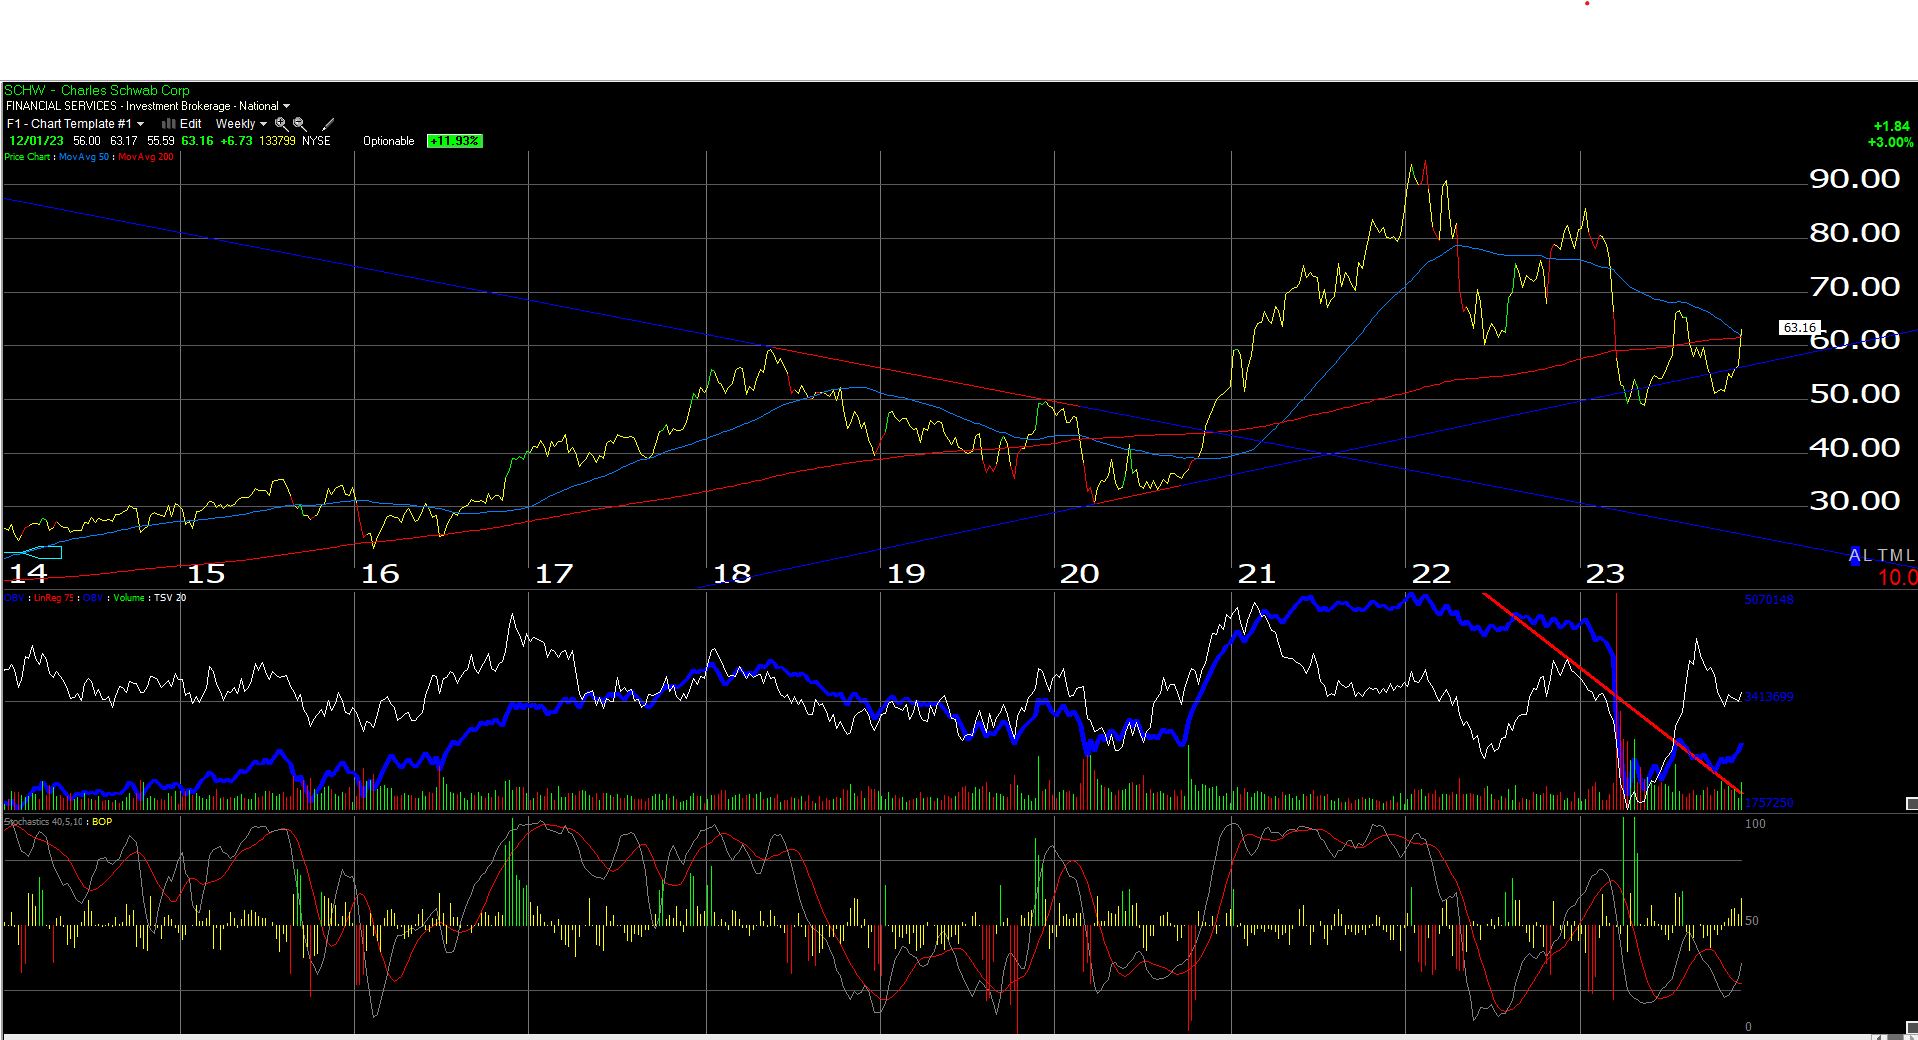
To jump to individual stocks and sectors for a second, if there are two poster children for punishment by an inverted yield curve, it's Charles Schwab ( SCHW ) and Regional Bank ETF ( KRE ). SCHW rose 12% last week and is now trading back above its 50- and 200-week moving averages. Here's the chart for readers:
The KRE is still far below its weekly moving average, but it rose 6.89% last week.
If Ackman's comments are to be believed and Bill called the March '20 Covid bottom almost exactly, these two stocks should benefit from Treasury yield curve "normalization" or a return to a positively sloped curve.
Summary/conclusion: The "real test" for the S&P 500 will come with the test of 4,795-4,800 or the early January '22 all-time highs and the test of 16,200 for the Nasdaq in October - early November '21. Remember, the S&P 500 rested the March 2000 highs of 1,550 in October - November 2007 and failed there, which was the big clue or tell for the coming 2008 bear market.
A graph will be put up later this week, emerging markets are testing 50-year lows relative to the US market. International and EM have trailed the S&P 500 this year.
None of this is advice or a recommendation. Take it all with substantial skepticism. Past performance is no guarantee of future results. IBES data by Refinitiv is the source for all S&P 500 EPS and revenue estimates. Readers should gauge their own comfort level with portfolio volatility and adjust accordingly. Capital markets can change quickly for good and bad and involve the loss of principal.
Thanks for reading.
Editor's Note: The summary bullets for this article were chosen by Seeking Alpha editors.
For further details see:
Time Left In Secular Bull Equity Market - Part II