RPAR - TUG: Market Timing ETF Beating Peers In 2023
2023-12-11 05:17:27 ET
Summary
- STF Tactical Growth ETF is an actively managed multi-asset fund with a proprietary market-timing model.
- The model looks better than random, and it beats several other tactical multi-asset funds.
- Data history is too short to assess a timing strategy.
TUG strategy and portfolio
STF Tactical Growth ETF ( TUG ) is an actively managed fund launched on 5/18/2022 with the objective of long-term capital growth. It has a portfolio of 101 stocks, a distribution yield of 1.65% and an expense ratio of 0.65%. Distributions are paid quarterly.
As described by STF Management, the fund allocates its investments in three compartments:
- US stocks or ETFs, seeking to replicate the Nasdaq 100 Index.
- Long-duration U.S. Treasury securities or ETFs in this asset category.
- Cash equivalents such as short-term U.S. Treasury bills and money market funds.
Allocation decisions are based on a tactical unconstrained growth model (the "TUG Model"), which is mostly based on price movement, volatility and correlation across equities, fixed income, and commodities. Allocation decisions may be weighted: " A partial allocation to Treasury bonds may be made when the equity signal is not at full strength ". STFM warns that the model may result in active and frequent trading. In other words, it is quite a dynamic market timing model.
The undisclosed proprietary strategy offers some flexibility to the management. On the downside, it lacks of transparency for investors, like most actively managed funds.
As of writing, the TUG model looks as bullish as it can get on equities: the portfolio has a 99.3% allocation in stocks of the Nasdaq 100, with only 0.7% of asset value in cash and equivalents and 0% in long-term treasuries. The top 10 issuers are listed below, showing weights almost identical to the Nasdaq 100 Index. The two series of shares issued by Alphabet Inc ( GOOGL , GOOG ) have been grouped on the same line for convenience.
| Ticker |
| Name |
| Weight% |
| EPS growth %TTM |
| P/E TTM |
| P/E fwd |
| Yield% |
| Apple, Inc. |
| 11.10% |
| 0.45 |
| 31.93 |
| 29.91 |
| 0.49 |
| Microsoft Corp. |
| 10.14% |
| 11.28 |
| 36.24 |
| 33.31 |
| 0.80 |
| GOOGL, GOOG |
| Alphabet, Inc. |
| 5.83% |
| 3.56 |
| 25.88 |
| 23.50 |
| 0 |
| Amazon.com, Inc. |
| 5.56% |
| 75.88 |
| 76.97 |
| 55.25 |
| 0 |
| NVIDIA Corp. |
| 4.26% |
| 222.20 |
| 62.73 |
| 38.93 |
| 0.03 |
| Meta Platforms, Inc. |
| 3.80% |
| 7.92 |
| 29.37 |
| 23.17 |
| 0 |
| Broadcom Inc. |
| 3.10% |
| 25.64 |
| 28.67 |
| 20.04 |
| 2.22 |
| Tesla, Inc. |
| 2.87% |
| -4.04 |
| 78.52 |
| 79.38 |
| 0 |
| Adobe, Inc. |
| 2.20% |
| 9.52 |
| 54.89 |
| 38.29 |
| 0 |
| Costco Wholesale Corp. |
| 2.10% |
| 7.74 |
| 43.14 |
| 39.20 |
| 0.67 |
Performance vs. benchmarks
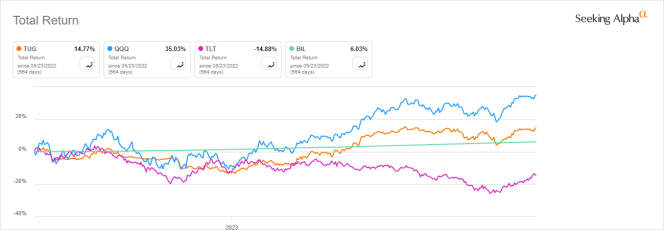
The next chart compares total returns of TUG since inception and three benchmarks corresponding to the three allocation compartments:
- Invesco QQQ ETF ( QQQ )
- iShares 20+ Year Treasury Bond ETF ( TLT )
- SPDR Bloomberg 1-3 Month T-Bill ETF ( BIL )
TUG vs. Benchmarks (Seeking Alpha)
TUG has underperformed the Nasdaq 100, but it is also less volatile. It has outperformed an equal-weight allocation in the 3 ETFs rebalanced annually, which would have returned 7.8%. This is a good point: if we consider that equal weight is the average of a random function of allocation, the TUG model looks better than random. Anyway, a time frame of 18 months is much too short to assess a market timing strategy. TUG has a long-term objective and should be judged through a full market cycle.
TUG vs. competitors
The next table compares characteristics of TUG and five other tactical multi-asset funds:
- iShares Core Growth Allocation ETF ( AOR )
- iShares Core Conservative Allocation ETF ( AOK )
- Strategy Shares Nasdaq 7 HANDL Index ETF ( HNDL )
- WisdomTree U.S. Efficient Core Fund ( NTSX )
- RPAR Risk Parity ETF ( RPAR )
| TUG |
| AOR |
| AOK |
| HNDL |
| NTSX |
| RPAR |
| Inception |
| 5/18/2022 |
| 11/4/2008 |
| 11/4/2008 |
| 1/16/2018 |
| 8/2/2018 |
| 12/12/2019 |
| Expense Ratio |
| 0.65% |
| 0.15% |
| 0.15% |
| 0.96% |
| 0.20% |
| 0.50% |
| AUM |
| $164.54M |
| $2.11B |
| $685.29M |
| $913.33M |
| $897.00M |
| $646.51M |
| Avg Daily Volume |
| $0.45M |
| $17.69M |
| $6.73M |
| $2.56M |
| $3.37M |
| $6.79M |
TUG is the most recent, the smallest (in assets under management) and the less liquid fund of this list, and it has the highest fee. It doesn't make it very appealing. However, it is the best performer since inception, as plotted on the next chart.
TUG vs competitors, since inception (Seeking Alpha)
Year-to-date performance is especially impressive relative to peers (next chart). Nevertheless, it stays behind the Nasdaq 100, which has returned almost 49% in 2023 to date.
TUG vs. competitors, year-to-date (Seeking Alpha)
Takeaway
STF Tactical Growth ETF is an actively managed multi-asset fund. It implements a proprietary market-timing model to allocate assets in three compartments: the Nasdaq 100 index, long-term treasuries and cash equivalents. Since it was launched in May 2022, performance has been promising: the model looks better than random and it beats several other tactical multi-asset funds. However, data history is too short to assess a timing strategy, and TUG still has a long way to prove itself.
For further details see:
TUG: Market Timing ETF Beating Peers In 2023