JJE - U.S. January Oil Production At Post Pandemic High
2023-04-05 03:44:00 ET
Summary
- U.S. oil production increased by 437 kb/d to 12,462 kb/d, a post-pandemic high.
- From the beginning of April 2021 through to the week ending July 29, 2022, the US added horizontal oil rigs at a rate of close to 3.76 rigs/wk and peaked at 551 rigs in the week ending July 29.
- The production cut forced the shorts to cover.
A Guest post by Ovi
All of the Crude plus Condensate (C + C) production data for the US state charts comes from the EIA?s March Petroleum Supply monthly PSM which provides updated information up to January 2023.
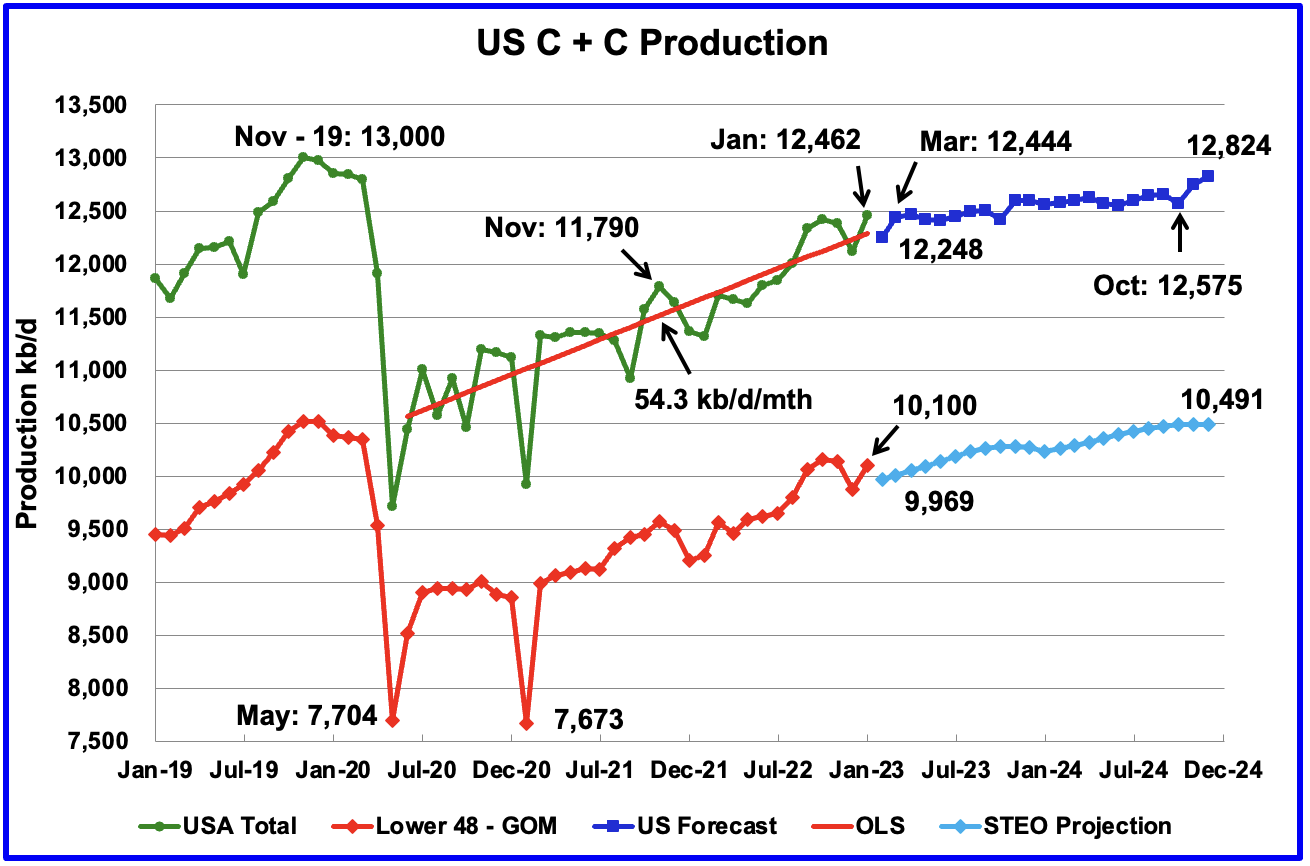
U.S. oil production increased by 437 kb/d to 12,462 kb/d, a post-pandemic high. For January, the GOM contributed 125 kb/d to this high. The states with the largest increase were North Dakota with 97 kb/d followed by Texas with 76 kb/d.
The dark blue graph, taken from the March 2023 STEO, is the forecast for U.S. oil production from February 2023 to December 2024. Output for December 2024 is expected to be 12,824 kb/d which is 166 kb/d lower than the November 2019 peak of 13,000 kb/d. From March 2023 to October 2024, production is forecast to increase by 131 kb/d . February's production is expected to drop by 214 kb/d to 12,248 kb/d.
The red OLS line from June 2020 to January 2023 indicates a monthly production increase of 54.3 kb/d/mth over that period. Clearly, the growth rate going forward for 2023 and 2024, shown in the dark blue graph, will be lower than the 54.3 kb/d/mth seen in the previous July 2020 to January 2023 period.
While overall US oil production decreased by 347 kb/d, the Onshore L48 had a smaller but similar-sized increase of 221 kb/d to 10,100 kb/d in January. The light blue graph is the STEO projection for output to December 2024 for the Onshore L48. From February 2023 to December 2024, the output is expected to increase by 522 kb/d. Note that the last six months of 2023 are showing a hint of plateauing.
Oil Production Ranked by State
Author
Listed above are the 10 states with the largest US oil production. These 10 accounted for 81.4% of all U.S. oil production out of a total production of 12,462 kb/d in January 2023.
On a YoY basis, US production increased by 1,093 kb/d with the majority, 833 kb/d having come from Texas and New Mexico.
State Oil Production Charts
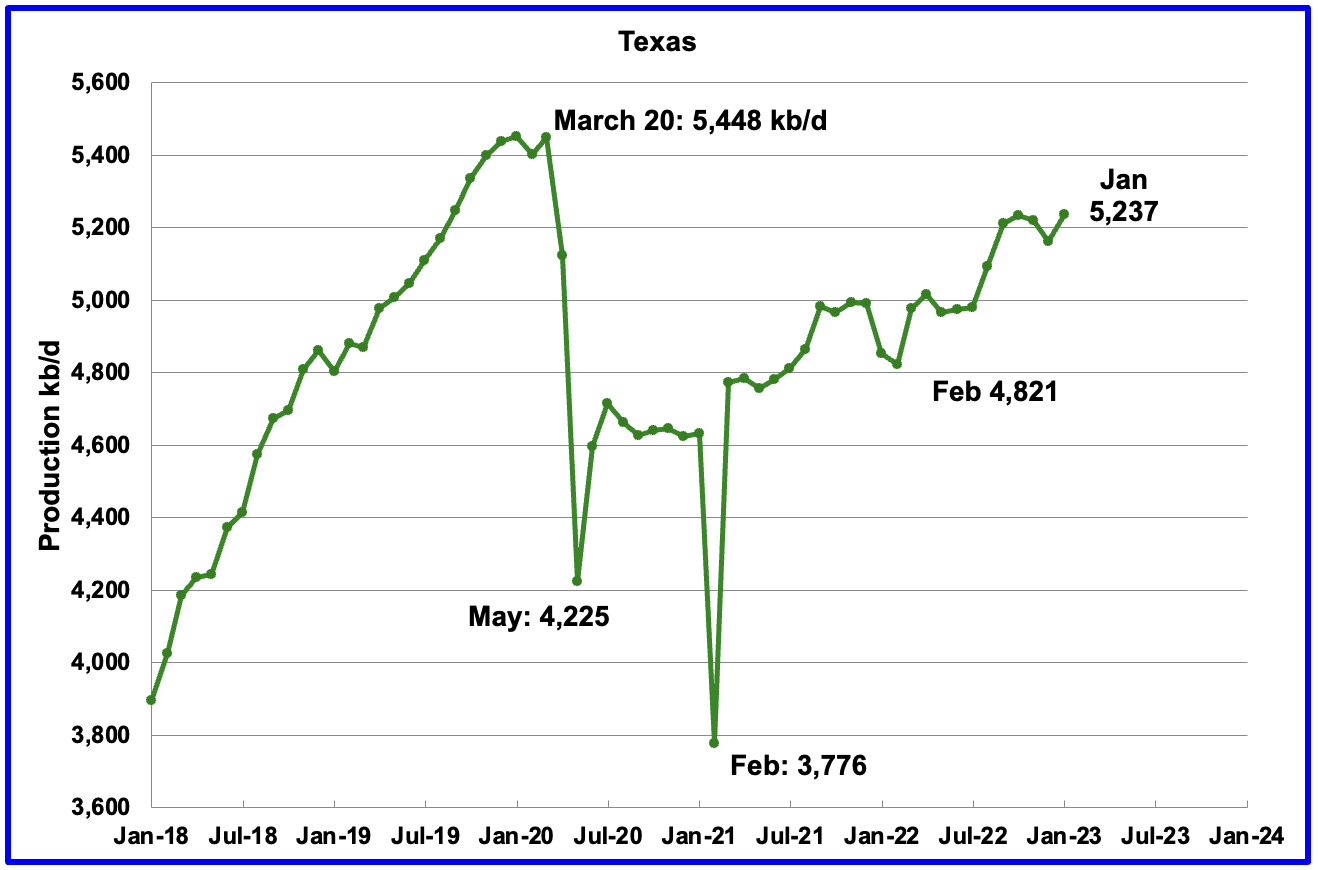
Texas production increased by 76 kb/d in January to 5,237 kb/d, a post-pandemic high.
In January 2022 there were 235 Hz oil rigs operating in Texas. By January 2023, 325 Hz oil rigs were operational, an increase of 90 rigs. On a YoY basis, production increased by 384 kb/d.
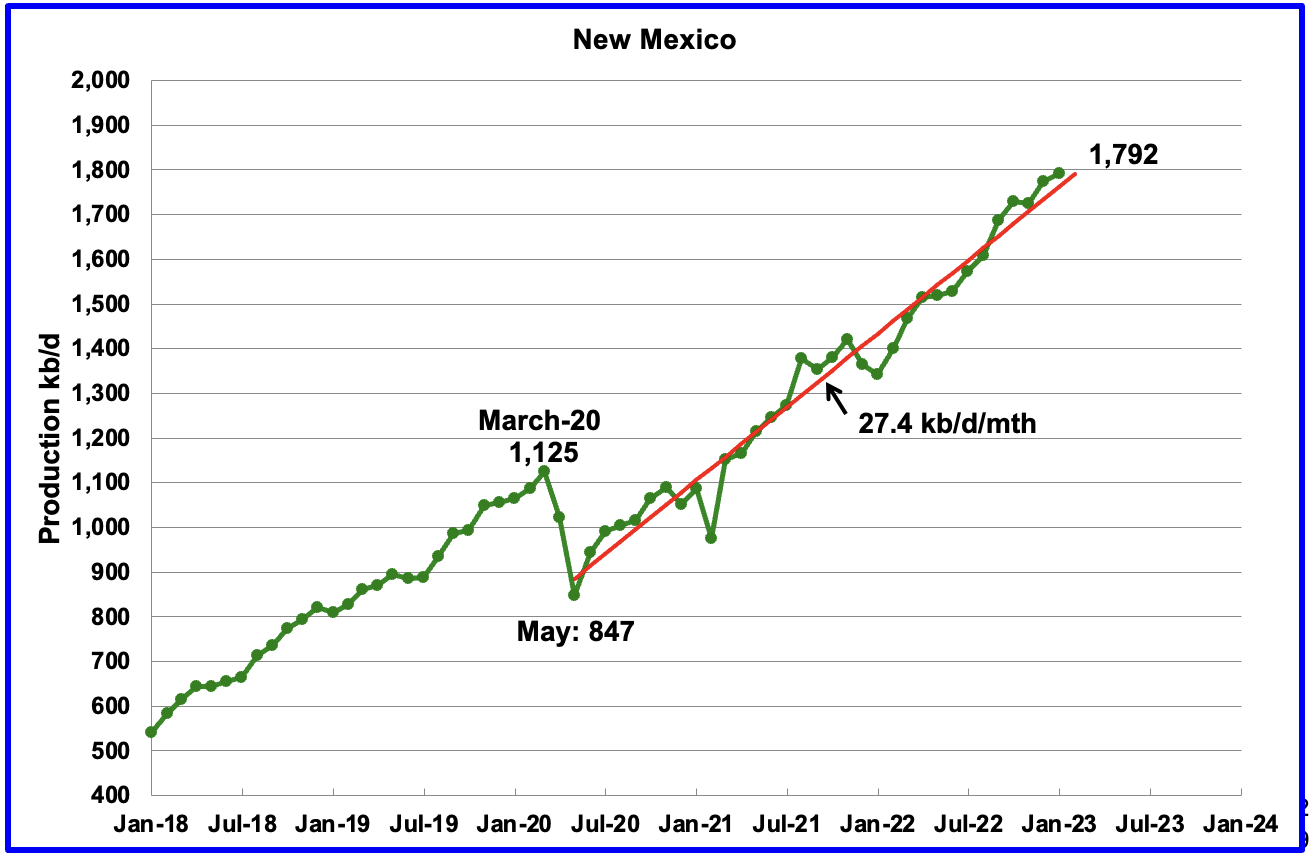
New Mexico's production continues to make new highs. January's production added 19 kb/d to 1,792 kb/d, another record high.
The red OLS line from May 2020 to January 2022 indicates a production growth rate of 27.4 kb/d/mth and shows no sign of rolling over. Since August, the rig count has been steady in the high 90s, 97 ±4.
Author
North Dakota's January oil production has partially recovered from December's extreme cold weather-impacted production. Output increased to 1,046 kb/d, an increase of 97 kb/d over December.
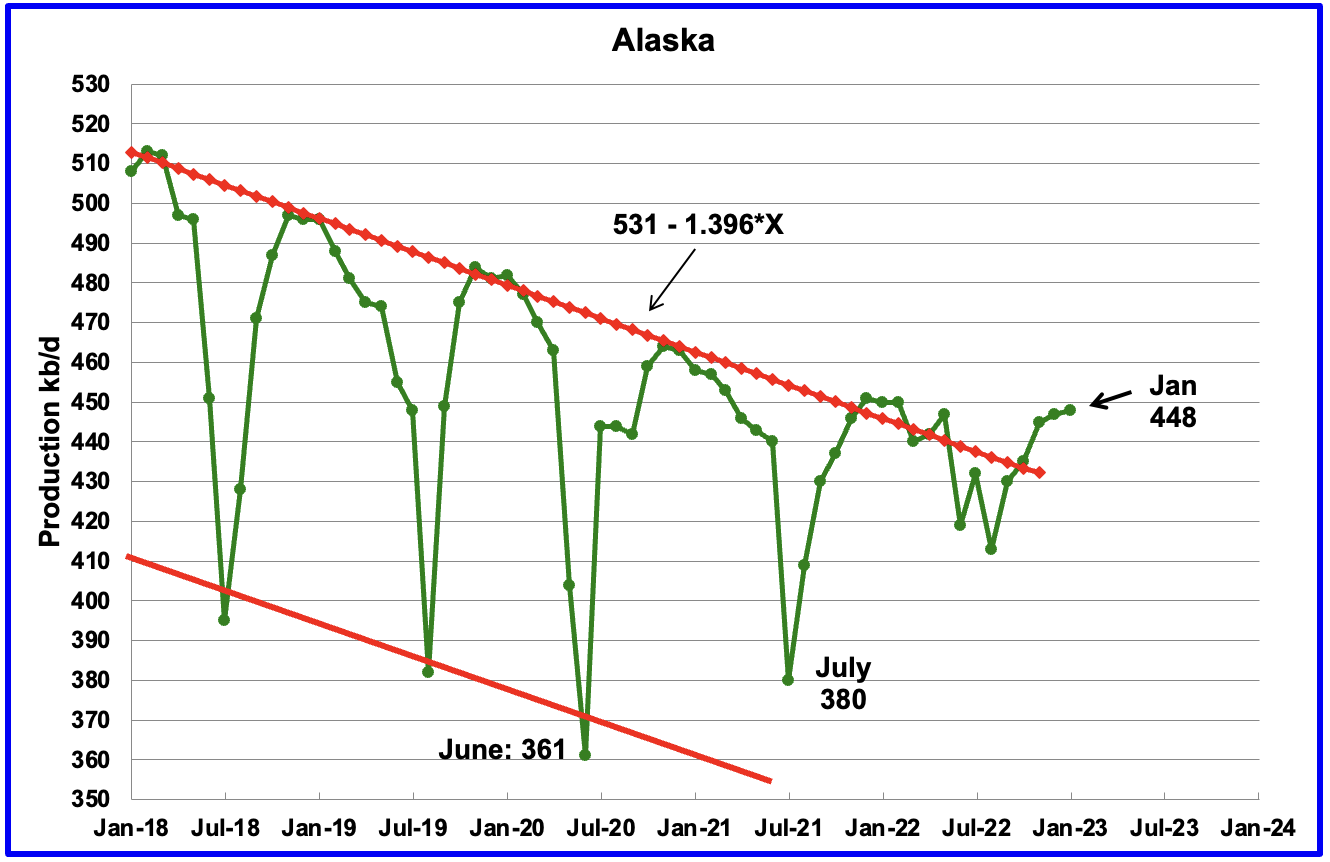
Alaska?s January output increased by 1 kb/d to 448 kb/d and was 2 kb/d lower than in January 2022. This is an early indication that Alaska's oil production may be breaking out from the red declining downtrend line.
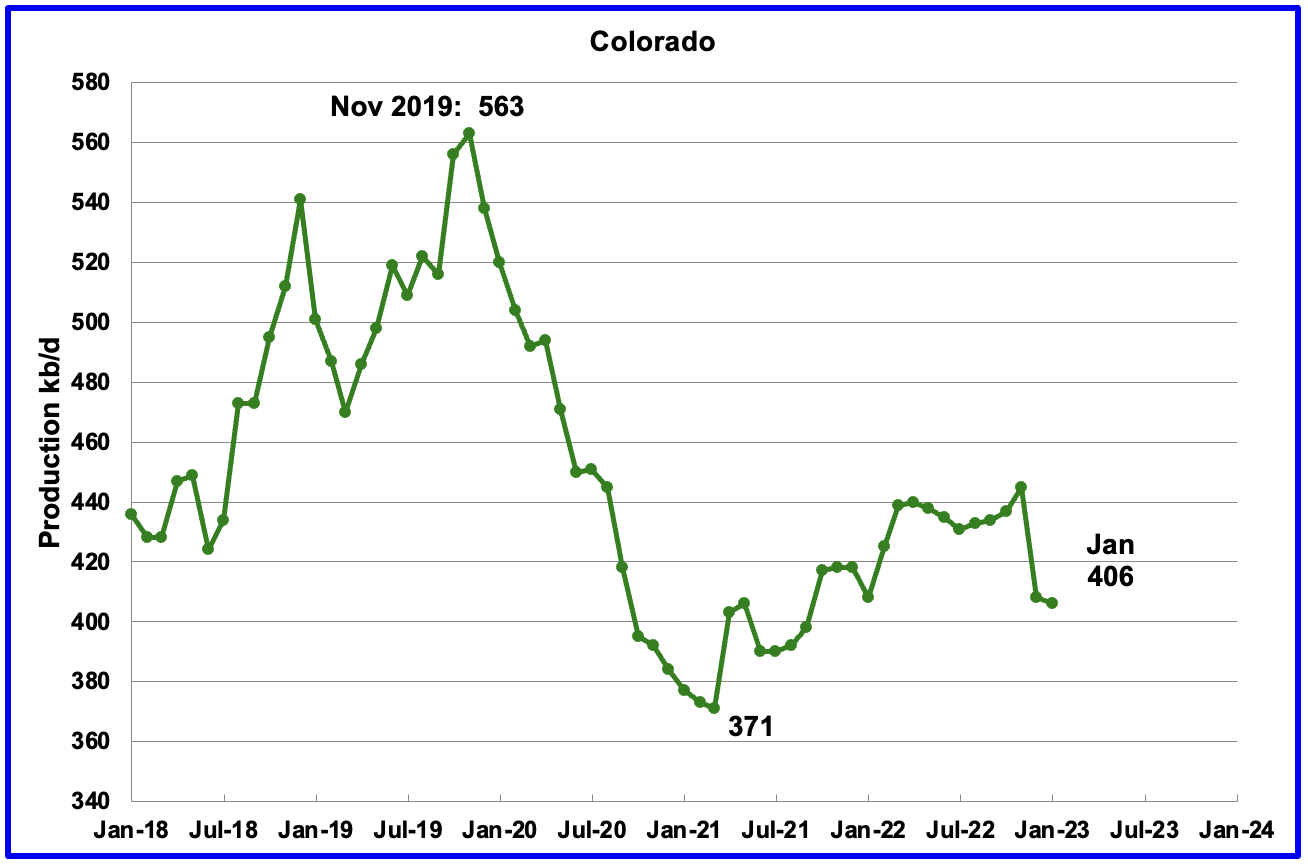
Colorado?s January production decreased by 2 kb/d to 406 kb/d.
Author
Oklahoma's output in January increased by 18 kb/d to 432 kb/d. Production remains 44 kb/d below the post-pandemic July 2020 high of 476 kb/d.
From January 2022 to April 2022, close to 50 rigs were operating in Oklahoma. By January 2023 the rig count had increased to 60.
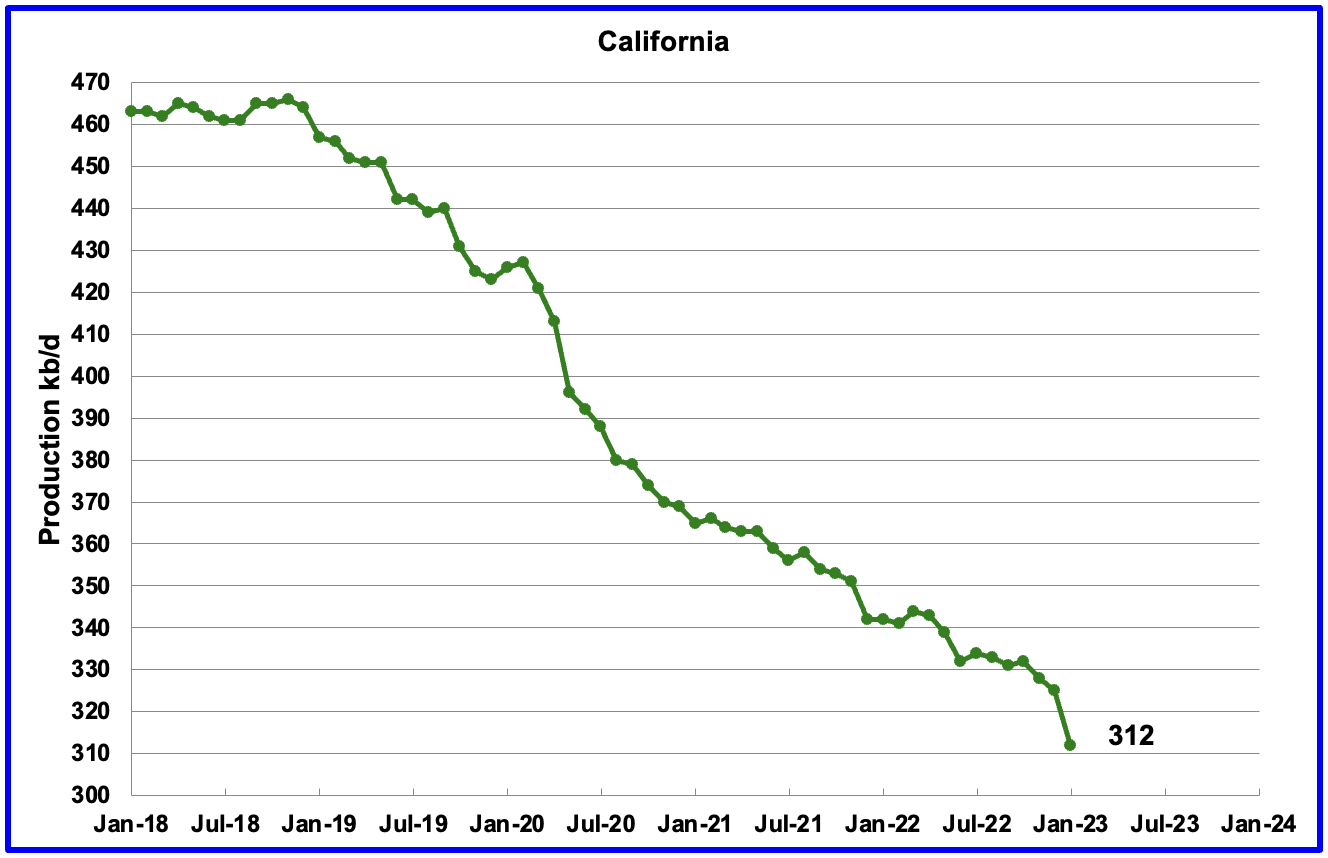
California?s overall slow output decline trend continues. However, there was a larger-than-normal drop of 13 kb/d in January to 312 kb/d.
Author
Wyoming's oil production has been on a slow unsteady uptrend from the low of 220 kb/d in February 2021 due to increased drilling. October and November 2022 output reached a post-pandemic high of 270 kb/d. Weather affected December production but January's production recovered by 5 kb/d to 247 kb/d.
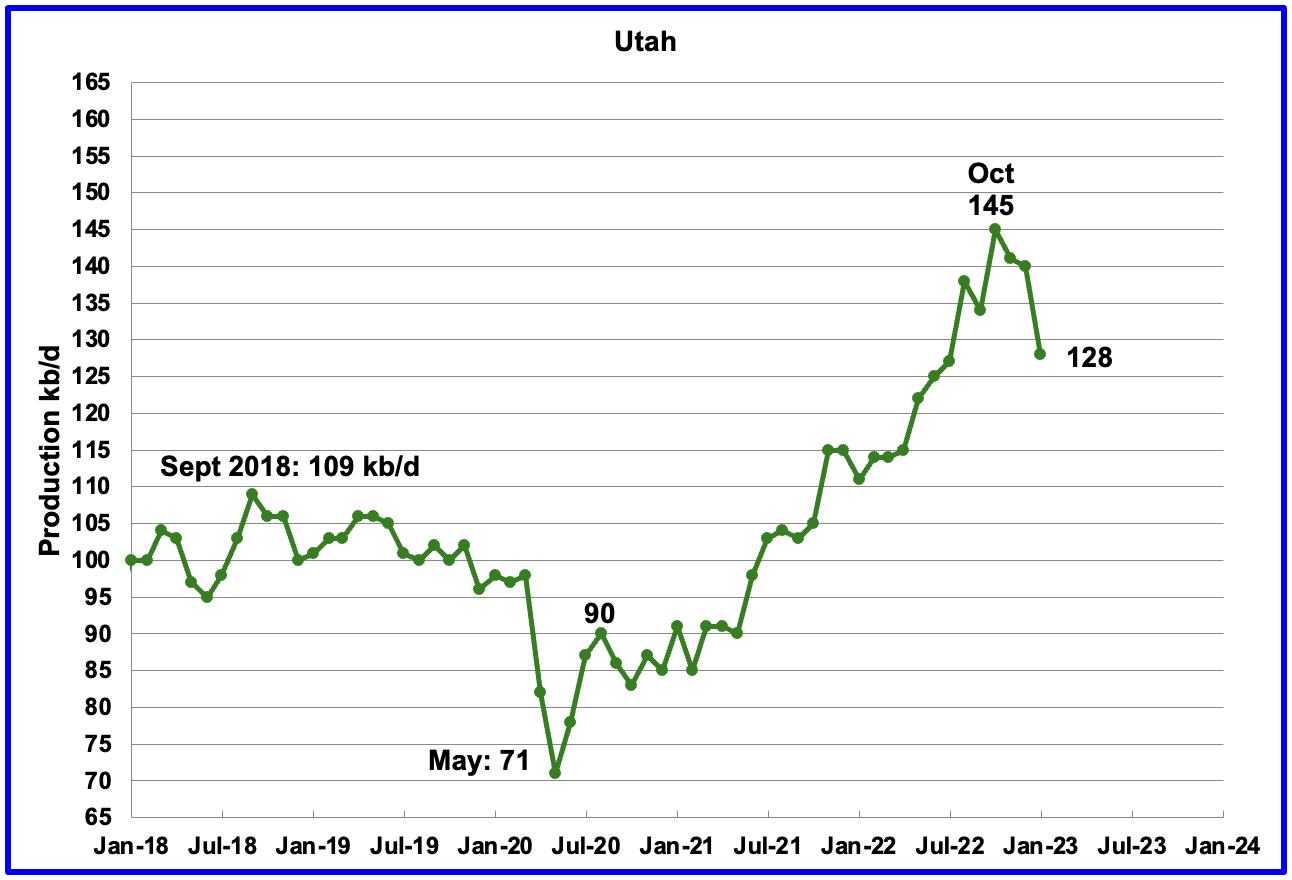
Utah's oil production had been increasing steadily since early 2021 and reached a new high of 145 kb/d in October 2022. However, since then, production has declined by 17 kb/d to 128 kb/d in January.
Utah had 7 Hz rigs operating in January 2023, up from 5 in January 2022.
Author
Louisiana's output rose from the low of 63 kb/d in September 2021 to 104 kb/d in May 2022. Since then output has plateaued. January's production was 100 kb/d, 4 kb/d lower than in May 2022.
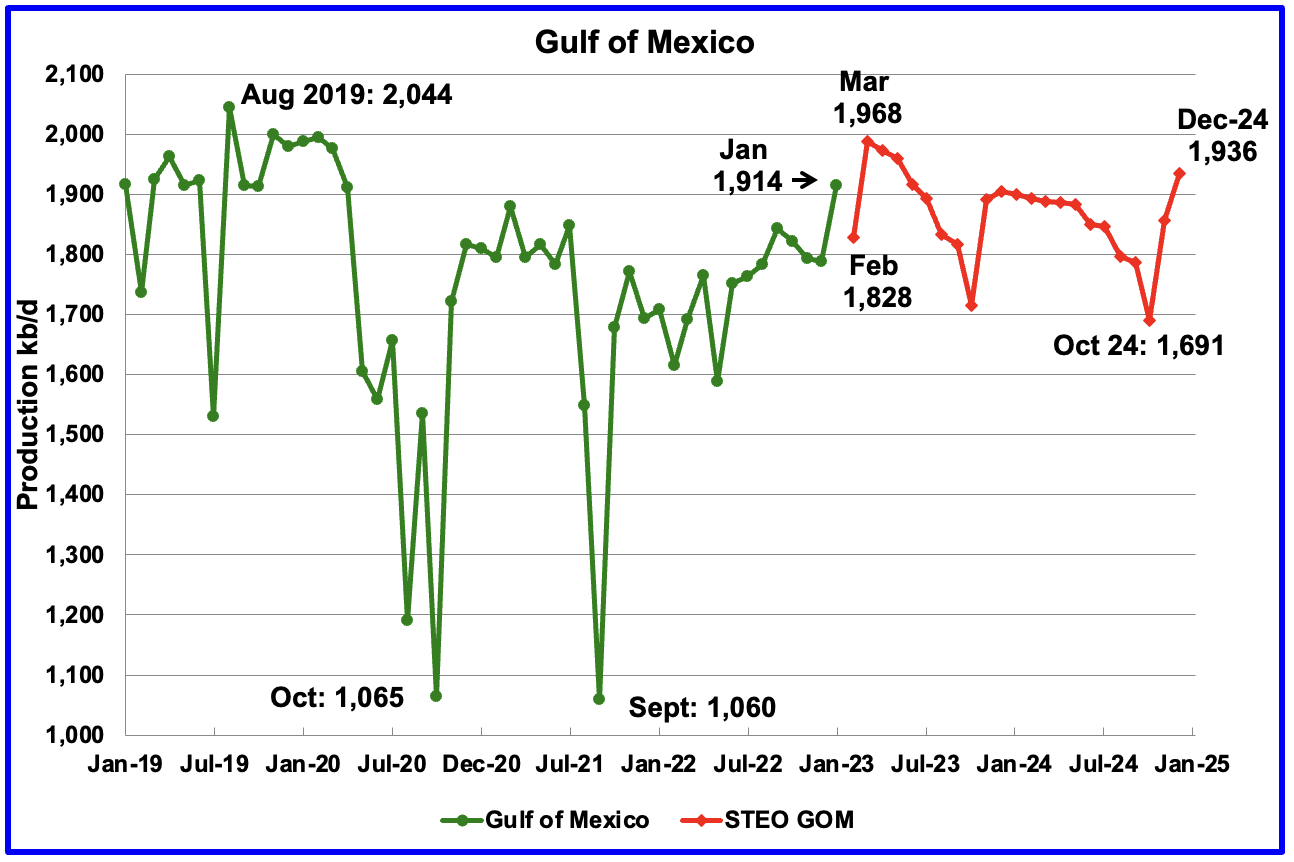
GOM production increased by 125 kb/d in January to 1,914 kb/d. If the GOM was a state, its production would normally rank second behind Texas.
The February 2023 STEO projection for the GOM output has been added to this chart and projects that output in February 2023 will drop to 1,828 kb/d. This is an unexpected surprise since Shell announced that the Vito platform had begun production on February 15, 2023. This production drop implies that the startup may have encountered problems and the Vito platform had to be shut down.
Note that March production, estimated at 1,968 kb/d, could mean that the EIA expects that Vito's estimated peak production of 100,000 barrels of oil equivalent per day, will be fully online during March.
It is not known if the GOM decline after March 2023 is related to extensive maintenance.
A Different Perspective on US Oil Production
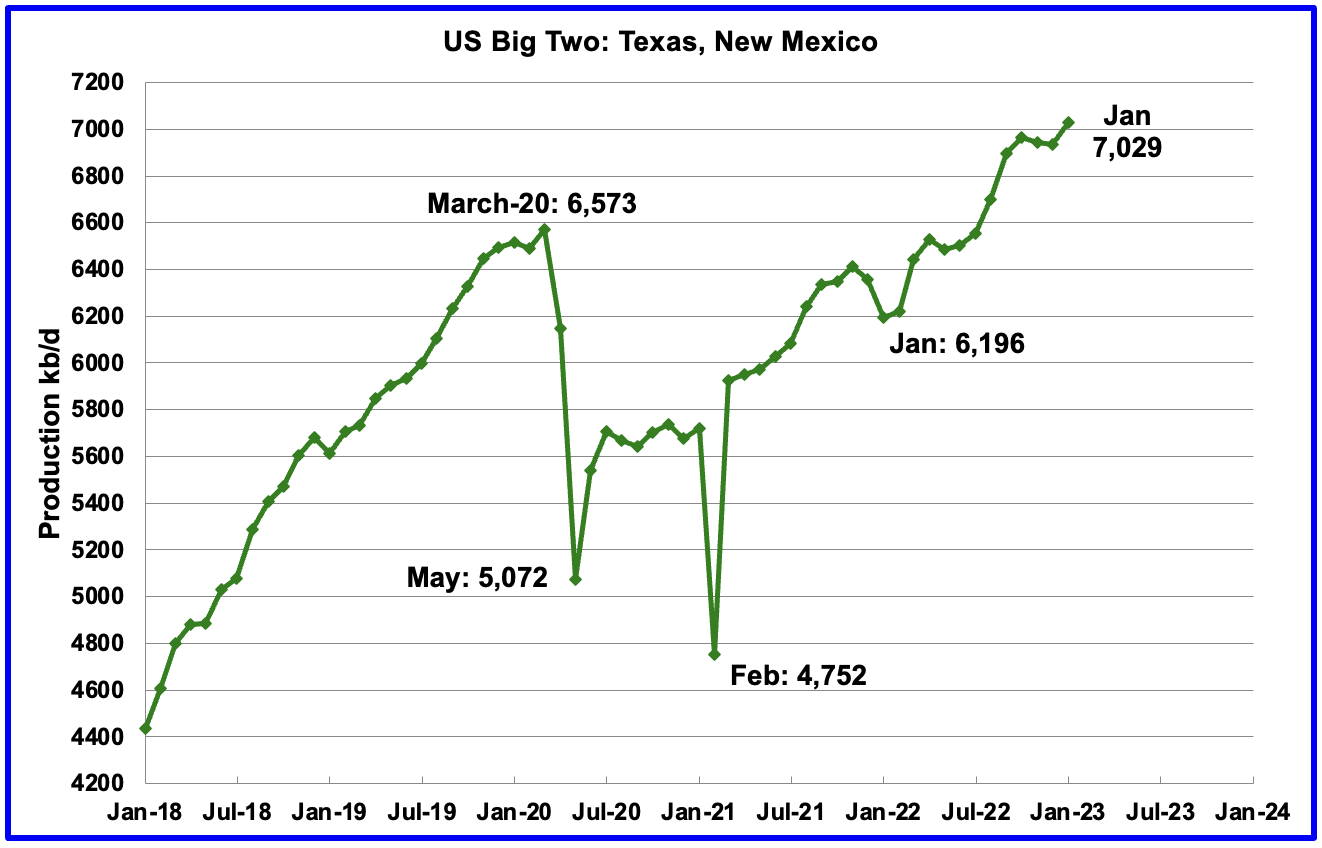
The Big Two states, combined oil output for Texas and New Mexico.
January's production in the Big Two states increased by a combined 95 kb/d to 7,029 kb/d with Texas contributing 76 kb/d while New Mexico added 19 kb/d.
If the data in the DPR section below is accurate, 25 kb/d of the Texas increase came from the Eagle Ford basin. That would imply that the increase from the Permian was 70 kb/d in January. The DPR data shows that the January Permian output was 65 kb/d, which is fairly close. This may also imply that the slightly older DPR data has been updated and is more accurate than the latest data.
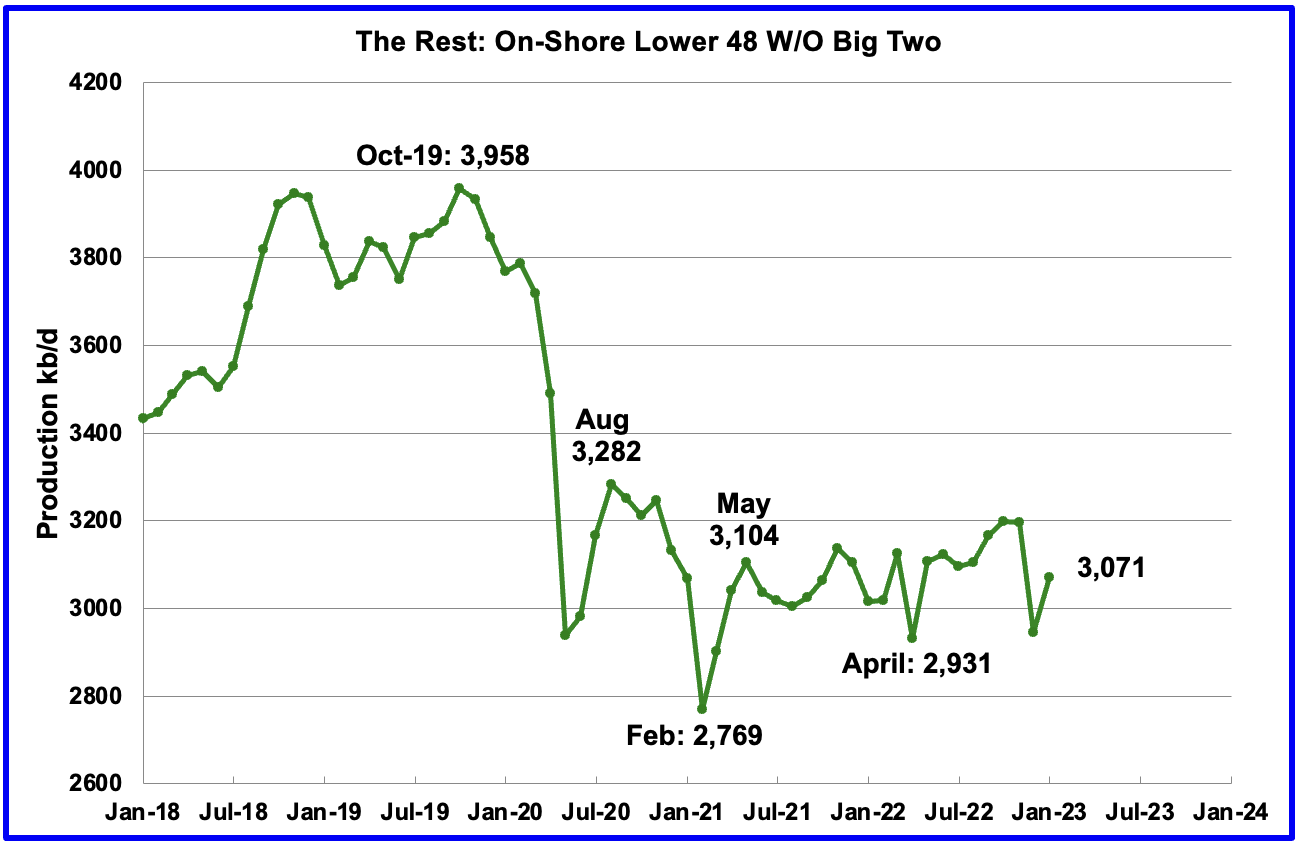
Oil production by The Rest
In January production in The Rest rose by 126 kb/d to 3,071 kb/d. From May 2021, oil production in The Rest has primarily stayed in the range of 3,000 kb/d to 3,200 kb/d and has not given any clear indication of being in decline or rising.
The main takeaway from The Rest chart is that current production is 881 kb/d below the high of October 2019. The question we need answered is "Is this a permanent loss that will never be recovered? " All indications continue to be that this is a permanent loss.
Rigs and Fracs
Author
From the beginning of April 2021 through to the week ending July 29, 2022, the US added horizontal oil rigs at a rate of close to 3.76 rigs/wk, orange OLS line, and peaked at 551 rigs in the week ending July 29. However, since then the number of operational rigs has wondered primarily sideways.
A high of 572 rigs were reached in the week ending November 25, 2022. In the week ending March 31, 2023, the number of rigs decreased by 1 to 545 and is down 26 from the recent high of 572.
In the week ending March 31, Permian rigs were unchanged at 337 and Texas rigs increased by 4 to 310. Note that the trend for rigs in the Permian is showing a slow increase from September 2022 and is currently 6 above the high of 331 on July 1, 2022.
Author
For frac spreads, the general trend since the week of January 6, 2023, can best be described as recovering from the slowdown associated with the 2022 Thanksgiving and Christmas holidays. This trend is a repeat of what happened last year. However, there is one difference. Last year the recovery took place over 9 weeks while this year it has taken 13 weeks so far. How far above 300 will the Frac count get in 2023?
For the week ending March 31, the Frac count increased by 5 to 295.
Note that these 295 frac spreads include both gas and oil spreads.
Frac Spread Count
The Frac Spread Count, provided by energy consultancy Primary Vision , measures how many crews across the U.S. are drilling wells in preparation for hydraulic fracturing of shale, and serves as a simultaneous indicator of the number of wells being drilled, as well as a leading indicator of crude oil production.
Author
Frac spread count for the week of February 11 to February 17.
Author
Frac spread count for the week of February 25 to March 3.
I have been working with the Frac Spread count database recently to try to understand how to use it. Some progress has been made and some initial results are provided in the above two tables. Not sure how useful they are since I think most of the oil experts out there already know what these two tables are showing.
Here is some of the typical information provided in their database, OperatorName, WellName, the vertical distance from a point in the well (usually the current or final depth) to a point at the surface, the total volume of water used as a carrier fluid for the hydraulic fracturing job, etc. Unfortunately, I cannot find any information that identifies an oil spread vs a gas spread. Any information to sort that out would be helpful.
The first table above shows results for the week of February 11 to February 17. The total Frac count is 282, 10 higher than reported officially by Primary Vision. This could be due to double counting or more updated information. Texas and New Mexico had 161 frac spread crews operating during that period. The 161 spreads accounted for 59% of all Frac crews. Eddy and Lea's counties are the hot spots in New Mexico while Midland and Ward are the most active counties in Texas.
The second table shows the results for the week of February 25 to March 3. The total count is 184 which is 92 spreads below the officially reported 276. I assume this is due to late reporting in the database and will update next week to see if the count increases. One of the issues is that the database does not show Frac spreads in progress. It only reports Fracs that have been started and completed.
As in the previous table, Eddy and Lea's counties are the hot spots in New Mexico while Midland, Ward, and Barnes (new) are the most active counties in Texas.
I would be interested in hearing whether there are any other Gems in the two pivot tables.
This morning it was reported that Ovintiv bought EnCap's Permian basin oil assets in a $4.3 billion deal. Interestingly the article states "The assets being bought are located in the Midland portion of the Permian Basin in Texas". At least they are buying in the right county.
Drilling Productivity Report
The Drilling Productivity Report (DPR) uses recent data on the total number of drilling rigs in operation along with estimates of drilling productivity and estimated changes in production from existing oil wells to provide estimated changes in oil production for the principal tight oil regions. The March DPR forecasts production to April 2023 and the following charts are updated to April 2023. The DUC charts are updated to February.
Author
Above is the total oil production projected for April 2023 for the 7 DPR basins that the EIA tracks. Note that DPR production includes both LTO oil and oil from conventional wells.
The March DPR report made significant Downward revisions to the February report, which had already made downward revisions to the January report. For instance, March output was revised down by 211 kb/d from 9,356 kb/d to 9,145 kb/d. The DPR is projecting that oil output for April 2023 will increase by 69 kb/d to 9,214 kb/d, a post-pandemic high. April's output is projected to barely exceed the March 2020 output of 9,206 kb/d by 8 kb/d. The pre-pandemic high was 9,292 kb/d in December 2019.
Author
This chart shows the monthly DPR production increments. What is notable is the reduced month-to-month volatility since January 2022. The January spike is due to the weather-related December oil production drop.
The other thing to notice is the declining monthly increases in the production rate. March's production increase was 86 kb/d while April's increase dropped by 17 to 69 kb/d.
Author
Permian output continues to rise in April. However, the rise is really a drop after incorporating a large downward production revision to the previous post. The April report has downwardly revised March output from 5,682 kb/d to 5,596 kb/d, a drop of 86 kb/d. N ote that April's production is lower than the March estimate (red markers) from the previous post.
If the Permian were part of OPEC, at 5,596 kb/d it would be the second largest producer after Saudi Arabia. April's output is 707 higher than the pre-pandemic high of 4,915 kb/d.
During February , 435 wells were drilled and 433 were completed in the Permian. (Note that February is the latest month for DUC information). The completed wells added 370 kb/d/well to February's output for an average of 855 b/d/well. The overall decline was 335 kb/d which resulted in a net increase for Permian output of 35 kb/d. Of the 433 completed wells, 391 were required to offset the decline.
Note, this is the second month in which no DUCs were used in the Permian, actually, two were added.
Author
This chart shows the average first-month total production from Permian wells tracked on a monthly basis. Assuming the latest information is correct, total monthly production from the newest Permian wells in April continues to be at the 370 kb/d level. Part of the flat production shown is related to an essentially unchanging number of wells being completed, currently hovering slightly over 430 for the last 4 months.
This production level could drop over the coming months if oil prices stay close to $70/b, according to this source .
"The US shale patch may lose as much as 20% of its activity over the next year if energy prices hold at current levels, according to one of the biggest private equity players in the industry.
Crude would need to rise by about 15% to $80 a barrel, and gas would have to climb by more than a third to $3 per million British thermal units for drilling and frack work to maintain its current pace, Quantum Energy Partners Chief Executive Officer Wil VanLoh said in an interview Tuesday. Oil and natural gas prices have slid since mid-2022 on fears of a global economic slowdown."
Author
Output in the Eagle Ford basin has been in a generally flat trend since March 2021. However, since the December 2022 weather-induced drop, production has been increasing. April output is expected to increase by 9 kb/d to 1,132 kb/d and is back to the same output as in August 2020.
At the beginning of the year 2023, 68 rigs were operating in the Eagle Ford basin and continued at 68 in March.
Author
The DPR forecasts Bakken output in April will be 1,163 kb/d an increase of 18 kb/d over March. Production from January onward looks optimistic/wrong and increasing linearly.
The North Dakota Department of Mineral Resources is reporting January Bakken production as 1,023 kb/d while the DPR is reporting 1,089 kb/d . See next chart
Author
North Dakota Bakken production rebounded by 99 kb/d to 1,023 kb/d in January.
Author
Output in Niobrara continues to increase slowly. April output increased by 2 kb/d and set a post-pandemic high of 667 kb/d. It should be noted that the LTO report in the next section indicates no LTO growth in output over the last three months in the Niobrara basin .
Production increased due to the addition of more rigs into the basin. The Niobrara had a peak of 19 rigs operating in November 2022. In March 2023, the count had decreased to 15.
DUCs and Drilled Wells
Author
The number of DUCs available for completion in the Permian and the four major DPR oil basins has fallen every month since July 2020 but that trend has now reversed. In December 2022 the trend for total DUCs changed from decreasing to increasing. February added 5 DUCs . The biggest increase came from Niobrara where DUCs increased by 10 while Eagle Ford DUCs dropped by 8.
In the Permian, the falling trend in DUCs has also changed. December was the first month since mid-2020 when the number of DUCs increased. February Permian DUCs increased by 2 to 1,044 because 435 wells were drilled and 433 were completed. Since the low of 1,037 DUCs in November 2022, the Permian DUC count has increased by 7 to 1,044.
Author
In these 4 basins, 744 wells were drilled while 739 were completed for a net increase of 5 DUCs in February.
Author
In the Permian, the monthly completion rate has been showing signs of slowing since the October high of 457. This is consistent with the frac spread chart shown above where there has been little growth in frac spreads since February 2022. The number of wells drilled in the Permian has been showing a slightly increasing trend since October but is now showing signs of plateauing at the 435 level.
In February 433 wells were completed, unchanged from January and 22 fewer than in October. During February, 435 new wells were drilled, a decrease of 2 From January. The gap between drilled and completed wells in the Permian has now essentially vanished. This raises a question. Since the producers would be completing the best wells, does this imply that most of the remaining 1,044 Permian DUCs are Dead DUCs ?
It also raises another question. Were those extra 2 wells that were drilled, DUDs that became dead DUCs?
February Light Tight Oil Update
The EIA's LTO database provides information on LTO production from seven tight oil basins and a few smaller ones. The March 2023 report updates tight oil production to February 2023.
This is the seventh LTO report published since it was updated due to operational issues. The current update has made significant Upward revisions to the production reported in the previous February LTO report.
Author
According to the March LTO report, February's LTO output increased by 61 kb/d to 8,180 kb/d. However, the January 2023 output in the March LTO report was revised up to 8,119 kb/d from 8,022 kb/d reported in the February report, an upward revision of 97 kb/d.
The red OLS line from March 2022 to January 2023 indicates a monthly production increase of 38.1 kb/d/mth.
Author
February's Permian output increased by 46 kb/d to 5,017 kb/d and is 718 kb/d higher than the high of 4,299 kb/d recorded in March 2020. The January 2023 output of 4,803 kb/d in the February LTO report was revised up to 4,971 kb/d in the March LTO report, an upward revision of 168 kb/d. Most of the revision noted above for the LTO Total output is due to the Permian revision.
The red OLS line from March 2022 to February 2023 indicates a monthly production increase of 40.0 kb/d/mth.
Author
Bakken's February LTO output decreased by 3 kb/d to 1,090 kb/d. Consistent with the Permian basin's output, last month's January output was revised up by 40 kb/d.
Author
Production in the Eagle Ford basin increased by 9 kb/d in February to 896 kb/d and is now 118 kb/d lower than the post-pandemic August 2020 high of 1,014 kb/d.
In February 2022, 45 rigs were operational in the Eagle Ford basin. By February 2023, the rig count had risen to 68.
Author
Production in Niobrara since November has shown little growth. Output has been essentially flat at 450 kb/d.
Onshore L48 Conventional Production
Author
Conventional oil output in the Onshore L48 dropped by 112 kb/d in February to 1,789 kb/d and is more in line with estimates prior to July 2022 . This estimate is based on a combination of the expected February LTO output and the expected February Onshore L48 output reported by the STEO.
The big production drop from October is due to ongoing major revisions to the monthly LTO report. Note that the conventional oil estimate comes from subtracting two large numbers and is quite a volatile month to month due to revisions.
WTI
Author
In the last post the following statement was made, "WTI appears to be making a strong bottom since the low of $71.02/b on December 9, 2022". Then the Banking Crisis hit and a new low was established within a few days. On May 17th WTI settled at $66.74/b.
Following the banking crisis and oil price drop, OPEC +, over the April 1, 2023 weekend, shocked markets by announcing further production cuts of about 1.16 Mb/d. On Monday, April 3, WTI settled at $80.42/b after adding a one-day rise of $4.75/b. Is it a coincidence that the close to 1 Mb/d cut was set to offset the supposed 1 Mb/d buyback for the SPR which the administration had promised but then Energy Secretary Jennifer Granholm announced it would take years to happen?
The big question appears to be why did they do it now. If demand is strong, they wouldn't need to cut. On the other hand, some think the financial side of the oil trade caused the price to drop due to fear of recession which led to traders creating a large short position. The production cut forced the shorts to cover.
It should be noted that OPEC's current production of 28.9 Mb/d is 0.15 Mb/d above world demand for Q1 and 0.3 Mb/d above world demand for Q2. These are two typical week quarters. In Q4-23, OPEC is projecting demand of 30.1 Mb/d, 1.2 Mb/d above the current reported February production. Maybe these estimates will be revised next month.
Editor's Note: The summary bullets for this article were chosen by Seeking Alpha editors.
For further details see:
U.S. January Oil Production At Post Pandemic High