QQQ - U.S. Market Performance Vs. Indian Market Highs Highlight Market Player Evolution
2024-01-17 14:59:37 ET
Summary
- India's equity indices recently achieved all-time highs on the back of nearly steady growth over three decades while exhibiting very strong ratio discipline.
- Over the past six years, it is increasingly evident that the forward outlook is essentially being eclipsed by divergent market player behavior in American bourses.
- While traded volumes in Indian bourses show sustained uptrends, American bourses show a certain stickiness to valuations imputed by special events such as rollovers and rebalances.
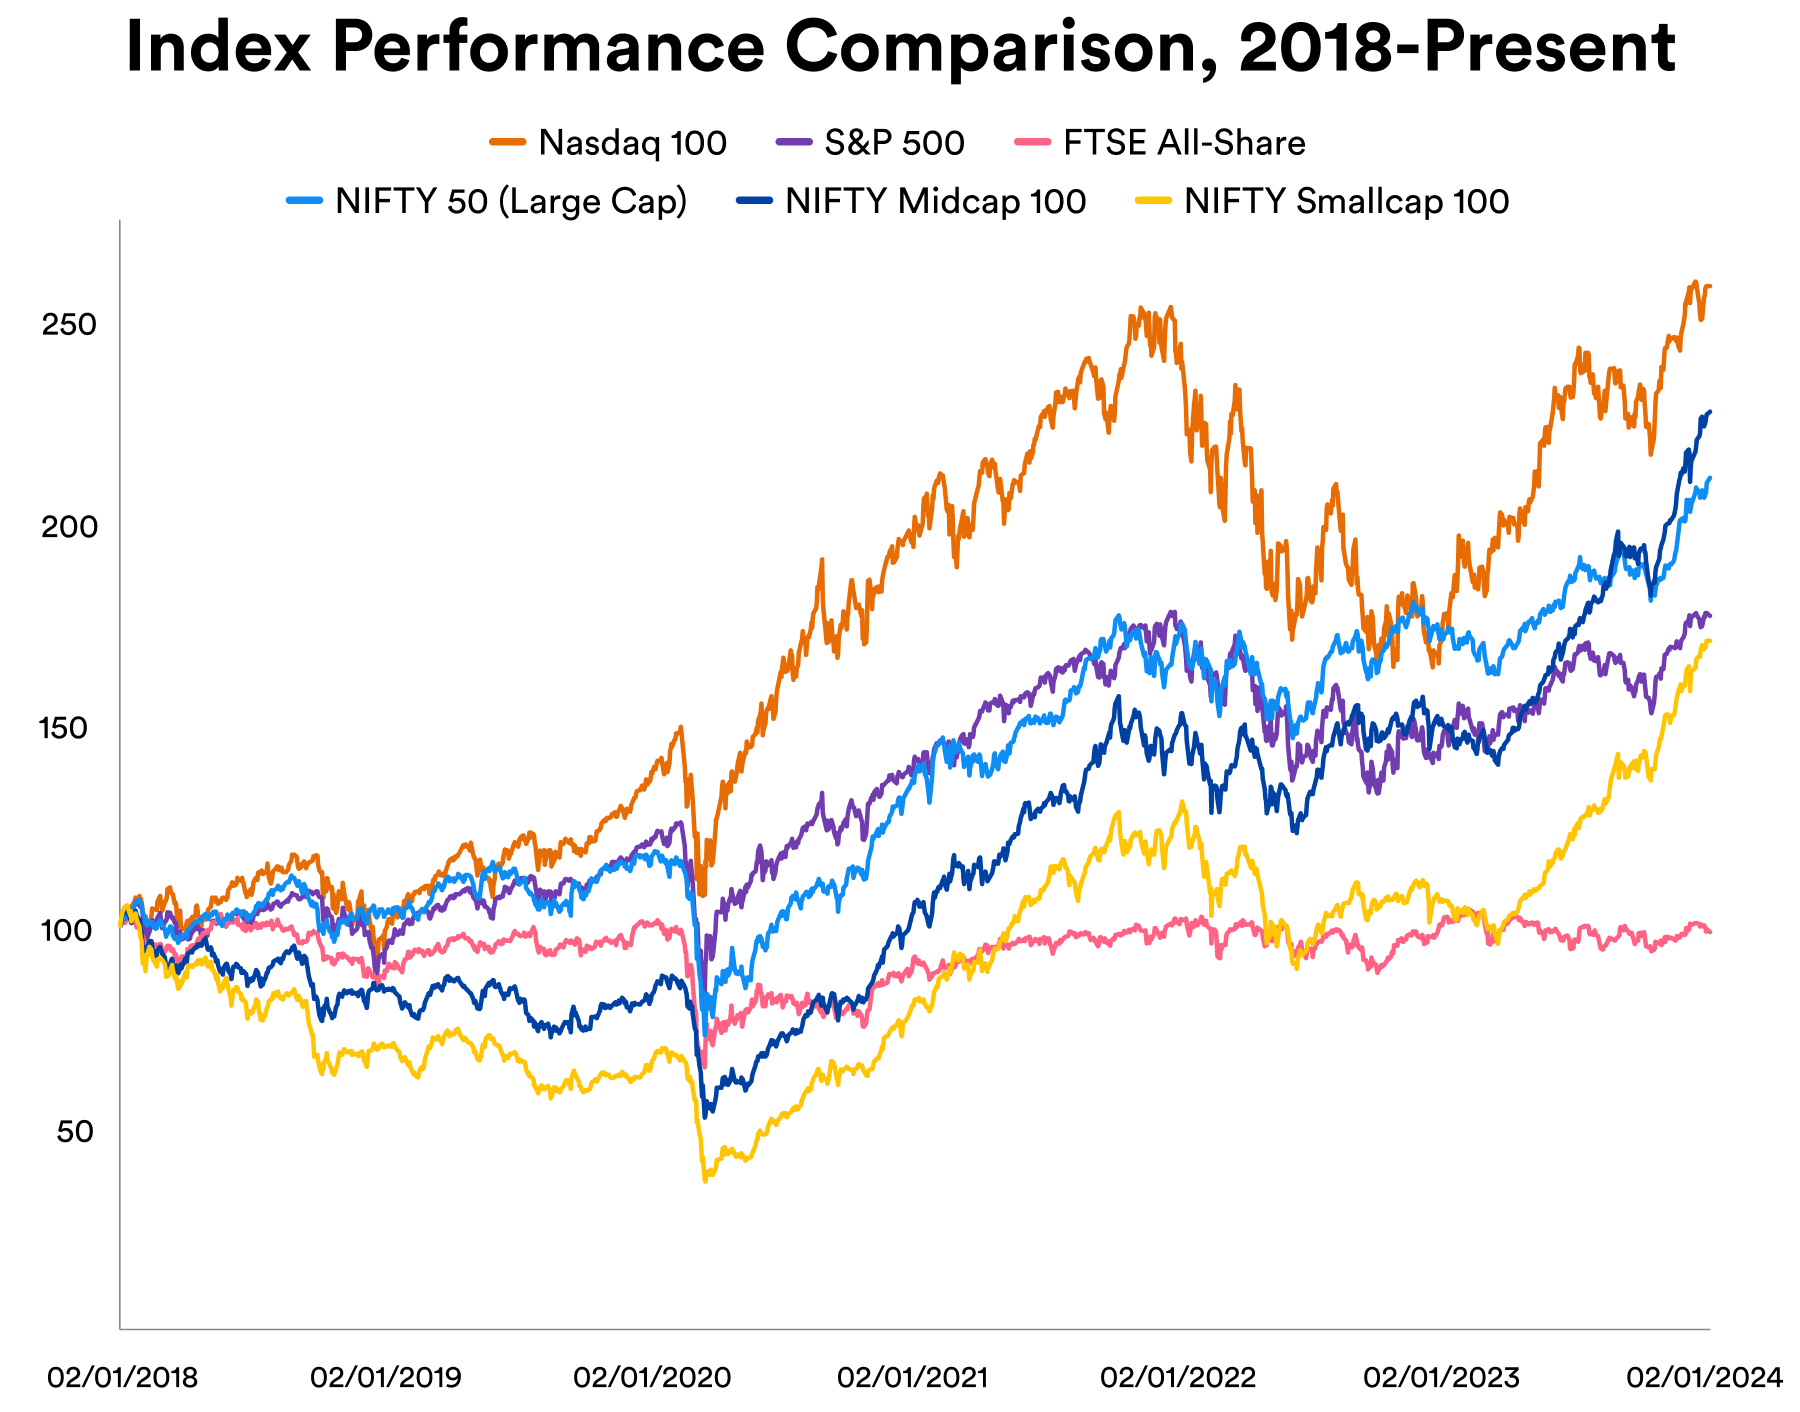
On the 12th of January, India's equity markets scored yet another all-time high driven by a bevy of Information Technology ((IT)) stocks posting an encouraging forward outlook and over 50 small-cap stocks logging a double-digit percentage rise in their stock prices in the course of a single week. On a 6-year basis, i.e., from the start of 2018 till the present, the relative performance can be laid out to show that this was no flash in the pan. Between the U.S. Nasdaq 100-Index ( NDX in index form and QQQ in ETF form) and S&P 500 (SP500, SPX in index form and SPY in ETF form), the United Kingdom's FTSE All-Share Index and India's NIFTY 50 index ( NIFTY ), NIFTY Midcap 100 index, and NIFTY Smallcap 100, the Indian midcap and large cap (i.e., the NIFTY 50) indices come second and third to the Nasdaq 100.
Source: Created by Sandeep G. Rao using data from Bloomberg
Furthermore, the small cap index is presently poised to overtake the broad-market S&P 500.
Some market watchers attribute this rise to foreign fund inflows; in fact, it was reported earlier that 2023 saw Indian ETFs attracting record levels of inflows , including from "foreign portfolio buyers" (FPIs). A deeper look, however, indicates that this isn't necessarily the case for a profound reason: not all market players behave the same way everywhere.
The Ratio Play: A Closer Look
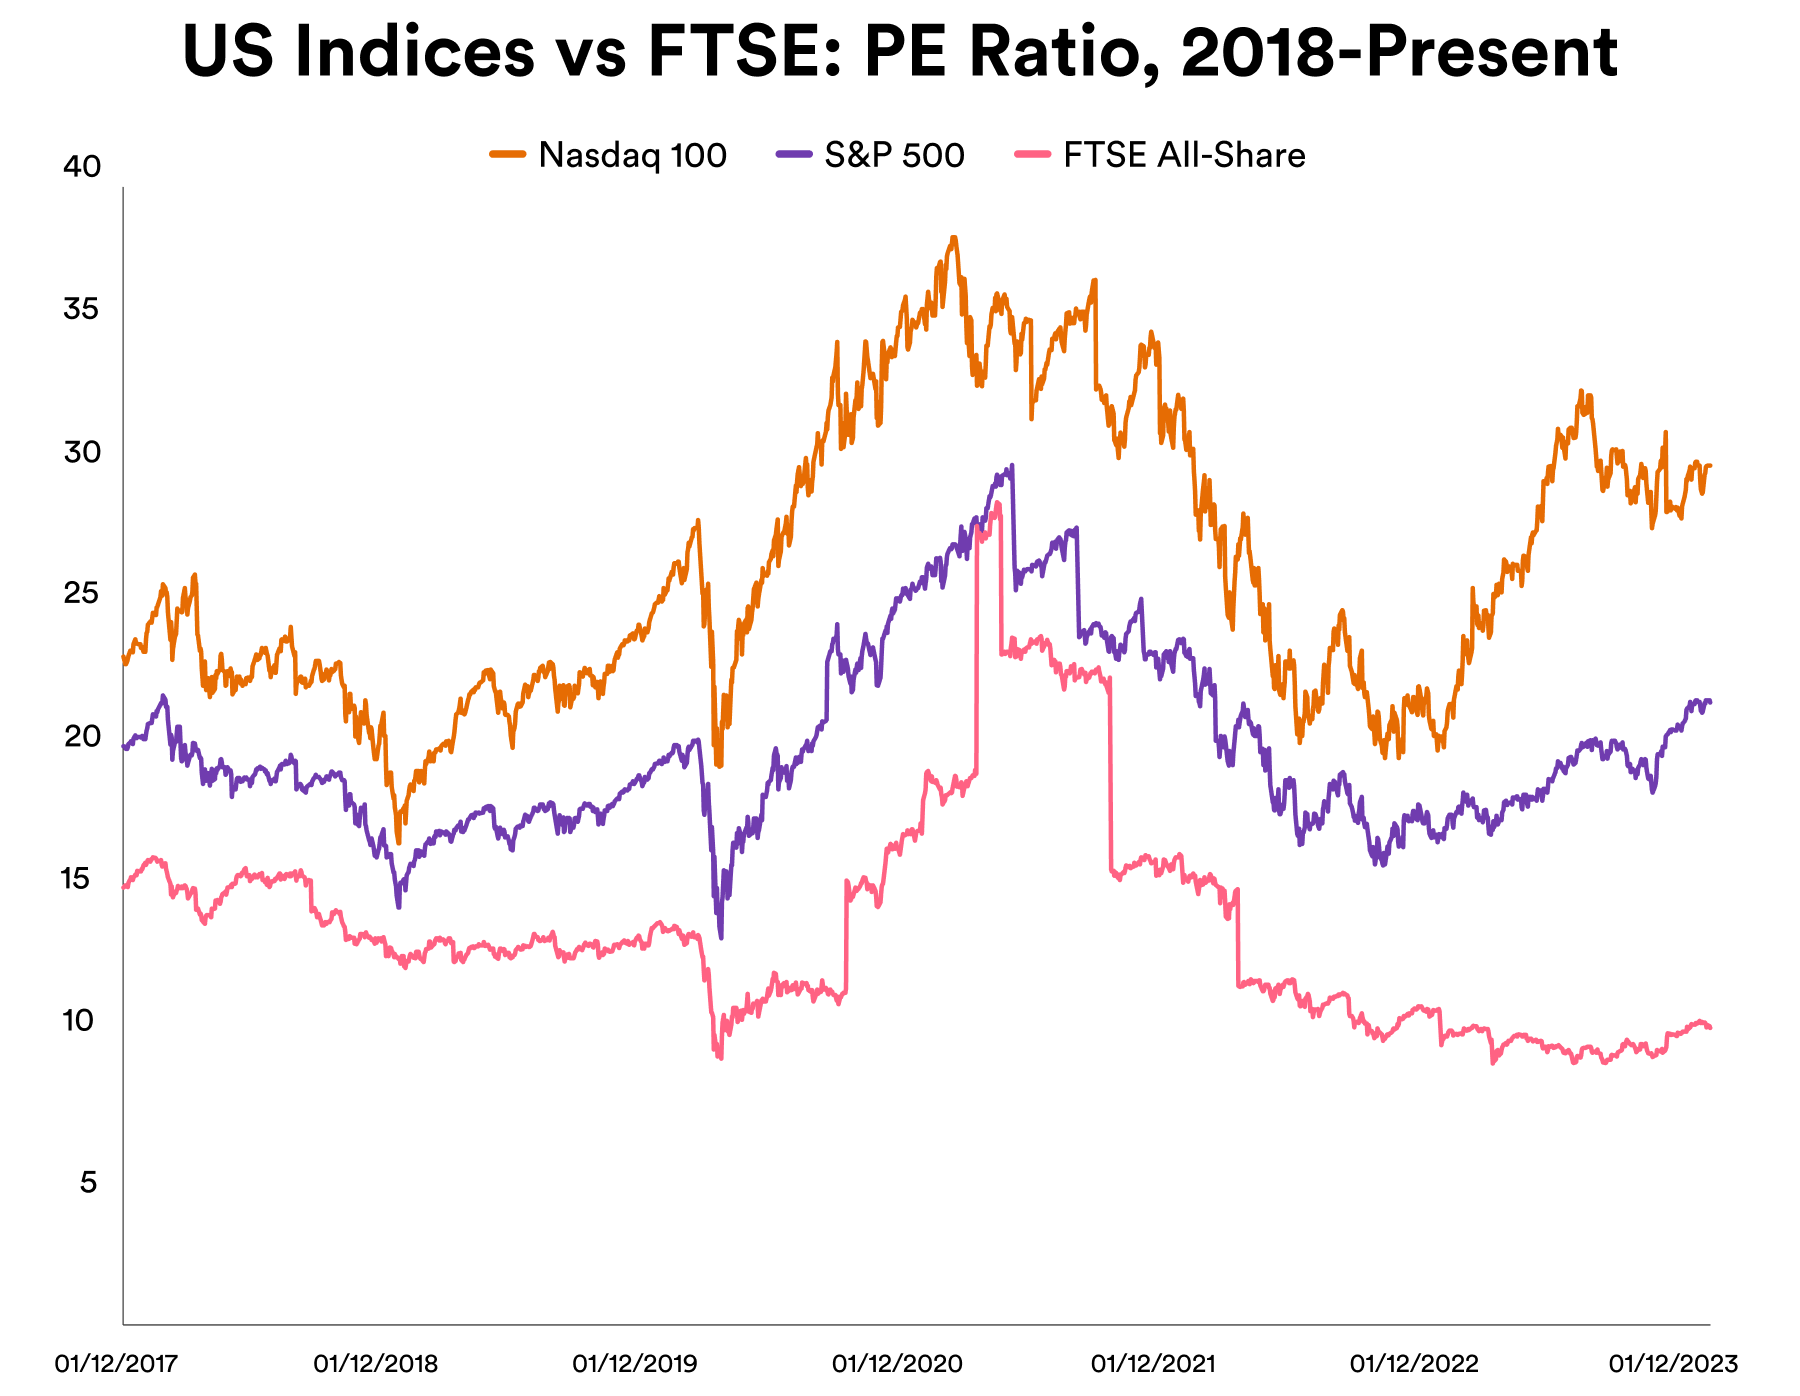
A key diagnostic for considering overvaluation lies in the consideration of price ratio evolution. Taking just one ratio - the Price-to-Earnings ((PE)) Ratio - for a demonstration, it's immediately apparent that three Western indices show a marked level of similarity in overall trends in the 6-year period.
Source: Created by Sandeep G. Rao using data from Bloomberg
Up until mid-2022, the British index exhibited roughly similar trends as its U.S. counterparts before trending down after the British government launched measures to combat the affordability crisis and the impact of the Russo-Ukrainian conflict was factored in. While the U.S. too is currently in the midst of an elevated rate cycle to mop up cash and funnel it into now-attractive fixed income instruments, the effects on the American indices have not been as debilitating: the P/E Ratios have, in fact, been climbing in fits and starts .
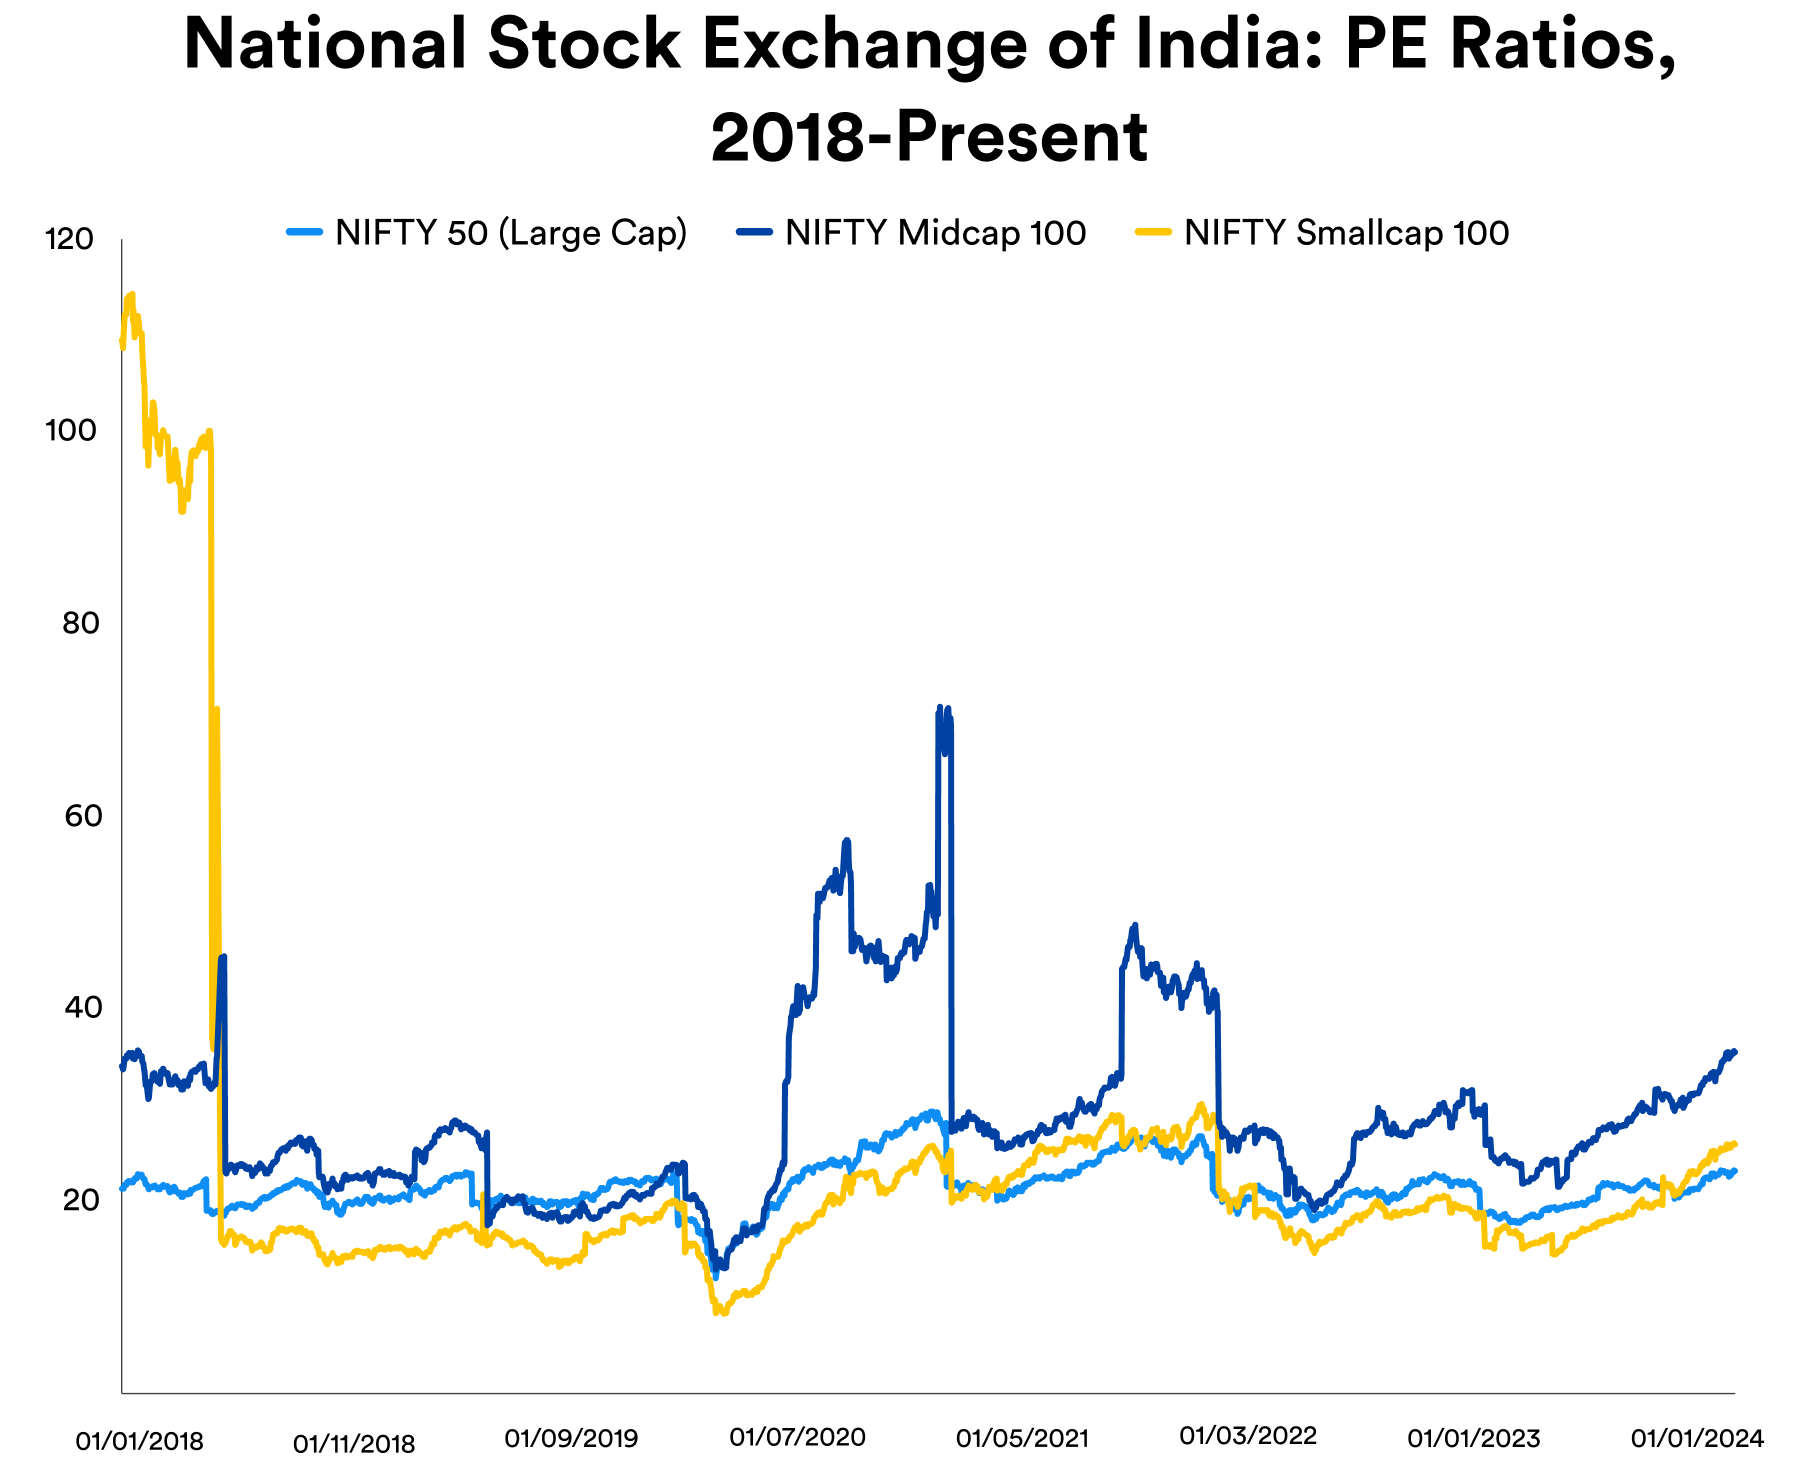
The Indian indices' P/E Ratios, on the other hand, have been charting a different story since 2018.
Source: Created by Sandeep G. Rao using data from Bloomberg
Of the three, the "FPI-favorite" NIFTY 50 was historically the most stable option. Starting circa Q1 2018, the small cap index shed most of its overvaluation and has been broadly trending along the same lines as the NIFTY 50. The midcap continued to show bouts of overvaluation until around Q2 2022 - making it the last index to fall in line (to an extent) with the NIFTY 50.
Since then, with largely steady ratio discipline, Indian equities have been rising on the back of rising domestic consumption of goods and services efficiently translating into rising earnings for producers of said goods and services. With high moats of preference for indigenous goods and services, the biggest beneficiaries of this rise have been Indian companies. This has been a sustained phenomenon: from 1993 till 2023 , the MSCI India Index (which is INDA in ETF form) rose 1,020% while the MSCI China Index rose 30%.
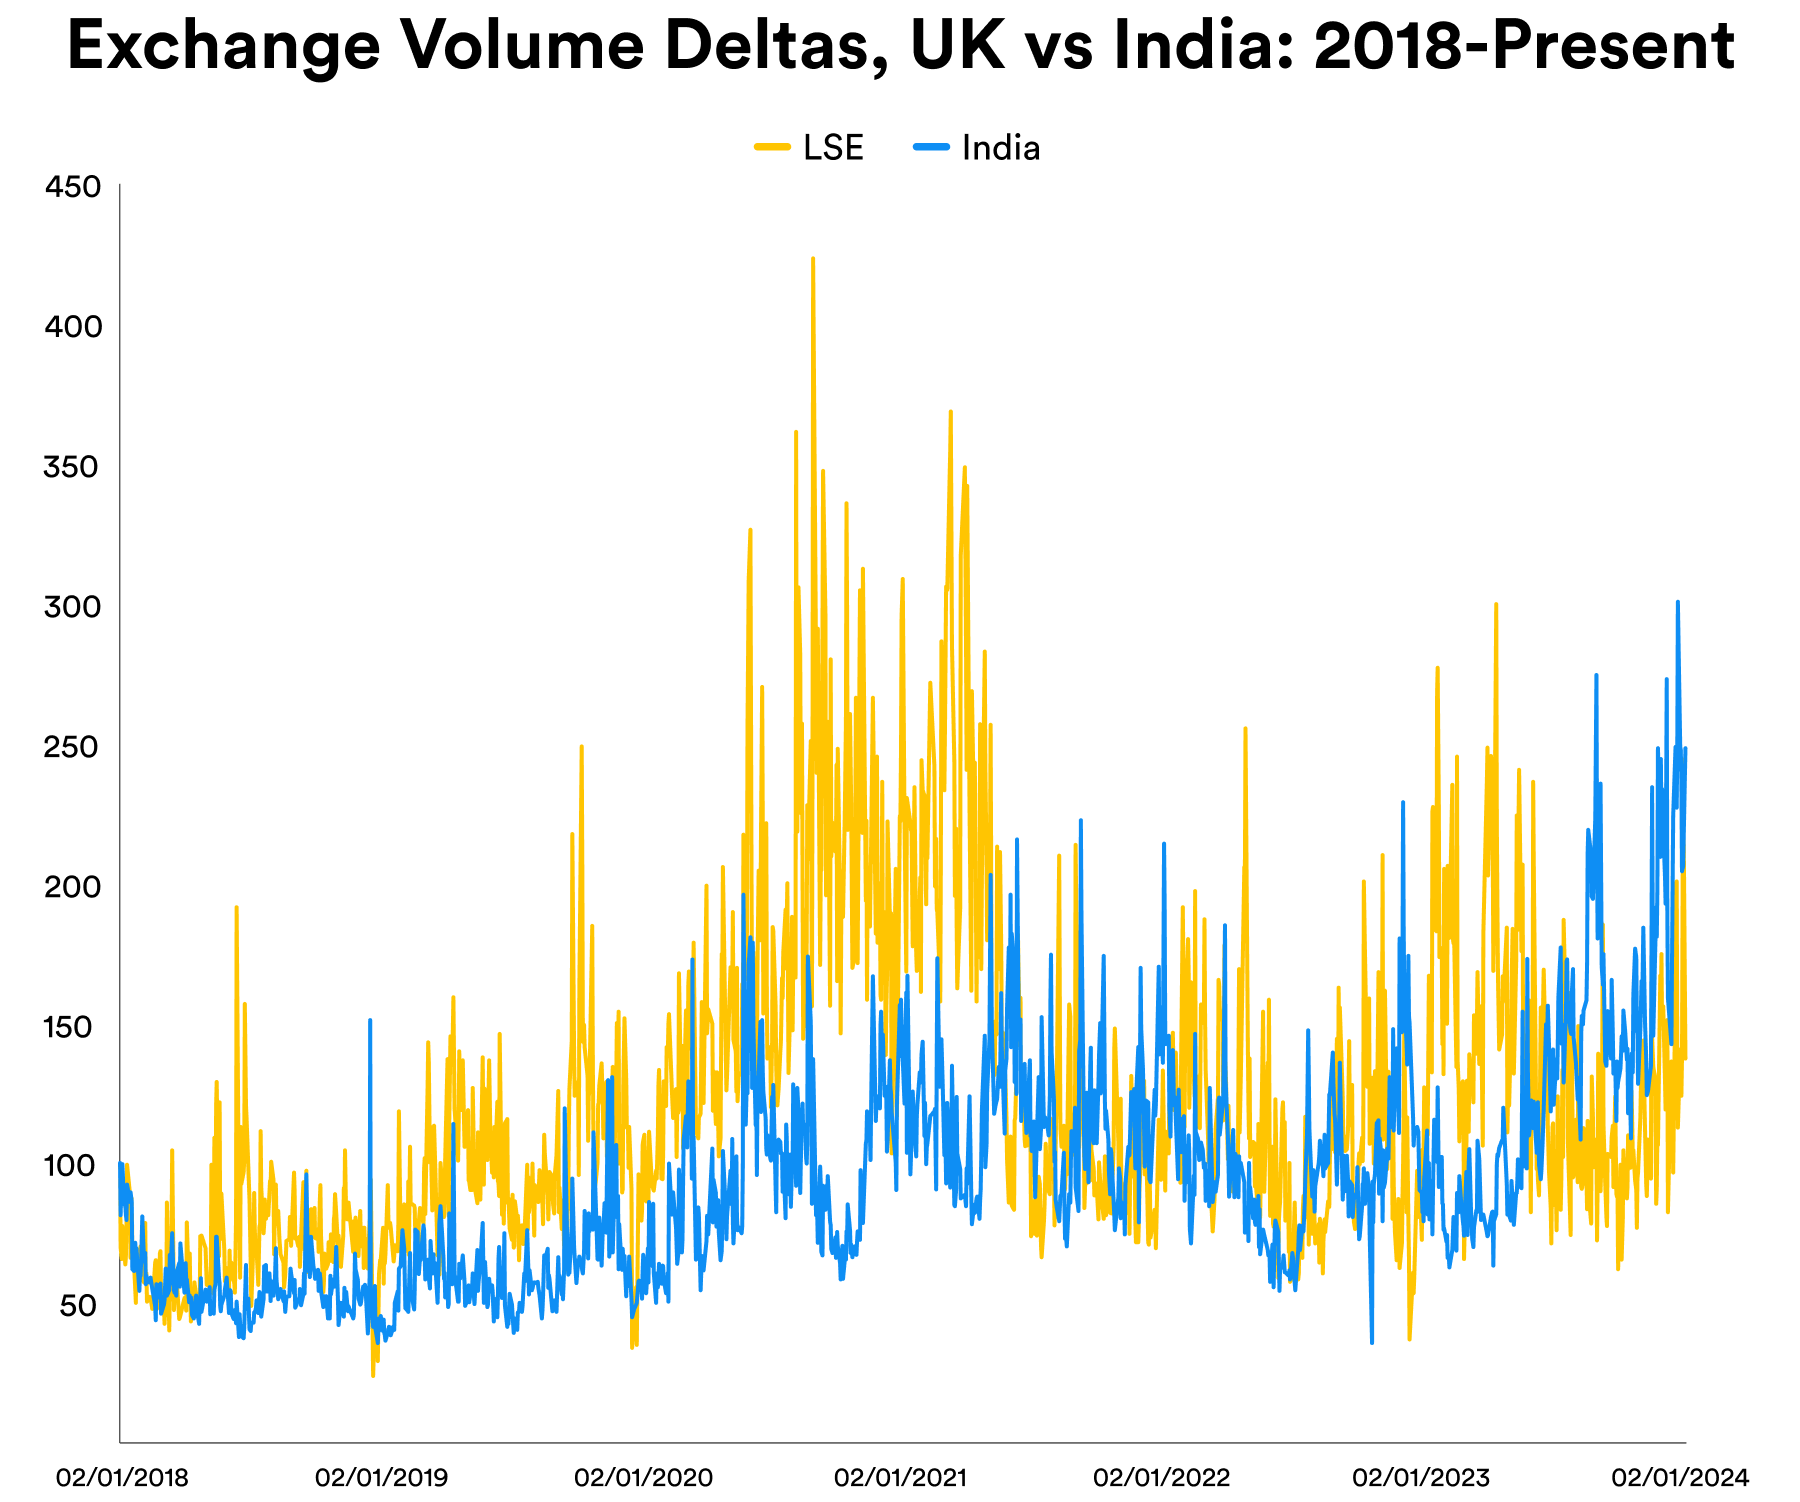
So what drives overvaluation? One predominant factor could be traded volumes. Considering the performance of day-over-day deltas (which would signify rise in market activity), it can be seen that the combined volumes of both Indian bourses - the National Stock Exchange and the Bombay Stock Exchange - versus that of the London Stock Exchange ((LSE))
Source: Created by Sandeep G. Rao using data from Bloomberg
Both British and Indian market participants show rapid spikes and troughs in overall volumes over the course of days, weeks, and months. However, there is an overall trend of more sustained uptrends in the latter than in the former. Over the 6-year period, the Indian bourses have now overtaken London.
Meanwhile, the U.S. exchanges exhibit a very distinct and interesting pattern:
Source: Created by Sandeep G. Rao using data from Bloomberg
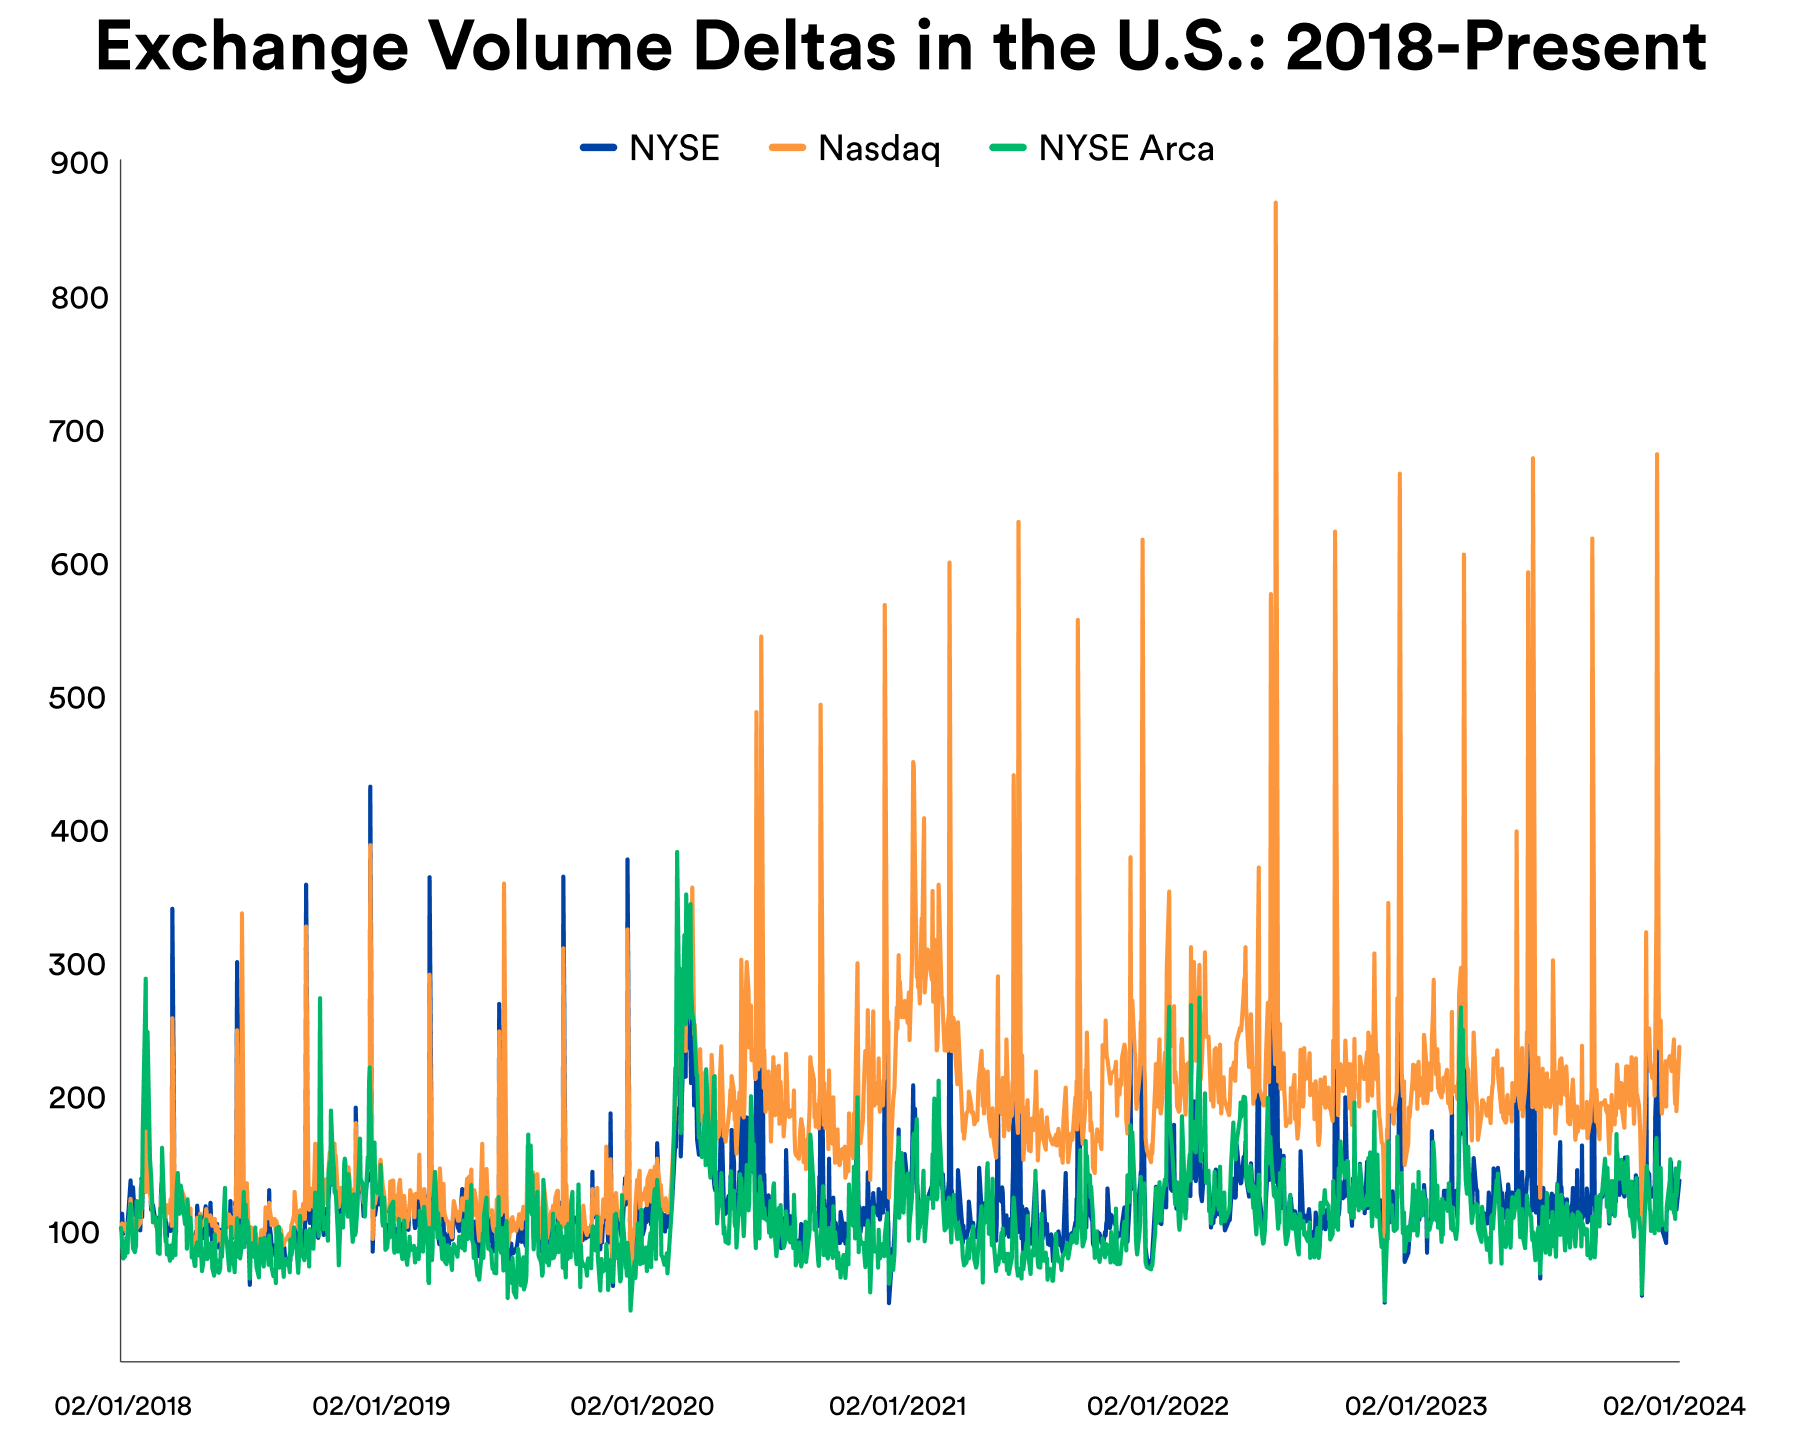
Note: "NYSE Arca" here denotes "Tape C" or regional exchange volumes, most of which is represented now via NYSE Arca.
All exchange volumes tended to be pretty flat right until 2020 when Nasdaq-listed stocks' traded volumes up-trended and stayed elevated over the other two exchange groupings. The large spikes largely coincide with actions around options rollover and index rebalance dates which, since 2020, are dominated by actions involving Nasdaq-listed stocks.
Juxtaposing the exchange volumes over P/E Ratio trends and index levels lead to the following conclusion: while American and British valuations tended to be aligned in valuation trends, the effect of "special events" (such as rollovers and rebalances) on valuations have become more sticky in America (particularly in Nasdaq-listed stocks), thus laying bare a change in market player behavior, with the British and Indian bourses' players exhibiting greater "rationalized" behavior, i.e., a muted reaction to hyped narratives driven by incomplete consideration of data.
It bears noting, however, that the bulk of "non-rationalized" behavior is centered around Nasdaq-listed stocks, which tend to be tech stocks. "Tech" dominates market attention quite heavily, with a select few among them attracting attention to the cost of all other companies' stocks.
In Conclusion
So trenchant is the Indian market players' preference for ratio discipline that on Wednesday, i.e., the 17th of January, a missive by the Reserve Bank of India (the country's central bank) directing banks to increase risk weights on consumer loans led to a rapid correction on bank stocks, followed by a downward adjustment on virtually every other sector barring IT. This correction took place despite every bank posting gains in their most recent quarter and an overall net positive forward outlook. This net positive outlook is a common theme in all other sectors. While a number of other global events have been attributed to this, said events are of little impact to a universe that is increasingly self-contained. Such a scenario is vanishingly rare in today's equity universe in the universe.
Ironically (or perhaps quixotically), this ratio discipline is largely why a large-scale flight of capital from U.S. markets to India isn't likely. While hype may or may not be the leading factor behind compelling overvaluation which leads to volatility, volatility presents tactical opportunities. India's FPI universe is predominantly comprised of institutional long-term growth players seeking a "rationalized" asset mix and not, say, profit-seeking hedge fund from all over the world especially when the country’s financial regulators are prone to lay a heavy hand across an errant player’s back. While lowering "rationalization" in the U.S. bourses might have compelled some flight, it's all within the rubric of adjusting risk.
As the examination of volumes vs. ratios and index levels indicate, the market players' playbook is steadily disaggregating across the world. For the well-trained investor, that translates to more options to diversify.
For the American player, the pent-up lack of market breadth is a sign that sector rotation evident in the past week is likely to continue to pick up steam over the next couple of weeks. However, whether this will lead to a period of sustained and more "rational" behavior isn't necessarily a given. All in all: caveat emptor .
For further details see:
U.S. Market Performance Vs. Indian Market Highs Highlight Market Player Evolution