JHMM - U.S. Quietly Revises Q4 Inflation Up Bombshell January CPI On Deck
Summary
- While the rest of America was gearing up for the Super Bowl Sunday, the Bureau of Labor Statistics revised Q4 inflation numbers higher on Friday.
- This is actually huge news.
- Preprogrammed algos bought billions in stock off of November and December CPI off of faulty assumptions about inflation going away easily, which sparked the huge rally.
- The inflation revisions are a double whammy. Higher inflation not only has implications for Fed policy but also means that corporate profits are worse than they appear as well.
- Handicapping January CPI, the likely path of the Fed funds rate, and what stocks are likely to do in response.
The Inflation Soap Opera Continues
Big news! Quiet revisions to US CPI show that Q4 inflation was higher than we thought. Anyone who has been to a grocery store lately already knows this, but these "soft" inflation numbers were repeatedly trumpeted by Wall Street strategists and politicians as proof of their genius. Now it turns out the numbers were off. Specifically, December month-over-month core CPI was adjusted upward from 0.3% to 0.4%, November core CPI was adjusted from 0.2% to 0.3%, October core CPI was unchanged at 0.3%, and some inflation figures from earlier in 2022 and 2021 were revised as well in both directions. These revisions are a normal part of the inflation-tracking progress for the BLS, but in years past, no one really had to pay attention. So why does this matter now?
Mainly, it implies that inflation is actually running about 1.2% annually more than we thought. This challenges the massive rally in stocks and rosy trader assumptions for what the Fed needs to do to stop runaway consumer price increases. Preprogrammed algorithms bought billions in stocks off of these inflation numbers, which pushed up prices in the hours and days after the CPI reports. Trend-following funds picked up on the bullish bets and piled in behind them. Then retail investors got in on the action as well, buying loads of call options on stocks like Tesla ( TSLA ) and Bed Bath & Beyond ( BBBY ).
It's easy to see how the feedback loop gets going here, and how the Nasdaq ( QQQ ) managed to rally nearly 20% in five weeks, while the S&P 500 ( SPY ) shot up 8% on nothing but sentiment for the year. This face-ripping rally in stocks is on a collision course with January CPI, which will be released at 8:30 a.m. Eastern, Tuesday, Feb. 14.
The problem, of course, is that a bunch of the underlying economic assumptions for this rally turned out to be garbage. Core CPI at 0.4% month-over-month implies an inflation rate running at 4.9% annually rather than 3.6%, and that's before the feedback loop from the monster stock rally and January cost-of-living adjustments. With a single adjustment to the data, most of the disinflation narrative simply melts. A week ago, traders thought inflation was running at about 3.6% annually and on a downtrend, but actually, now we think it's running at about 4.9% annually and either holding steady or increasing.
My inflation articles get a lot of comments from readers, and a lot of them took the time to tell me my modeling was garbage. One told me I'd been wrong on inflation for "three whole months!" With these revisions, however, we now know the model wasn't even wrong. Instead, traders got excited over some numbers that were later reversed, and now stocks are 15% more expensive than they were when these "bullish" inflation numbers started coming out.
January CPI Could Be A Waterloo Moment For Bulls
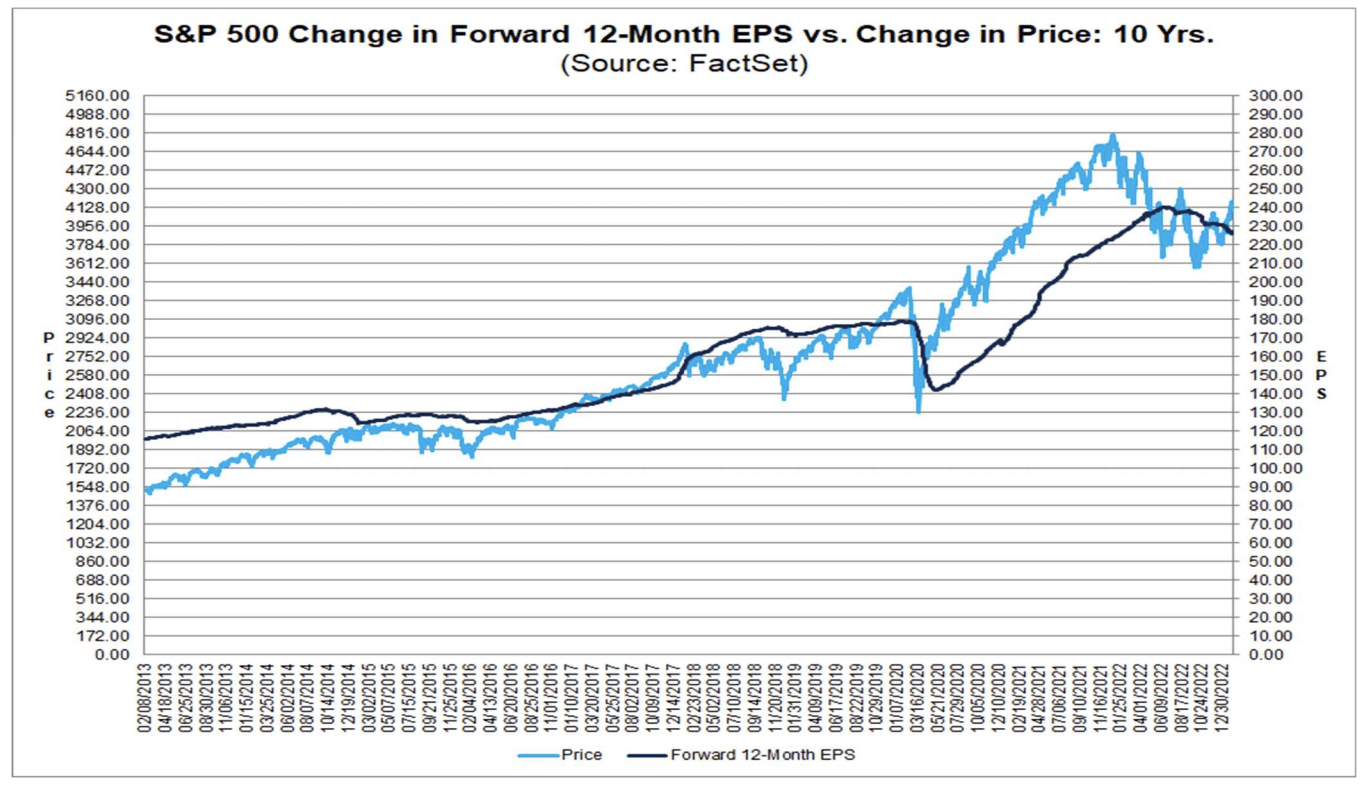
2023 Earnings Estimates (FactSet)
The black line shows that we see earnings estimates steadily being revised lower (i.e. fundamentals). The blue line (i.e. price) says the market doesn't care right now, because the Fed will "pivot," this time is different, or they just have FOMO that their friends made 100% in Tesla last month. Near-term bulls are in trouble here. Stocks are priced for perfection at about 18-18.5x earnings estimates, and those estimates are looking increasingly shaky. One reason these are shaky is that profits are compared with overall inflation to determine profit margins. If inflation is higher than thought, that means profit margins are smaller than thought.
Profit margins continue to shrink back to their historical norms. The main hope for traders here is a Fed pivot (but whether this would actually even help the market trade at a higher multiple than it already does in the long run is debatable). A hot January CPI number would not only shatter the idea of a Fed pivot but would also likely entail the Fed funds rate going to 6% to stop the train. Some options bets are increasingly coming in that the Fed goes to 6% , and it's not hard to see why when looking at the inflation numbers. If the fabled Fed pivot is taken away for 2023, it's hard to see how stocks don't go to new lows here with profits continuing to fall. That's why the core CPI number is such a key test for markets here, and why there's so much downside for bulls if the numbers come in hot.
Where Will January CPI Come In?
Let's handicap January CPI. The estimates for core CPI from economists that I've seen are either 0.3% or 0.4% month over month. What's funny is that these numbers are not that low! 0.4% would mean that there's no appreciable progress on inflation whatsoever and that inflation has accelerated since the October stock market lows. A figure of 0.3% would likely cause traders to believe that inflation is holding steady. Neither of these numbers makes any case for a Fed pivot. But have traders again underestimated inflation?
First, we can look at econometric models. The Cleveland Fed has a good econometric model which estimates 0.46% core CPI inflation for January. The model was a little high in Q4, but much of that was from falling used car prices, quirky adjustments to items like health insurance, and now-revised seasonal adjustments. Recent data shows that used car prices aren't going down anymore and actually rocketed higher in January as fed-up buyers plunged back into the car market. We know that a lot of people get COLA adjustments in January and that a lot of businesses raise prices in January. There's no reason to expect that the inflation numbers will be particularly good this month.
And they weren't for countries that report CPI before the US. Core consumer prices in Spain accelerated to 5.8% in January from 5.5% in December. In Italy, the story was the same , with core inflation accelerating to 6.8% from 6.5% in December. In Germany , core inflation held steady at 5.2% annually. Inflation in Mexico accelerated to 7.9%. Different countries report inflation a bit differently, so you want to look at core numbers when you can. But there's a clear trend of accelerating inflation and core inflation coming in higher than expected across the world in 2023.
Of course, it's possible that January price increases, COLA adjustments, the weaker dollar, and used car prices don't come through until February. But the model and countries that report before the US are telling a scary story on inflation here. My best guess is that month-over-month core CPI is 0.5% or higher and that the S&P 500 breaks back below 4000 within a week.
How Much Should The Fed Hike?
The Fed has so far brushed off the pivot mania rally in stocks, but there are some early indications that they may be back behind the curve. First, the Fed mainly prefers to target PCE rather than CPI, but PCE isn't infallible in itself and also is subject to revisions. If you look at current Fed policy from a macro perspective, what sticks out is that it seems they've tried half-measures first to see if inflation would go away on its own.
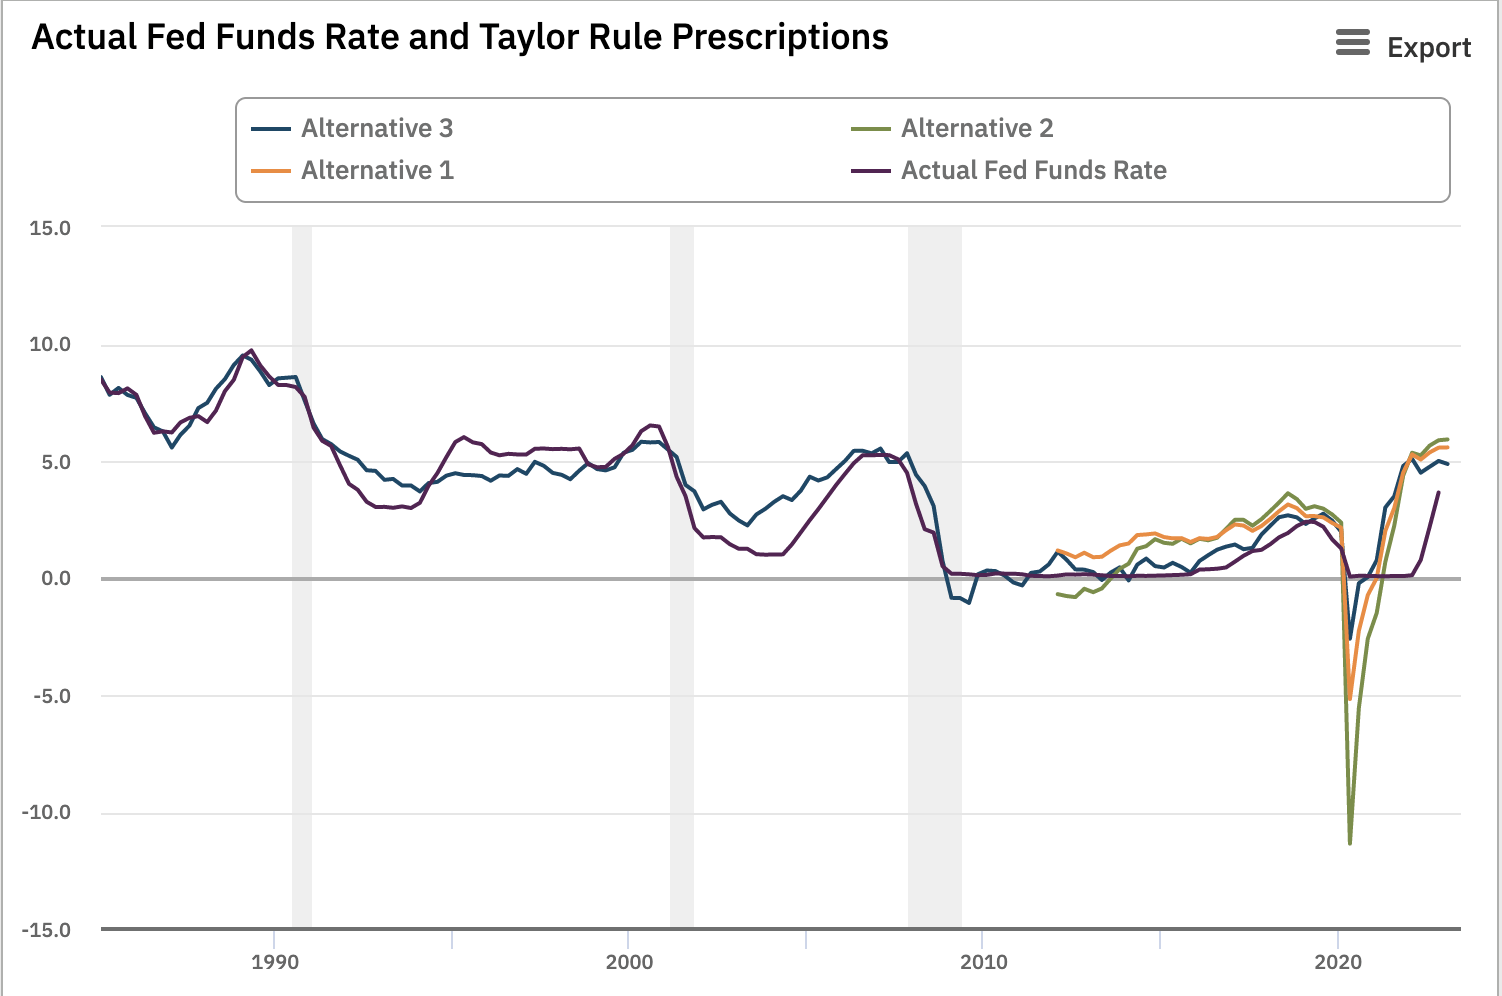
Taylor Rule Vs. Fed Funds Rate (Atlanta Fed)
For example, here's a run of models using the Taylor Rule . One goes back to the 1980s, while the others started only a few years ago. I've added a bit of interest rate smoothing to iron out big fluctuations in recommended rates. Some interesting insights here:
- The Clinton administration raised taxes a lot in 1993, so Greenspan kept rates a bit lower to even out the impact on the economy. This was smart. This caused inflation and growth to perk up, so Greenspan then raised rates in response, achieving a fabled soft landing.
- Greenspan kept policy pretty tight for the rest of the 1990s, offering a nice alternative to investors who didn't trust the soaring stock market (smart again). When he took the Fed funds rate to 6.5% in 2000, the tech bubble finally burst.
- However, Greenspan cut rates lower than macro models suggested was wise in the early 2000s and didn't raise them fast enough to stop a housing bubble from forming. It would have been better to hold rates at 2% or so and let the Bush administration's tax cuts do more of the work because it would have kept money from pouring into housing, and would have spread it among the whole economy instead.
- Monetary policy was more or less flawless from 2006-2012, but the damage was already done by consumers going all-in on housing in the years prior when the Fed kept rates too low for too long.
- Janet Yellen seemed a bit too scared to raise rates in the 2010s, and the economy could have easily handled 1%-2% rates during this time. This didn't have much of an impact either way on the broader economy, but it likely got the bull run in housing started.
- Jay Powell took over the Fed in 2018. He battled the Trump administration, who wanted to cut rates back near zero to stimulate the economy going into the 2020 election. Whatever came of this, Powell's dovish policies started to run into trouble by the fall of 2019 when he cut rates by way more than he should have and tech stocks started to go parabolic.
- COVID hit in 2020, and Powell got back on track. His initial response to the pandemic was spot on according to the Taylor Rule, but should have been ended by Q1 2021. Huge 2021 stimulus checks, unfunded student loan forgiveness, QE, and massive budget deficits were among the biggest deviations from recommended monetary and fiscal policy in contemporary times. In the end, it took only a generation to forget the hard-learned lessons from the 1970s.
- The results were predictably bad. Inflation soared, and even if the Fed plays its cards perfectly from here on out, a housing bust is all but assured now. It's a lose-lose for the Fed because they now have to choose between runaway inflation and a huge housing crash.
- Powell appears to still be behind the curve by 50-100 bps! He should have forced Democrats to finance their 2021 stimulus by going to the bond market rather than monetizing their new borrowing with QE. Powell didn't, which led to another 2000s-esque misallocation of capital in the economy into housing and speculative assets.
Central banking is an art, but it's also a science. Sometimes there are reasons to go against the models, but the bigger the deviations you make from classic economic models like Taylor Rule models, the more trouble you can get in.
What does the Taylor Rule say about current Fed policy?
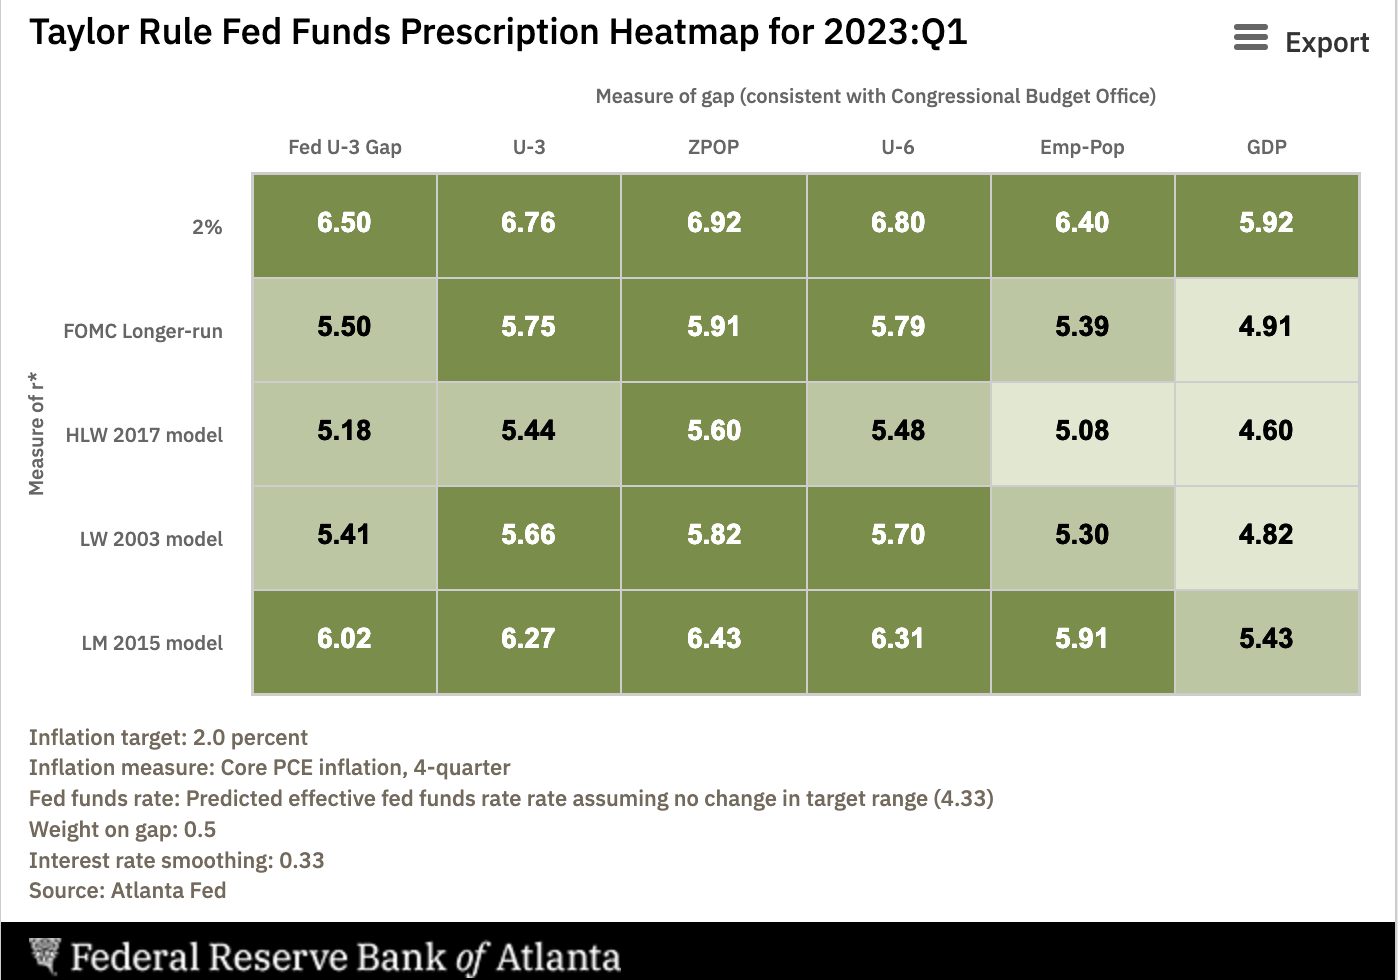
Taylor Rule (Atlanta Fed)
Depending on which version you use, the recommendation is for a Fed funds rate of somewhere between 4.8% and 6.8%. Twenty-nine of 30 numbers on this chart except one is higher than the current Fed funds rate, and most suggest a Fed funds rate of 5.5% to 6%. This isn't rocket science. With core inflation running a bit under 5% annually, rates need to be higher than inflation for at least a good amount of time before the Fed even thinks about cutting. This means the Fed has some work to do, and going to 6% and holding for a year is not at all out of the question if inflation proves stubborn in Q1.
Also not rocket science – if cash pays 5%-6%, stocks probably shouldn't trade for peak cycle multiples of 18-20x earnings (i.e. an earnings yield of 5%). Most professional investors think of their returns in excess of cash because that's the benchmark they're judged on. As cash rates march higher, fewer and fewer investments offer returns in excess of cash. Retail investors can access this "cash" return by placing their funds in popular money market funds by providers like Vanguard and Fidelity.
Key Takeaways
- Recent revisions to Q4 CPI numbers tell us that inflation was worse than thought in 2022.
- Econometric models and countries that report before the US are flashing a warning sign about tomorrow's CPI report.
- Even if inflation comes as expected, stocks are priced for perfection and offer a uniquely small spread in their earnings yield relative to cash.
- If the markets don't cooperate, it's very possible the Fed has to hike to 6% to get inflation under control.
- With the markets all-in on a Fed pivot, continued increases in the Fed funds rate while corporate profits fall will very likely crush the rally in stocks.
For further details see:
U.S. Quietly Revises Q4 Inflation Up, Bombshell January CPI On Deck