UGIC - UGI Corporation: Safe Dividend Yield And Attractive Share Price - Its A Buy
2023-10-18 14:52:22 ET
Summary
- UGI Corporation's share price has experienced volatility, largely influenced by commodity cost pressures due to the Russian invasion of Ukraine.
- Despite a decline in earnings, UGI's dividend payments are expected to continue growing, with a dividend payout ratio in the low 50% range.
- The current share price presents a buying opportunity, with the potential for a rebound and significant growth in the future.
Investment Thesis
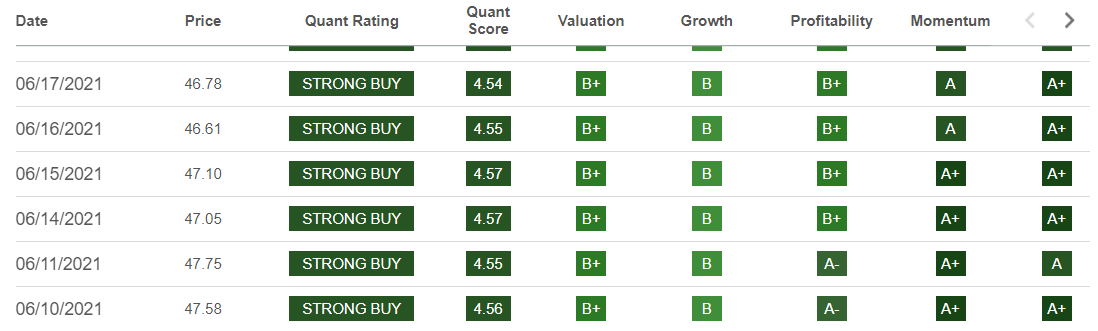
I previously published an article on UGI Corporation (UGI) around market open on June 16, 2021, " UGI Corporation: Still A Strong Buy ", with the share price at $47.04. I was in good company at the time, with Seeking Alpha Quant Rating also a Strong Buy, as per Fig. 1.1 below.
Figure 1.1 UGI Corporation Quant Rating
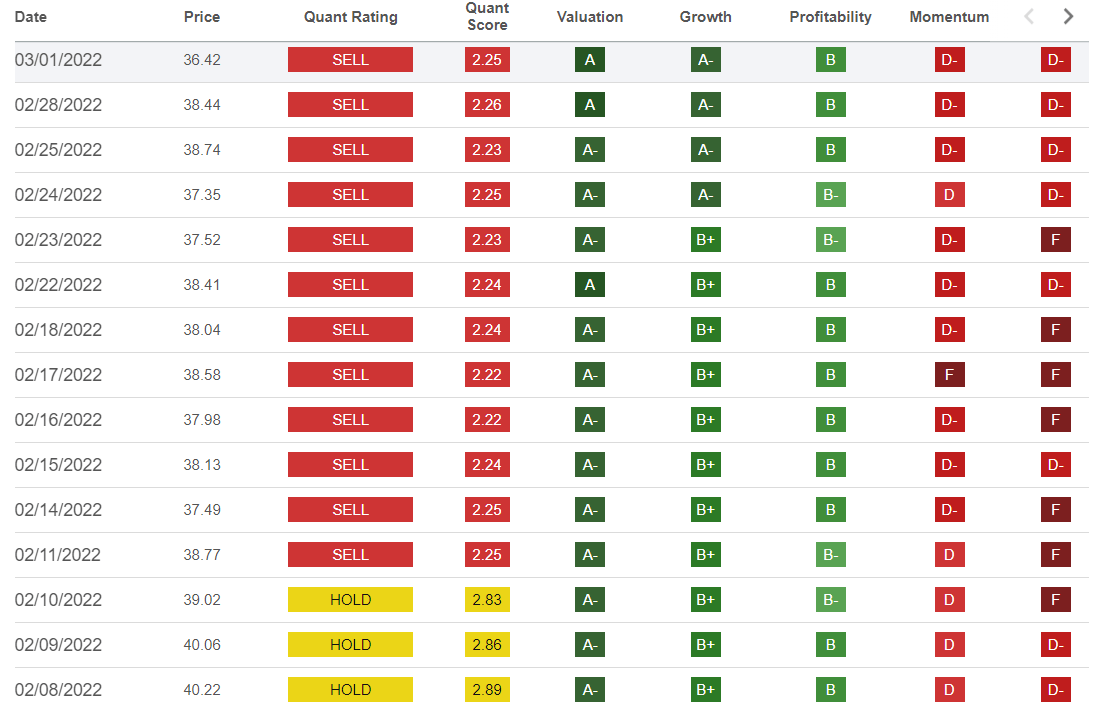
The share price subsequently reached a high of $48.55 on August 16, 2021. Since then, the share price has shown substantial volatility, but has mostly traded in the mid to high $30s and for a considerable amount of time in the $40s. The Russian invasion of Ukraine increased commodity costs for UGI and this put downward pressure on the share price. This caused the Quant ratings to switch to Sell as per Fig, 1.2 below.
Figure 1.2 UGI Corporation Quant Rating
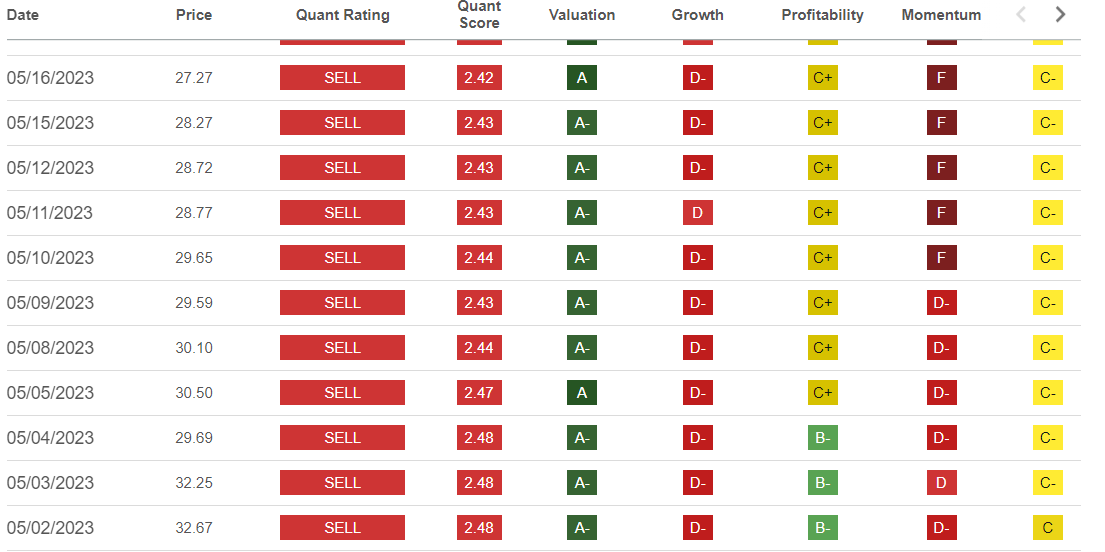
Note the healthy Quant ratings for Valuation, Growth, and Profitability are outweighed by downward Momentum in the share price. However, it was over a year later in May 2023 before the share price broke below $30, as shown in Fig. 1.3 below.
Figure 1.3 UGI Corporation Quant Rating
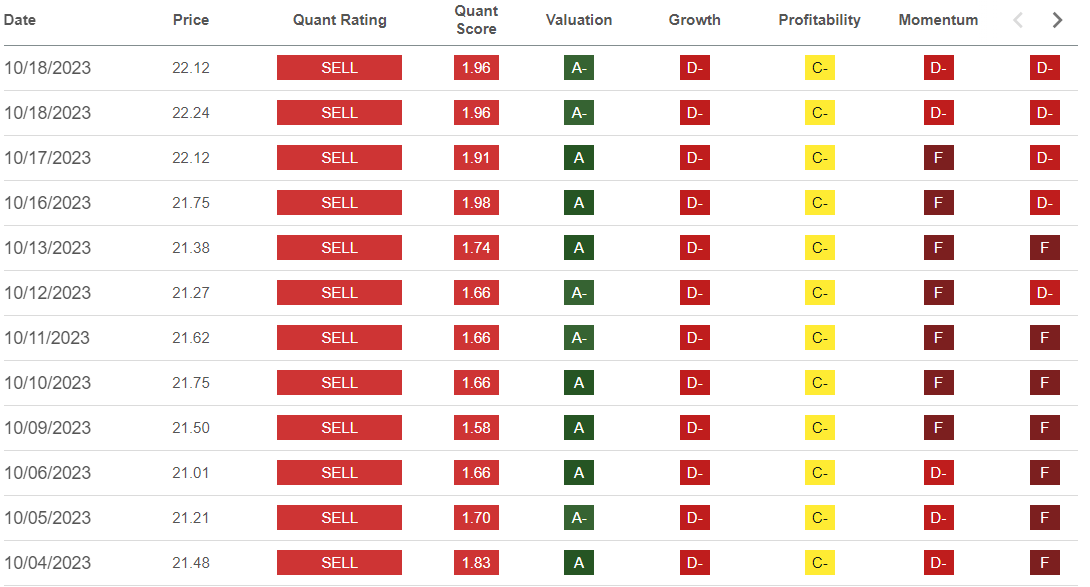
By this time, commodity cost pressures were reflected in results and Quant ratings for both Growth and Profitability had declined, contributing to the Quant Sell rating assessment. The share price has continued to decline to its present level in the low $20s as per Fig. 1.4 below.
Figure 1.4 UGI Corporation Quant Rating
Outlook and conclusion -
UGI is a dividend aristocrat, with 36 years of dividend growth and 139 years of uninterrupted dividend payments. While the company's earnings suffered a setback due to commodity cost pressures in FY 2022 which have continued into 2023, this should not affect dividend payments, as the dividend payout ratio is a little over 50% of the lower earnings. While SA analysts' current non-GAAP consensus EPS estimate for FY 2023 of $2.75 is ~19% below their estimate of $3.41 at the time of my June 2021 article, the share price is ~53% lower and the dividend yield has more than doubled from 2.9% to 6.8%. I believe downward momentum has taken the share price far lower than where it should be today, and a rebound can be expected to occur. That will fix one element of the Quant rating. Earnings in FYE September 2024 will have a lower FYE 2023 base year for comparison purposes and that should result in improvements in Quant ratings for Growth and Profitability, and a change in the overall Quant rating. Of course, as with the Quant rating back in mid-2021, my Strong Buy rating for UGI back in mid-2021 has been overtaken by time and the passage of events, including the Russian invasion of Ukraine, the more than halving of the share price, and of course whatever might be the effect on gas prices of the Israeli-Hamas conflict. But at the present UGI share price and dividend yield, I rate UGI a Buy. A detailed financial analysis providing further support to this rating follows.
Financial Analysis and Comment
Looking for market mispricing of stocks -
What I'm primarily looking for here are instances of market mispricing of stocks due to distortions to many of the usual statistics used for screening stocks for buy/hold/sell decisions. I believe the answer is to compare projections, based on analysts' estimates out to the end of 2024 or later, to past performance. Summarized in Tables 1 and 2 below are the results of compiling and analyzing the data on this basis.
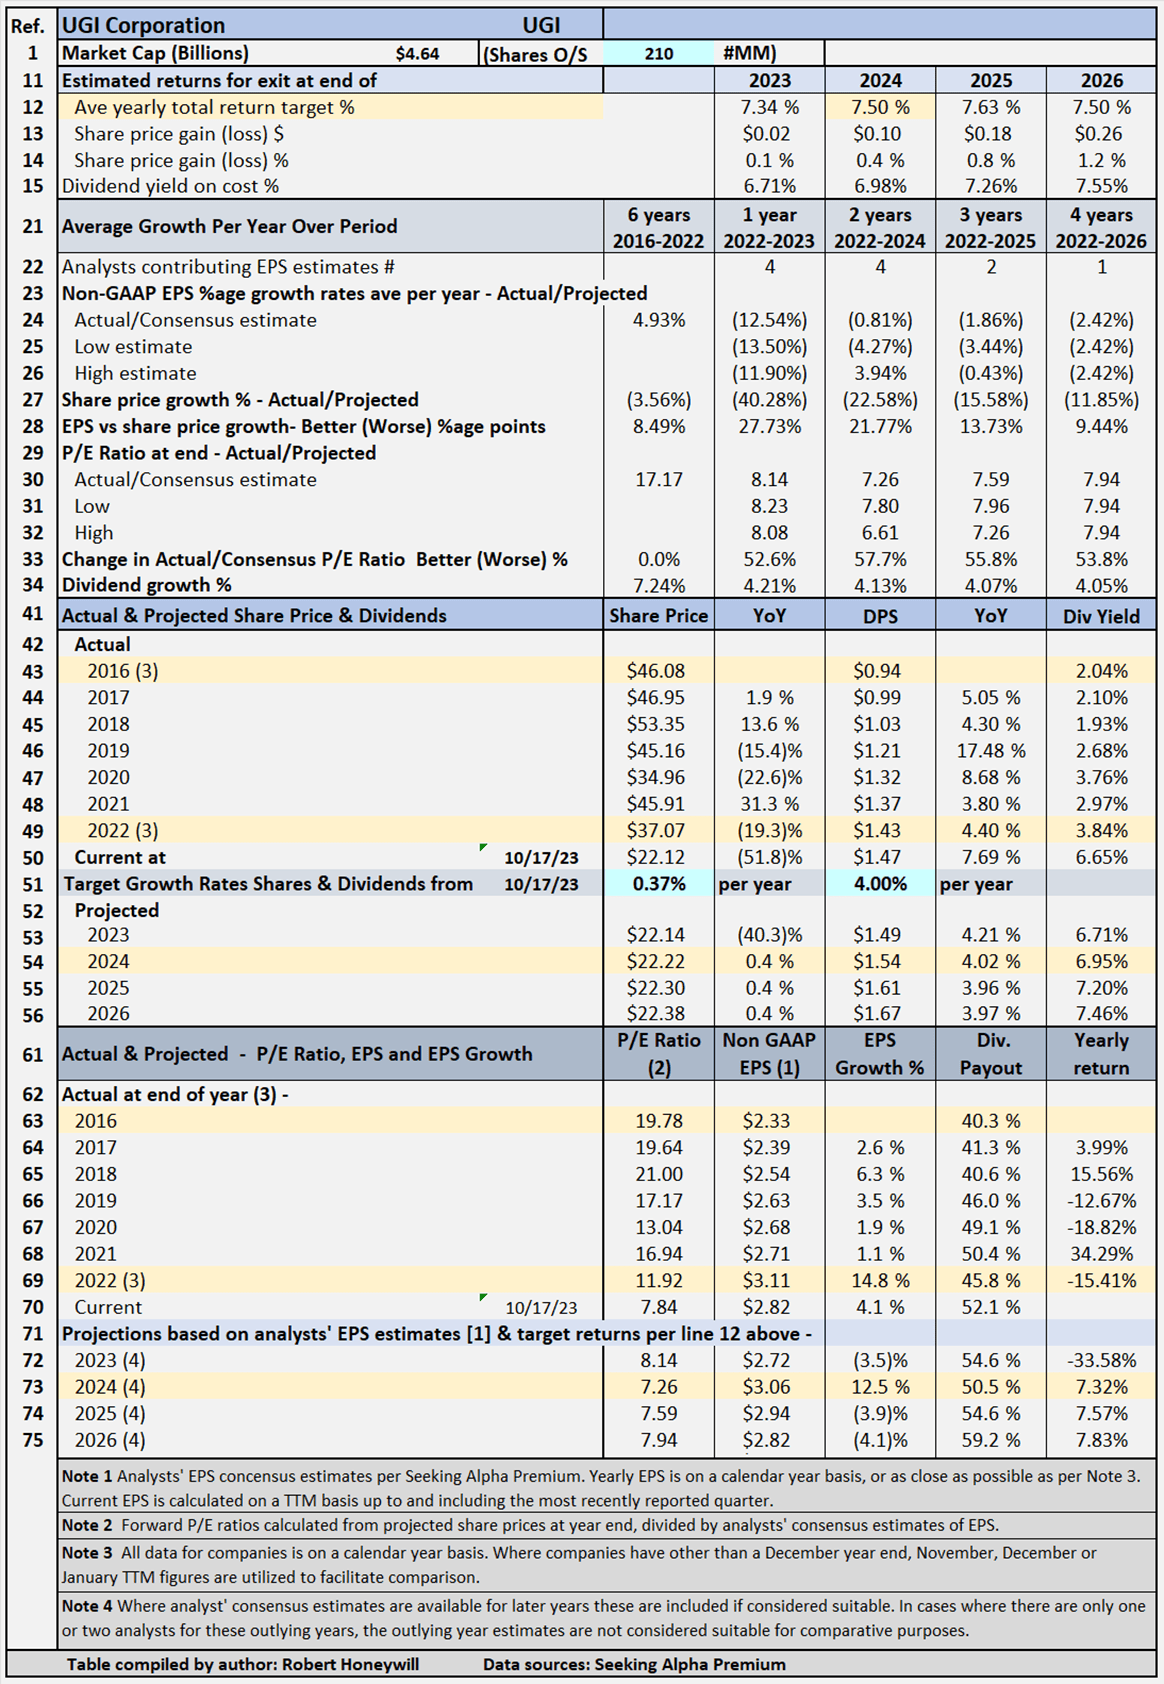
Table 1 - Detailed Financial History And Projections
UGI's Projected Returns Based On Selected Historical P/E Ratios Through End Of 2024
Table 2 below provides scenarios projecting potential returns based on select historical P/E ratios and analysts' consensus, low, and high EPS estimates per Seeking Alpha Premium through the end of 2024.
Table 2 - Summary of relevant projections UGI
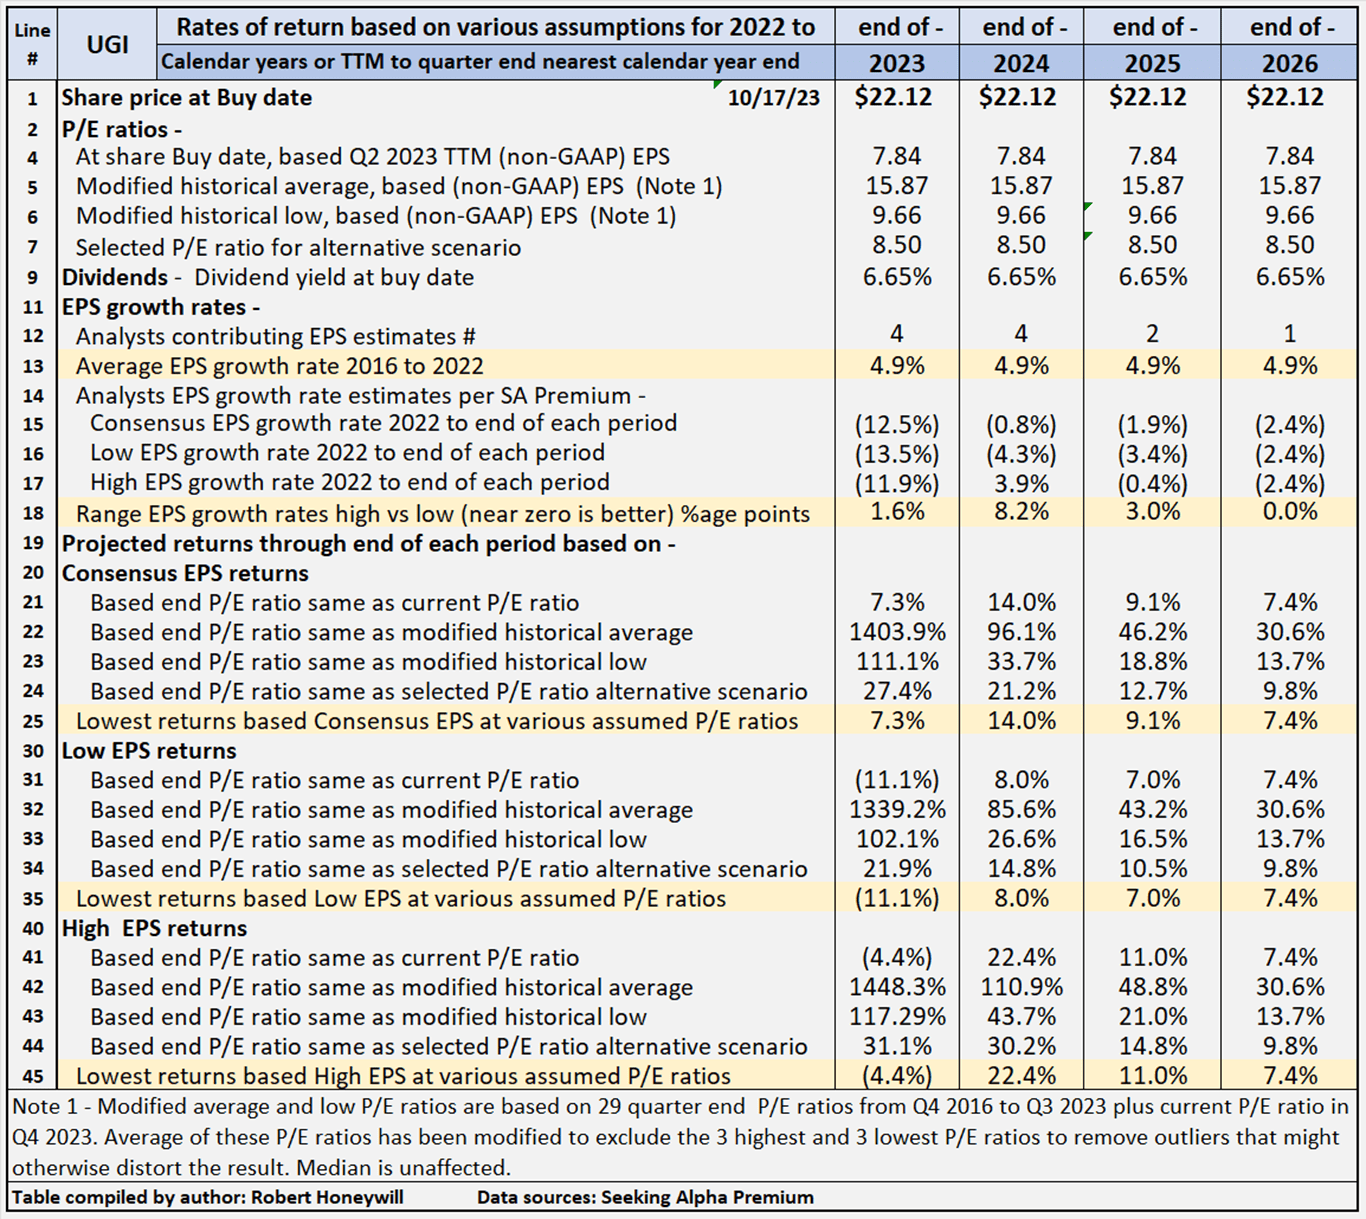
Table 2 provides comparative data for buying at the closing share price on October 17, 2023, and holding through the end of years 2023 through 2026. There's a total of twelve valuation scenarios for each year, comprised of three EPS estimates (SA Premium analysts' consensus, low and high) across three different P/E ratio estimates, based on historical data, plus a fourth P/E ratio selected to provide an alternative scenario. UGI's P/E ratio is presently 7.84, which is below the historical average P/E ratio of 15.87. Table 2 shows potential returns from an investment in shares of the company across the range of P/E ratios This analysis, from hereon, assumes an investor buying UGI shares today would be prepared to hold through 2024, if necessary, to achieve their return objectives. Comments on the contents of Table 2, for the period to 2024 column follow.
Consensus, low and high EPS estimates
All EPS estimates are based on analysts' consensus, low and high estimates per SA Premium. This is designed to provide a range of valuation estimates - from low to most likely to high - based on analysts' assessments. I could generate my own estimates, but these would likely fall within the same range and would not add to the value of the exercise. This is particularly so in respect of well-established businesses such as UGI. I believe the "low" estimates should be considered important. It's prudent to manage risk by knowing the potential worst-case scenarios from whatever cause.
Alternative P/E ratios utilized in scenarios
- The actual P/E ratios at the share buy date are based on actual non-GAAP EPS for Q2-2023 TTM.
- A modified average P/E ratio based on 29 quarter-end P/E ratios from Q4 2016 to Q3 2023 and current P/E ratio in Q4 2023. The Q3 and Q4 2023 P/E ratios are based on share price at the end of Q3 2023 and the current share price in Q4 divided by TTM EPS for latest reported earnings through end of Q2 2023. The average of these P/E ratios has been modified to exclude the three highest and three lowest to remove outliers that might otherwise distort the result.
- A modified low P/E ratio was calculated using the same data set used for calculating the modified average P/E ratio, and calculated on a similar basis, with the three highest and lowest P/E ratios excluded. In the case of UGI, the current multiple of 7.84 has been excluded as an outlier, resulting in the modified low multiple being higher at 9.66.
- A median P/E ratio is calculated using the same data set used for calculating the modified average P/E ratio. Of course, the median is the same whether or not the three highest and lowest P/E ratios are excluded. In the case of UGI, I have chosen to use an assumed P/E ratio of 8.50 in place of the historical median of 15.08 (similar to the average). I have done this to provide an idea of the impact on returns of the multiple increasing to around halfway between the present level and the historical low.
Reliability of EPS estimates (line 18)
Line 18 shows the range between high and low EPS estimates. The wider the range, the greater disagreement there is between the most optimistic and the most pessimistic analysts, which tends to suggest greater uncertainty in the estimates. There are four analysts covering UGI through the end of 2024. In my experience, a range of 8.2 percentage points difference in EPS growth estimates among analysts is relatively high and suggests a degree of uncertainty, and thus decreased reliability.
Projected Returns (lines 19 to 45)
Lines 25, 35, and 45 show a range of historical P/E ratio levels, UGI is conservatively indicated to return between 8.0% and 22.4% average per year through the end of 2024. The 8.0% return is based on analysts' low EPS estimates and the 22.4% on their high EPS estimates, with a 14.0% return based on consensus estimates. Those are the lowest of the returns under the consensus, low, and high EPS scenarios and assume a P/E multiple at UGI's current multiple of 7.84. As described above, in determining modified historical multiples, the three highest and lowest multiples are excluded. On that basis, the current multiple has been excluded in determining the historical low multiple of 9.66. If the multiple were to increase back to 8.5 by 2024, indicative returns range from 14.8% to 30.2%, with a consensus of 21.2%. At UGI's historical average P/E multiple of 15.87, the indicative returns range from 85.6% to 110.9%, with consensus of 85.6%.
Checking UGI's "Equity Bucket"
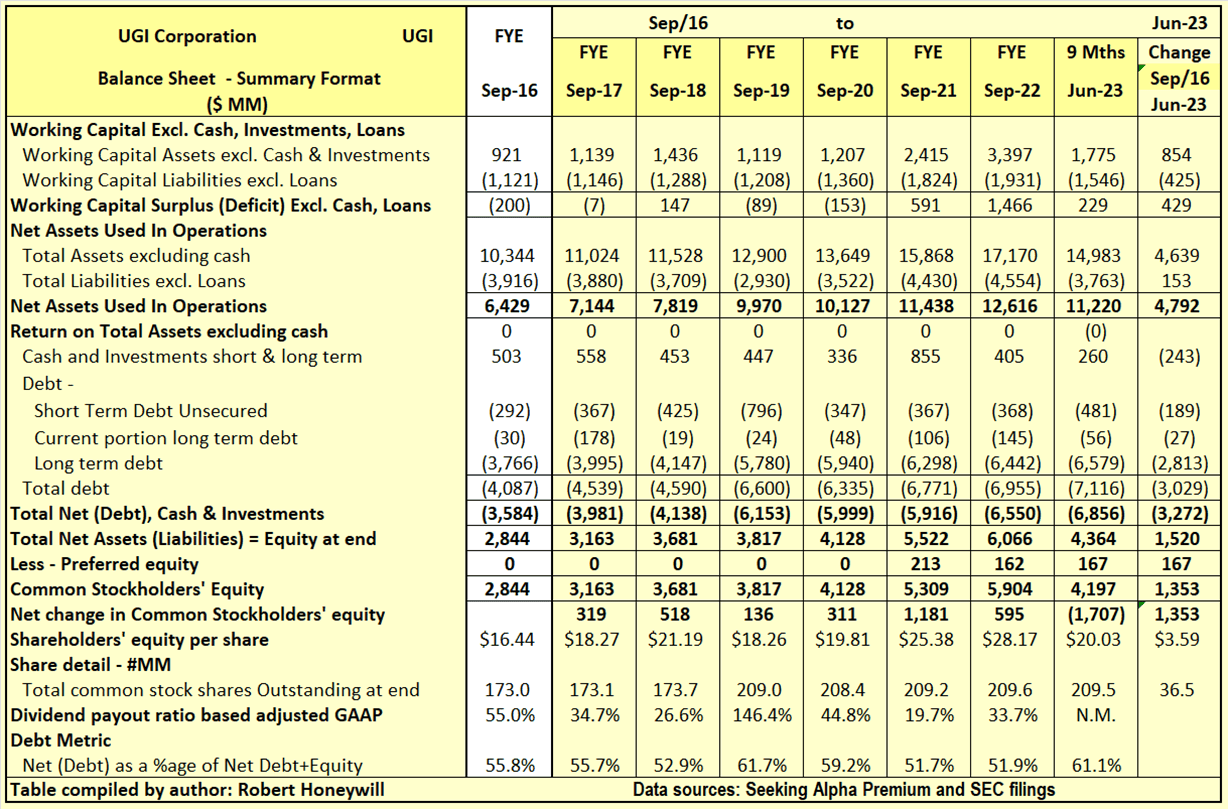
Table 3.1 UGI Balance Sheet - Summary Format
Over the 6.75 years at the end of September 2016 to the end of Q2 2023, UGI's shareholders' equity increased by $1,520 million. This $1,520 million increase, plus an increase of $3,272 million in debt net of cash was used to fund an increase of $4,792 million in Net Assets Used In Operations. Net debt as a percentage of net debt plus equity increased from 55.8% at the end of September 2016 to 61.1% at the end of Q2 2023. Outstanding shares increased by 36.5 million from 173.0 million to 209.5 million, over the period. Shares issued for employee compensation exceeded share repurchases. However, the great majority of the increase in shares came from share issues for the CMG acquisition in 2019 (see p . F-28 of FY-2019 10-K for details of acquisition). The $1,520 million increase in shareholders' equity was comprised of $167 million from a preferred share issue and an increase of $1,353 million increase in common stock shareholders' equity. The $1,353 million increase in common stock shareholders' equity over the last 6.5 years is analyzed in Table 3.2 below.
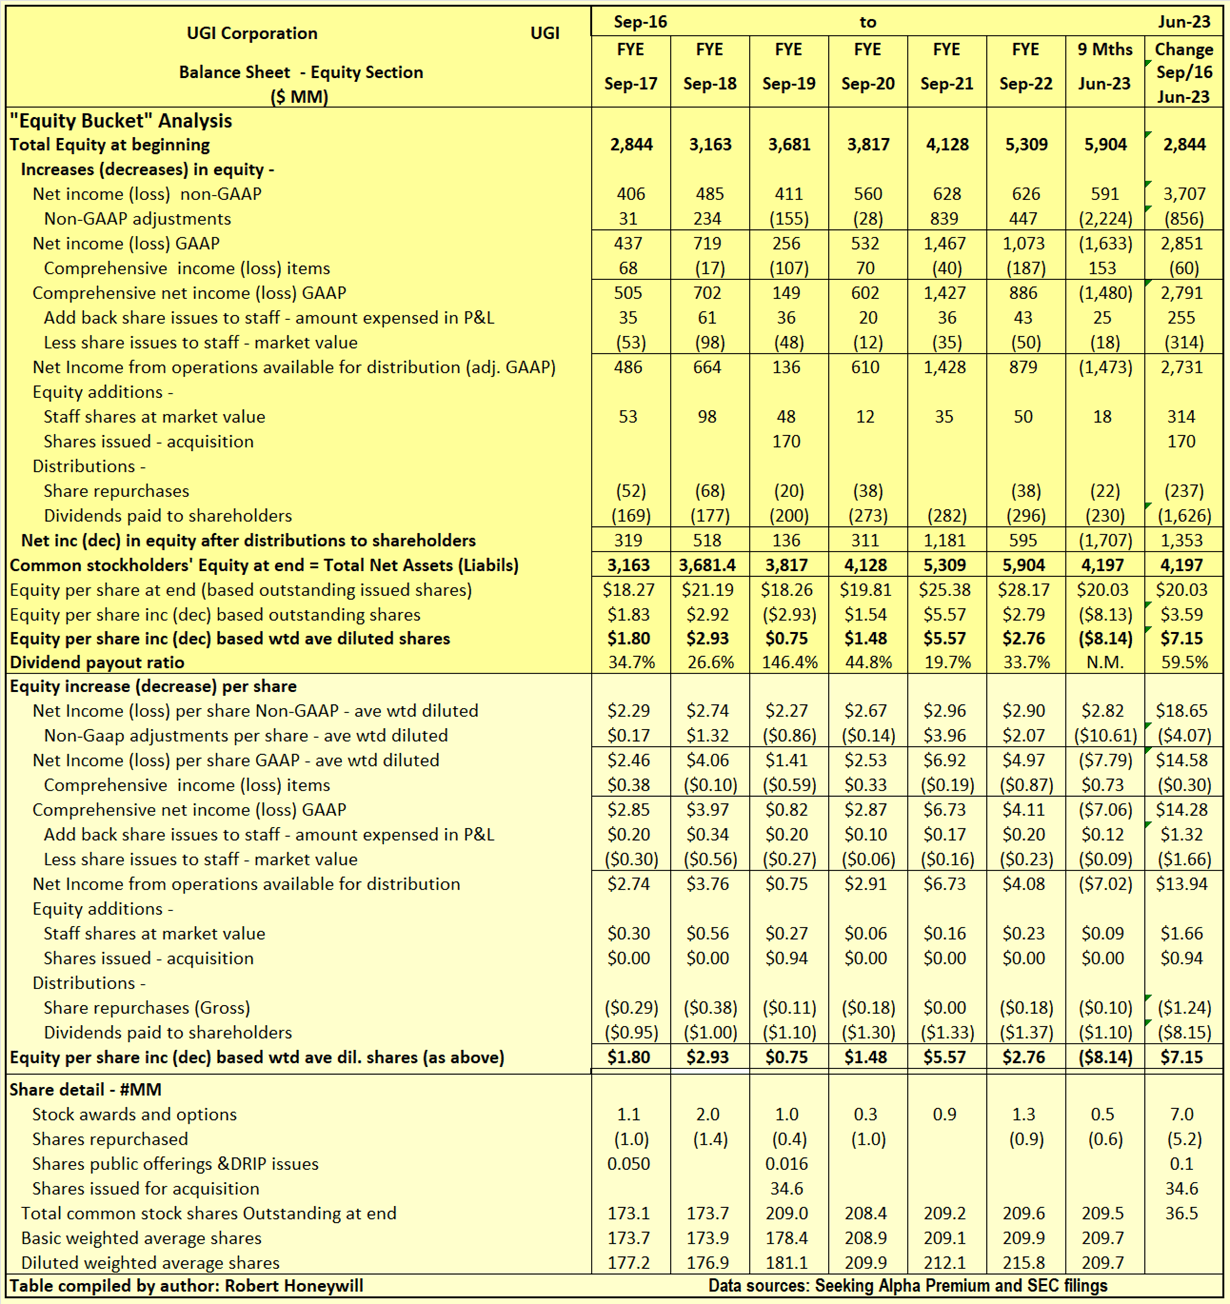
Table 3.2 UGI Balance Sheet - Equity Section
I often find companies report earnings that should flow into and increase shareholders' equity. But often the increase in shareholders' equity does not materialize. Also, there can be distributions out of equity that do not benefit shareholders. Hence, the term "leaky equity bucket." I look for evidence of this in my analysis of changes in shareholders' equity.
Explanatory comments on Table 3.2 for the period end FY-2016 to end Q2-2023.
- Reported net income (non-GAAP) over the 6.75 year period totals $3,707 million, equivalent to diluted net income per share of $18.65.
- Over the 6.75 year period, the non-GAAP net income excludes $856 million ($4.07 EPS effect) of items regarded as unusual or of a non-recurring nature in order to better show the underlying profitability of UGI. These items are primarily impairment charges for goodwill, amortization of intangibles, and restructuring charges.
- Other comprehensive income includes such things as foreign exchange translation adjustments with respect to buildings, plant, and other facilities located overseas and changes in the valuation of assets in the pension fund - these are not passed through net income as they fluctuate without affecting operations and can easily reverse in a following period. Nevertheless, they do impact the value of shareholders' equity at any point in time. For UGI, these items were negative, decreasing equity by $60 million over the 6.75 year period.
- There were share issues to employees, and these were a significant expense item. The amounts recorded in the income statement and in shareholders' equity, for equity awards to staff totaled $255 million ($1.32 EPS effect) over the 6.75 year period. However, the market value of these shares is estimated to be $59 million ($1.66 EPS effect). The understatement of expense by $59 million is not material in the context of non-GAAP earnings total of $3,707 million over the 6.75 year period, and not overly concerning from a "leaky equity bucket" aspect.
- By the time we take the above-mentioned items into account, we find, over the 6.75 year period, the reported non-GAAP EPS of $18.65 ($3,707 million) has decreased to $13.94 ($2,731 million), added to funds from operations available for distribution to shareholders.
- Dividends of $1,626 million and share repurchases of $237 million were adequately covered by the $2,731 million generated from operations, leaving a $868 million increase in equity. This $868 million from operations, together with the $314 million capital raised through share issues to staff, and the $170 million related to shares for the CMG acquisition, resulted in the $1,353 million net increase in shareholders' funds per Table 3.1 above.
Summary and Conclusions
UGI provides a safe dividend yield of 6.8% buying at the current share price, and with regular yearly dividend increases, yield on cost can be expected to grow. This should provide a total return of ~7% per year even with nil share price growth. However, there appears to be the possibility of considerable growth above the present severely beaten-down share price. UGI is rated a Buy.
For further details see:
UGI Corporation: Safe Dividend Yield And Attractive Share Price - Its A Buy