HERC - United Rentals: Buy This Dirty Cash Machine
2023-11-01 10:00:00 ET
Summary
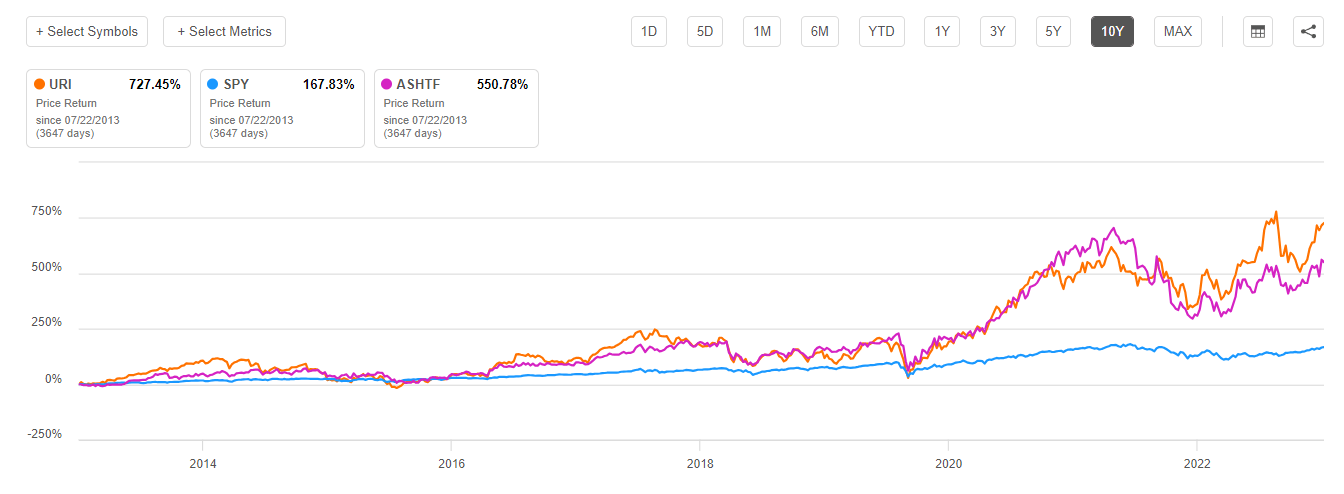
- United Rentals has outperformed the S&P 500 and its closest competitor, Ashtead, gaining a lead in 2022 in the $68 billion US equipment rental industry.
- URI has grown its market share through large acquisitions, spending $13.065 billion on M&A in the last decade, and has returned capital to shareholders through buybacks and dividends.
- The company's business model involves buying heavy equipment and renting it out to customers, generating strong cash flows and making it a compelling investment opportunity.
United Rentals (URI) has outperformed the S&P 500 and its closest competitor Ashtead (ASHTF), over the last decade. The equipment rental Goliath had largely tracked Ashtead over most of this time but has taken over in 2022, gaining the lead. Let's see what makes United Rentals and the general equipment rental industry a compelling investment opportunity.
United Rentals outperformance vs SPY (Seeking alpha)
The $68 billion US equipment rental industry
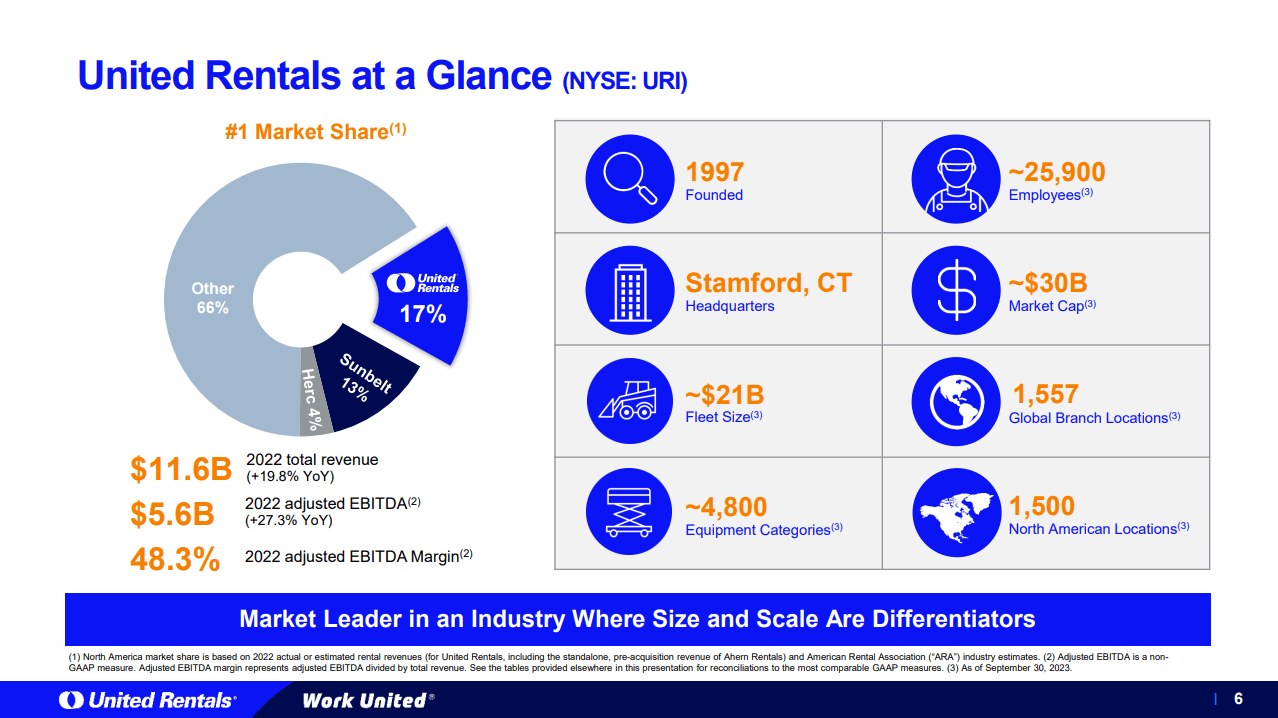
The Equipment Rental industry in the US is a very fragmented market with around $68 billion in annual revenue. United Rentals holds 17% and is growing an oligopoly with Sunbelt (13%), the brand of competitor Ashtead. Herc (HERC) also has a respectable 4% of the market, but the remaining 66% is fragmented between thousands of operators. The American Rental Association expects the industry to grow by low/mid-single digits over the next few years, in line with its historical growth rate over the last decade. URI has shown an 11% CAGR over the last decade, vastly outperforming due to its operational efficiency and large M&A.
The US equipment rental market (URI Q3 Presentation)
Rolling up the industry
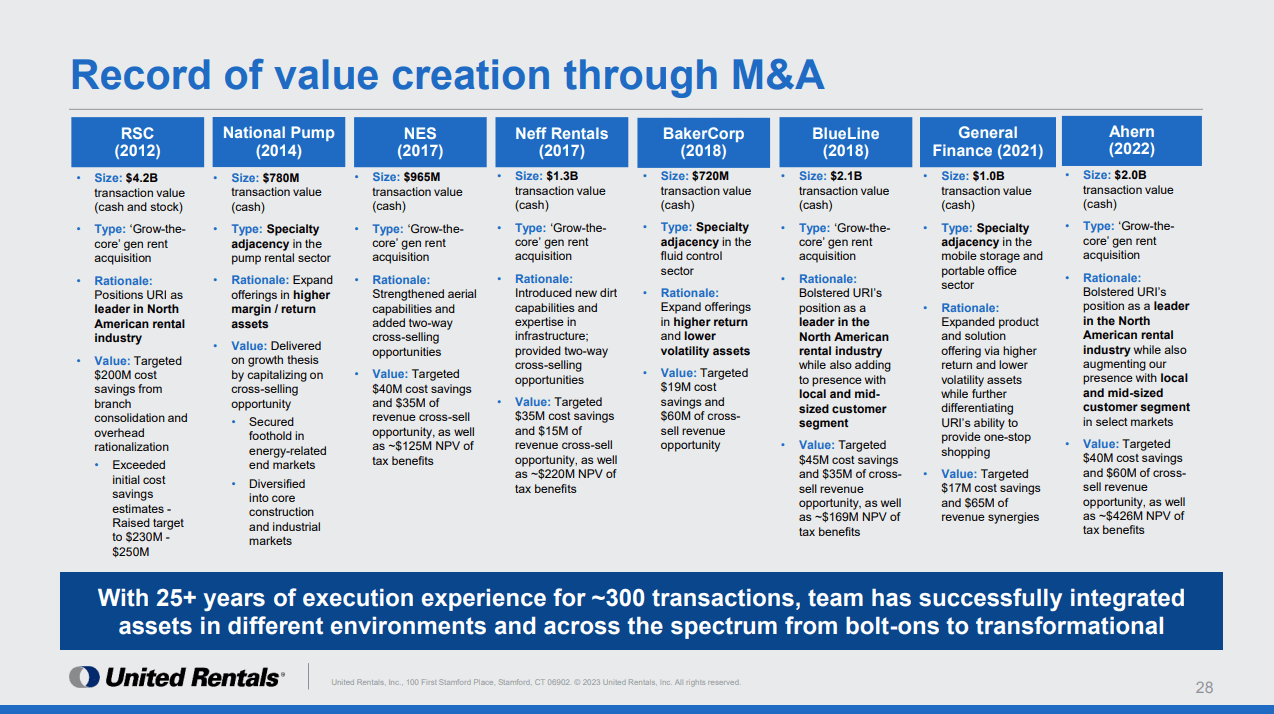
URI focuses on select large acquisitions to grow its market share. Over the last decade, it has made eight large acquisitions of around $1.5 billion each on average for a combined $13.065 billion spent on M&A. The equipment rental industry is a scale industry where the big are getting bigger. Proximity to customers is essential to drive efficiencies in equipment utilization and logistics. Getting the equipment to the customer is a big challenge; many rented equipment are massive machines. As seen below, URI has a track record of getting cost and revenue synergies out of its acquisitions. The company pursues a slightly different strategy to its competitor Ashtead, who is focused on smaller bolt-on acquisitions in larger frequencies.
URI M&A track record (URI Q2 report)
Returning capital to shareholders
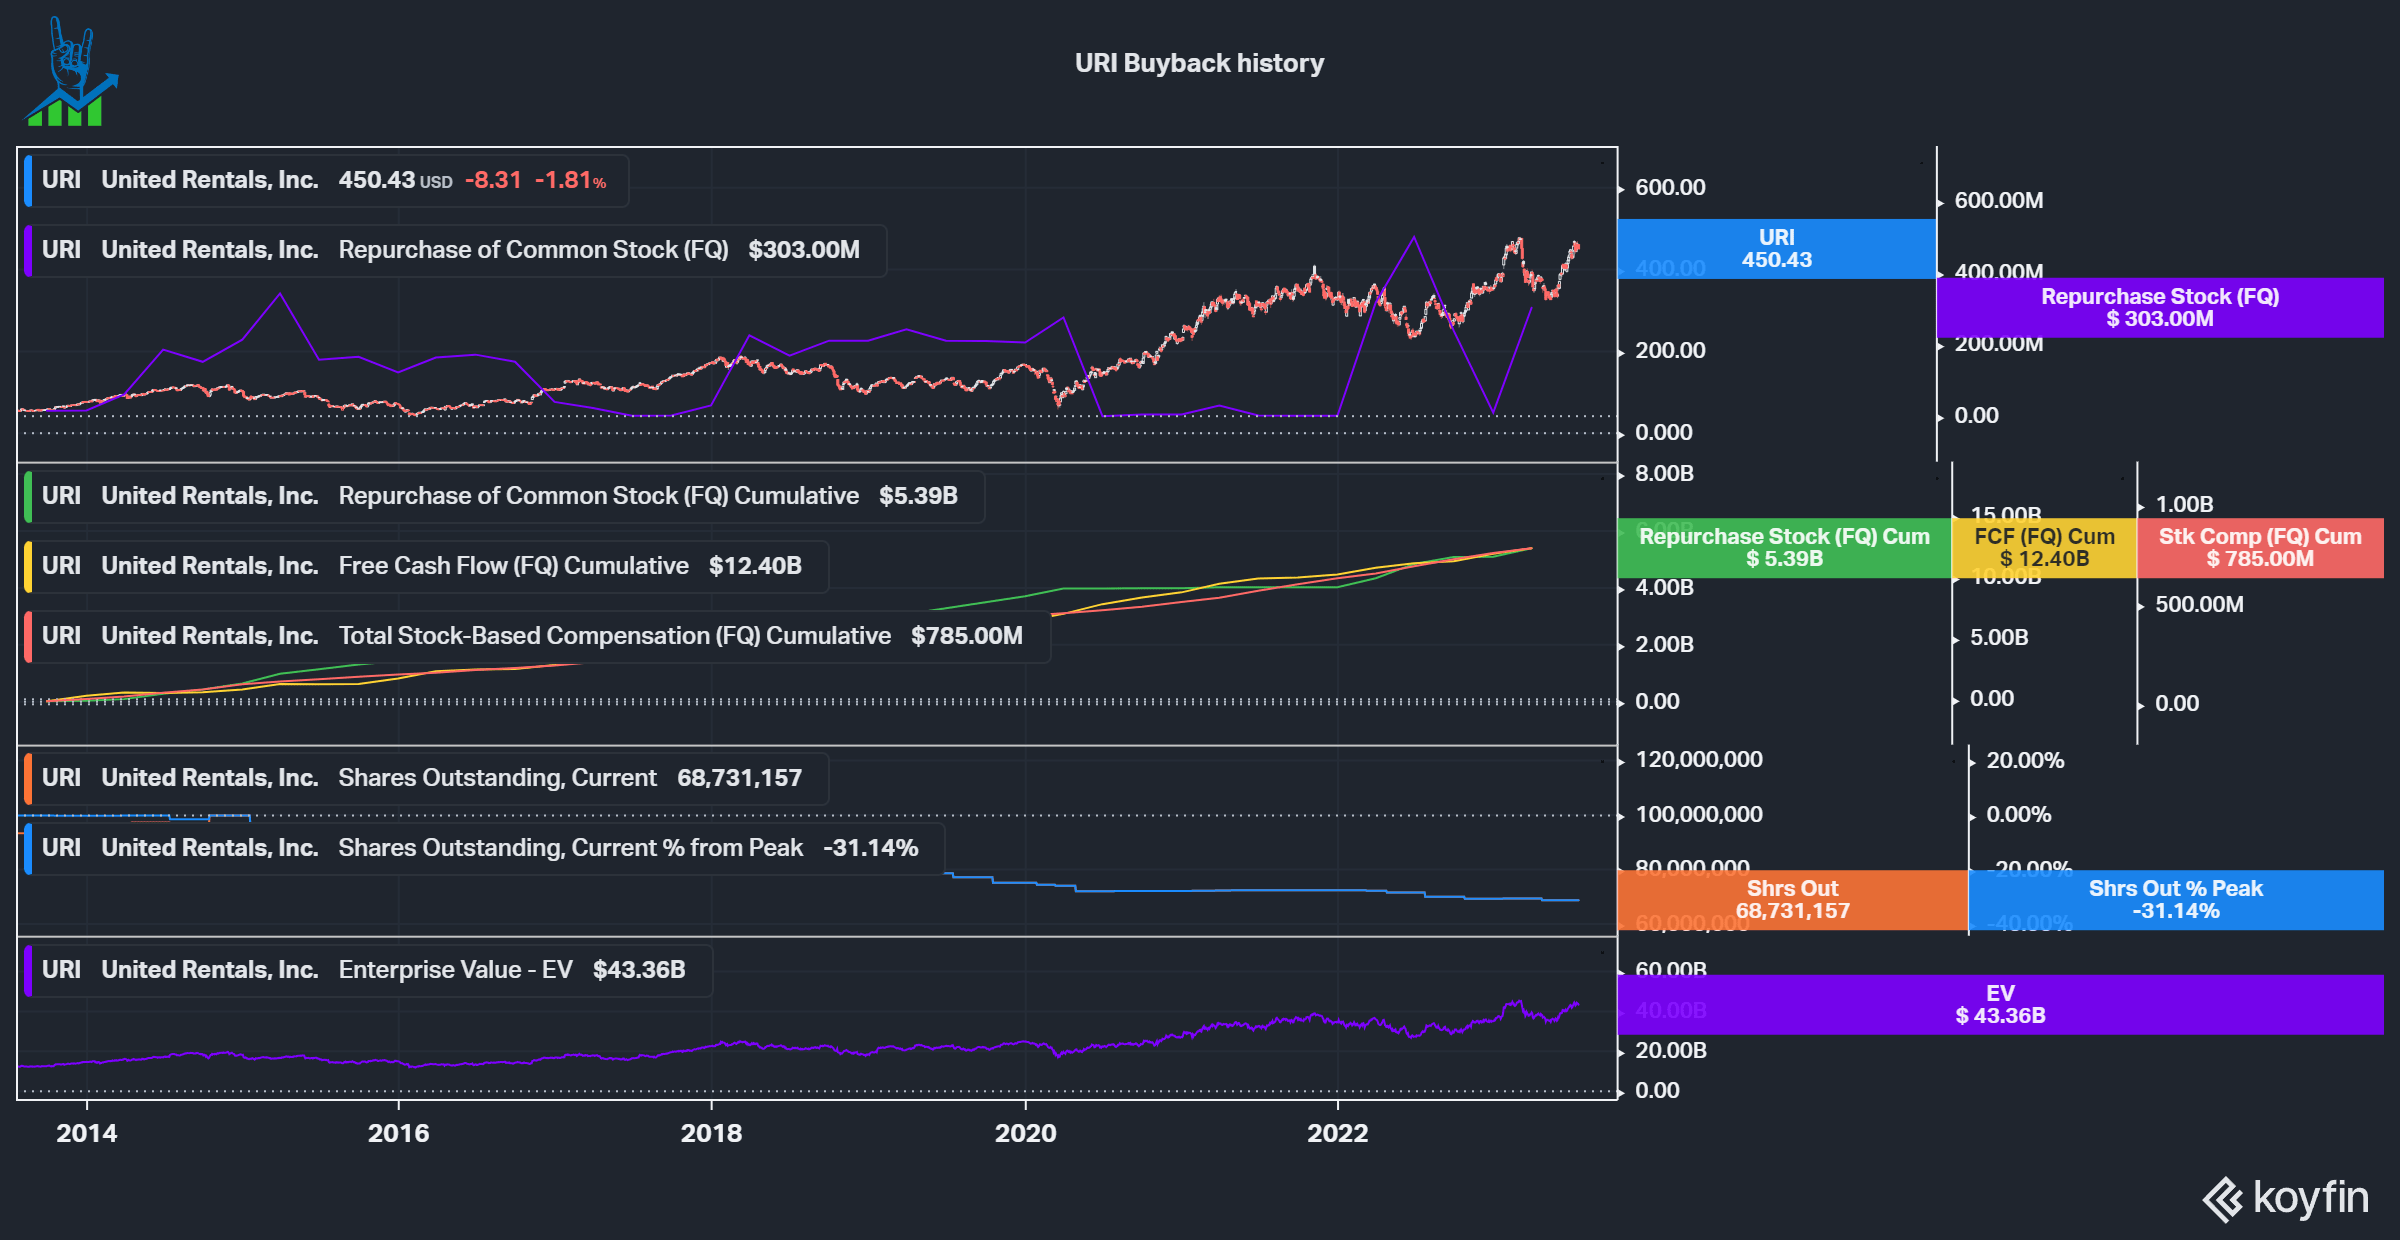
URI has a great history of returning capital to shareholders through buybacks. Over the last decade, the company spent $5.39 billion on buybacks, less than half of its free cash flows, to repurchase 31% of shares outstanding. This is a phenomenal track record and generated lots of wealth for its shareholders. If we compare the $5.39 to its current enterprise value of $43.36 billion, we see that they spent just 12.4% of the EV to reduce shares outstanding by 31%! In 2023 the company also started to pay a quarterly dividend, which currently yields around 1.3%.
Cash generation
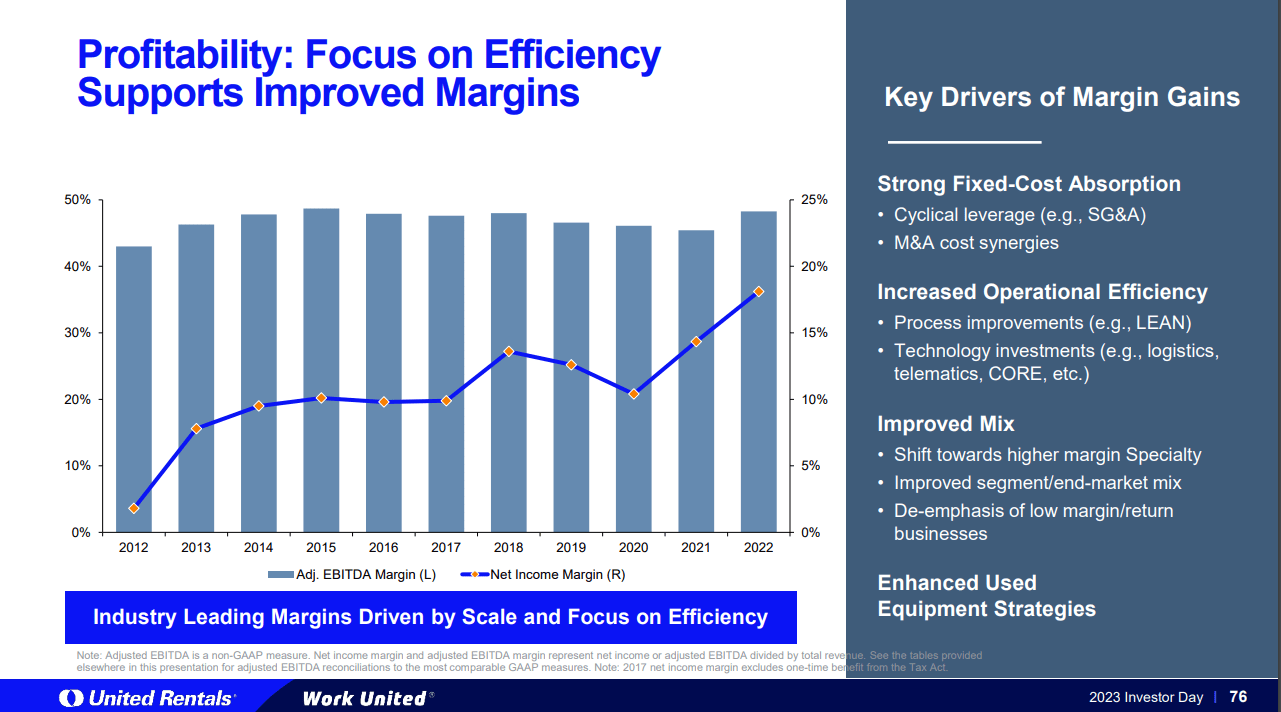
When we are talking about returning capital to owners, we should think about how that cash is generated. The business model is pretty simple from a 10,000-foot view but gets more complicated if you dive deeper. The company buys heavy equipment and rents it out to customers. Annual revenue per machine is roughly 50% of the original purchase price and URI can rent these machines for an average of 7 years. As the machines grow older, the rates the company can charge go down, as well as the value of it, so it is a strategic decision when to sell the machine (often into developing countries that can use the machines for much longer). The company can often recoup 30% or more of the original purchase price by selling. This makes the business model very lucrative, as seen in the chart below. URI generates Adjusted EBITDA margins of around 50% and close to 20% Net Income margins. The company managed to generate a 36% Operating Cash flow margin but must reinvest heavily into the business.
URI Profitability (URI Investor Presentation)
Cash conversion
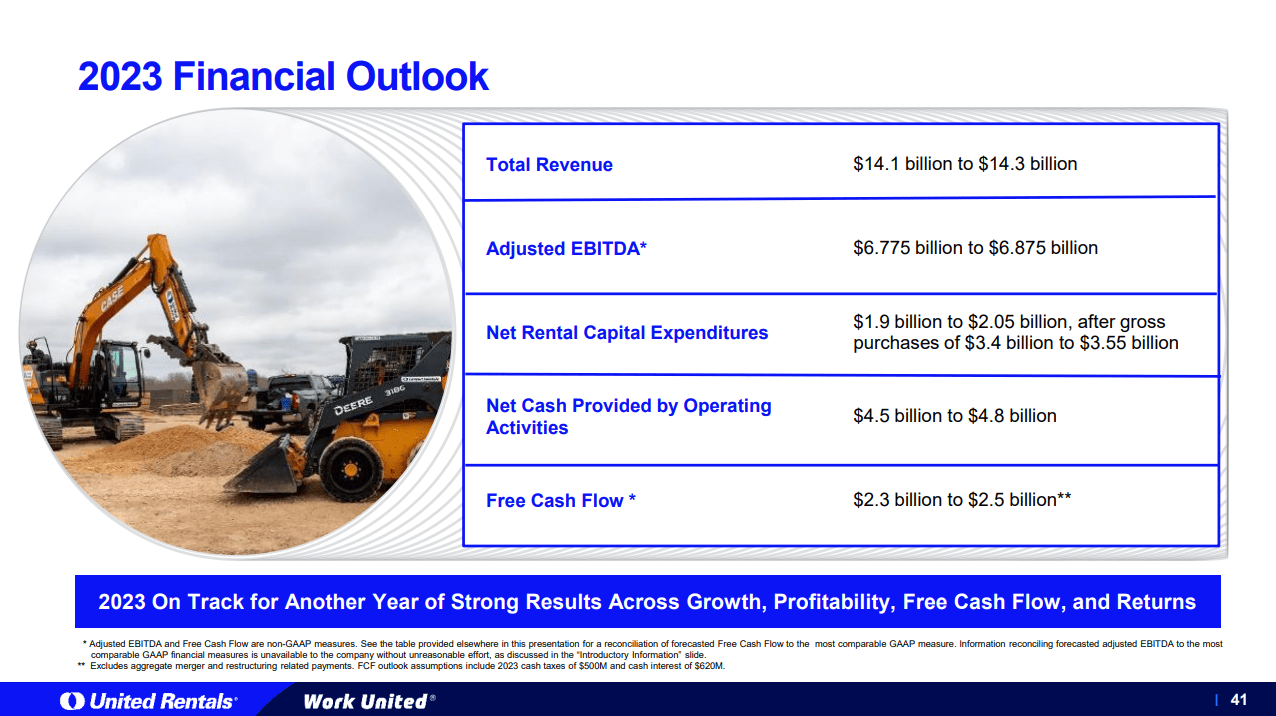
Cash Conversion is an important topic to understand URI. The slide below does an excellent job of highlighting the critical metrics. URI expects to generate around $4.5-4.8 billion in operating cash flow and spends $3.35-3.55 billion in gross purchase rental capital expenditures, with a net of $1.9-2.1 billion. What does that mean? Selling old rental equipment is counted towards capital expenditures and sets off the money spent on buying new equipment. That means URI will sell around $1.2 billion of old equipment and spend around $2.1 billion on new equipment. This leaves a significant lever for Free Cash Flow generation: During Covid, URI and Ashtead showed this by cutting down on growth capex (buying new rentals) and improving their FCF. While long-term investors should favor investment into growing the rental fleet, it shows both companies can pull this attractive lever. Rental equipment at scale is a very profitable business.
URI 2023 Outlook (URI Q3 Report)
URI Q3 earnings report
In its latest earnings report, URI managed to grow revenues by an impressive 23.4%, aided by the acquisition of Ahem, and a still impressive 14.9% growth pro format. Net income increased 16% and Free cash flow has grown to $1.16 billion year to date.
The company increased its outlook in most KPIs after substantially raising them already in Q2 and narrowed the ranges of outcomes with just Q4 left in the year:
| Prior Outlook |
| Increased Outlook |
| Revenue |
| $14.0 - $14.3 billion |
| $14.1 - $14.3 billion |
| AEBITDA |
| $6.75 - $6.9 billion |
| $6.775 - $6.875 billion |
| Net rental capex |
| $1.9 - $2.1 billion |
| $1.9 - $2.05 billion |
| Operating cash flow |
| $4.5 - $4.8 billion |
| $4.5 - $4.8 billion |
| Free cash flow |
| $2.3 - $2.5 billion |
| $2.3 - $2.5 billion |
URI has beat revenue estimates in 7/8 recent quarters and EPS in 6/8 times. The few misses have been small and in the 0 to -5% range, while surprises have been mostly above 10% on EPS and in the 0 to 5% range for revenue. This quarter saw a 5% EPS and 1.8% revenue surprise. Rival Ashtead has seen similar revenue beats over the recent past. The infrastructure boom due to the Chips Act, Inflation Reduction Act and general reshoring should continue to be a tailwind for both companies for a while.
Management again reiterated the continued secular tailwinds that will drive continued growth in the industry and for United Rentals:
Looking beyond 2023, we believe that our strategy positions us well to support our customers as they execute on the tailwinds we see across infrastructure, industrial manufacturing, and energy and power.
Matthew Flannery, URI CEO Q3 Earnings
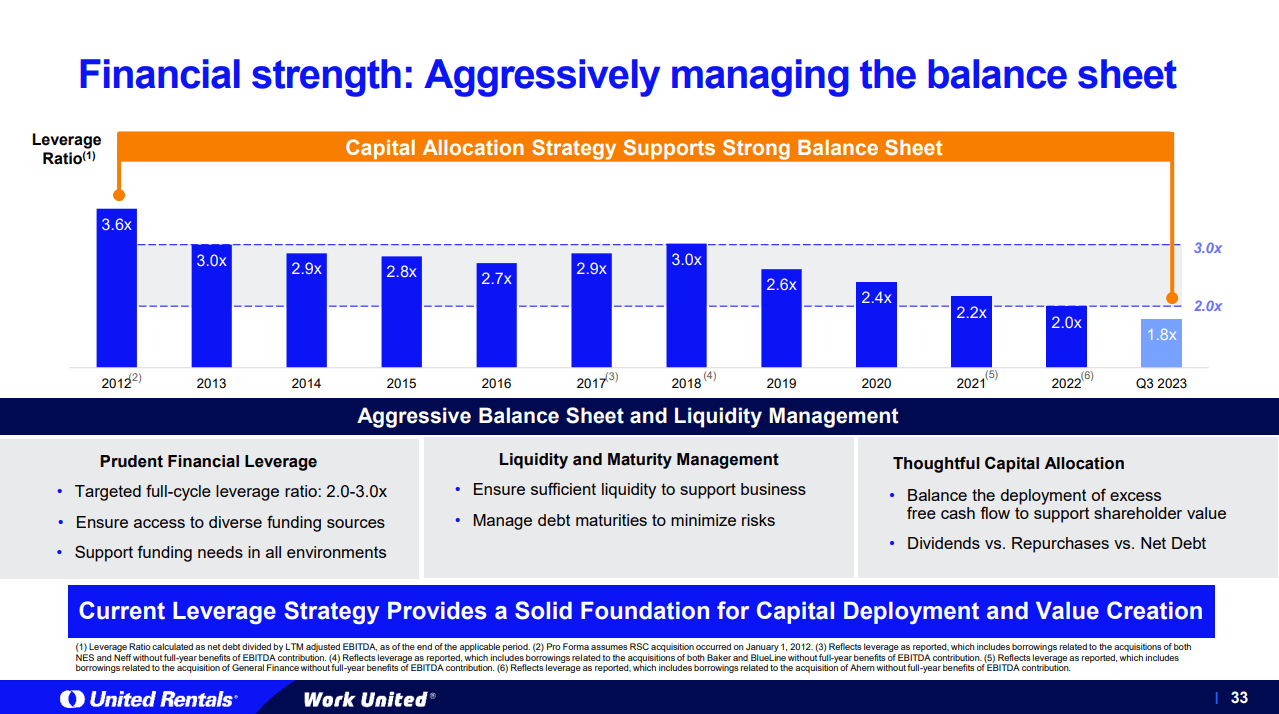
URI now is below its historical leverage range of between 2.0 and 3.0 times EBITDA. I expect the company to lever up again to pursue another large acquisition or accelerate share repurchases if there aren't opportunities. Due to the consistent cash flows, URI can run a levered business model without me feeling uncomfortable about the risk.
URI improved balance sheet (United Rentals Q3 Presentation)
United Rentals is a buy
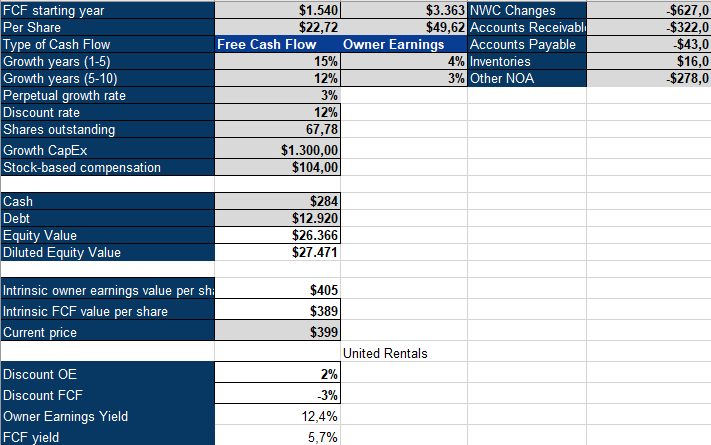
To value United Rentals, I'm using an inverse DCF model. I use a 12% discount rate to account for the increased risk that comes with a cyclical industry, over 50% of URIs revenue comes from the construction industry. I use a 3% perpetual growth rate (based on the long-term GDP growth expectation for the US ); I also calculate Owner Earnings besides normal Free cash flows. I believe that Owner Earnings are a better representation of the cash flows to owners than normal free cash flow, which several factors can easily distort:
- Stock-based compensation is paid out in shares and replaces cash expenses, but it is a cost to shareholders.
- Often not all of the CapEx spend is going towards maintaining the business, but rather to grow it. These investments could be cut, returned to owners and thus added back to Owner Earnings.
- Changes in Net working capital can distort cash flows, so I adjust them out.
Owner Earnings = FCF - SBC + Growth Capex +/- NWC changes
I used $1.3 billion as growth CapEx to grow the fleet. URI doesn't provide growth capex guidance, but competitor Ashtead spent $1.79 billion in growth capex in 2023. I'd assume that URI spends a similar amount, but to be conservative I stuck with $1.3 billion, Ashtead also has a higher priority for organic growth versus URIs' larger M&A transactions. We can see that according to the model, URI needs to grow Owner Earnings in the low single digits. This aligns with the overall industry growth expectations and is much below URIs mid-term (2028) growth goal of $10 billion AEBITDA, which indicates around a 15% CAGR. United Rentals is a buy at these levels.
URI Inverse DCF Model (Authors Model)
Risks to the thesis
The thesis in URI doesn't come without risks. The main risks in my opinion are macro: URI depends on the construction market with over 50% of sales coming from there. While the percentage of construction revenue has decreased substantially since the GFC, it still is very significant. A downturn could also have a positive factor though, with weaker competitors struggling and potentially offering good acquisition opportunities.
I see two major company-specific risks: The thesis depends on Owner Earnings, which assumes that growth capex can be returned to shareholders if growth stalls. This is up to management though and we have no guarantee that shareholders could see those cash flows. That being said management has a good track record. Furthermore, while not excessively high, URI has substantial debt that needs to be served. Debt always is a risk, but URI has stable cash flows and the ability to service the debt. Besides that URI and Ashtead both will continue to benefit as the big players in a highly fragmented market, where scale economics are a large competitive advantage and where the big will get bigger.
For further details see:
United Rentals: Buy This Dirty Cash Machine