USAP - Universal Stainless & Alloy Products: Its Problem Is That It Is Operating Below Break-Even
2023-09-04 10:12:34 ET
Summary
- USAP revenue did not grow over the past 11 years. On a cumulative basis, it only achieved break-even profits.
- The company faces challenges in operating above its break-even shipment levels and improving its Contribution (revenue minus variable cost).
- The valuation analysis suggests that USAP stock is not currently an attractive investment opportunity due to its historical performance and uncertain prospects for growth.
Investment Thesis
Universal Stainless & Alloy Products (USAP) is a turnaround case. Over the past 11 years, there was no growth in its revenue. The cumulative profit for this period was at the break-even level.
There are two main problems with USAP over the past 11 years. It was not operating above its break-even shipment tonnage about half of the time. Also, for half of the past 11 years, its Contribution (revenue per ton minus variable cost per ton) was below the level required to break-even.
I estimated that the market is pricing USAP as if it can consistently ship 65 % more than the past 2 years average shipment tonnage. Furthermore the Contribution has to be consistently 5% higher than the past 2 years average. I think the shipment target is a tall order and hence do not consider USAP an investment opportunity.
Business background
USAP manufactures and markets semi-finished and finished specialty steel products. The specialty steel industry is a distinct segment of the overall steel industry. USAP's products include stainless steel, nickel alloys, tool steel, and certain other premium alloyed steel.
The company has 4 manufacturing facilities in the US following the North Jackson acquisition in 2011. As such I will look at USAP performance from 2012 to 2022.
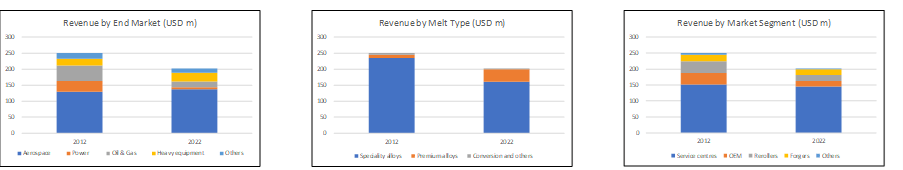
Over the past 11 years, the key item that stood out was the reduction in revenue. In tandem, there have been changes in the profile of its end market, melt type, and market segment. Refer to Chart 1. The key takeaways are:
- Sales from stainless steel products accounted for more than 2/3 of the revenue.
- Its largest end market was the aerospace sector. The revenue here was stable comparing 2022 with 2012.
- The service centre segment provided the company with a stable revenue base comparing 2022 with 2012.
At the same time, it was not a very profitable operation. Over the past 11 years, the ROE ranged from negative 10.6 % to positive 7.7 % with an average of negative 0.6 %.
The focus of my analysis is to understand the reason for the poor performance and whether USAP can be an investment opportunity.
Chart 1 Revenue Profile (Author)
Performance
I used 3 metrics to get an overview of its performance - revenue, profit after tax (PAT), and gross profitability (gross profits / total assets). The performance of USAP over the past 11 years is shown in Chart 2.
You can see that revenue, while declining over the past 11 years, showed 2 cyclical patterns. You should not be surprised by this as the company had stated in its 2022 Annual Report that "the demand for its products may be cyclical."
PAT on the other hand was very volatile with 6 years of losses. Of more significant concern was the declining gross profitability.
According to Professor Novy-Marx, gross profitability has the same power as PBV in predicting cross-section returns of stocks. The trend of this metric does not augur well for USAP.
Chart 2: Performance Index (Author)
Given the performance, you should not be surprised to find that the ROE over the past 11 years was also volatile as can be seen from Chart 3. A DuPont analysis showed that the ROE volatility was very much the result of a volatile profit margin.
Chart 3: DuPont Analysis (Author)
Revenue was dependent on the shipment tonnage as well as the average selling price per ton. Chart 4 shows the trends of these 2 metrics.
Shipment tonnage showed a more distinct cyclical pattern than the average selling price. To a certain extent, the unit selling price cyclical pattern was mitigated by the company's sales price surcharges practice. This was set up to help offset the impact of raw material price fluctuations.
The unexpected finding was the declining shipment tonnage trend. Looking at the trends in Chart 4, I would say that the declining shipment tonnage over the past few years has been "hidden" by the increasing selling price per ton.
Chart 4: Shipment trends (Author)
Q2 2023
In the first half of 2023, USAP reported a revenue that was 35 % higher than that for the same period last year. This resulted in it being barely profitable compared to a loss for the same period last year.
According to USAP, this
"...reflects both higher shipment volume and a strong pricing environment. The increase in demand and selling price is driven by our aerospace end market."
I normally do not look at quarterly performances as I consider them "noisy" from a long-term perspective.
In the immediate and short-term, the Q2 YTD results points to a turnaround.
But my focus is on how it will perform over the next decade. While the Q2 YTD results augur well, I think you have to weigh it in relation to the past 11 years track record. So KIV any conclusion until you have seen my full analysis.
Financial position
I have concerns about USAP's financial strengths.
- As of the end of Dec 2022, it had USD 2 million in cash. This was less than 1 % of its total assets.
- It had a Debt Equity ratio of 45% as of the end of Dec 2022. But this is not too bad as the DuPont analysis showed a declining leverage.
- From 2012 to 2022 it generated an average of USD 9 million per year cash flow from operations. This was barely enough to fund the cash required for investments of USD 13 million per year. I would rate this a poor performance.
- Its cash conversion cycle in 2021/22 was 304 days compared to 190 days for 2012/13. There was about a 60% decline over the past 10 years.
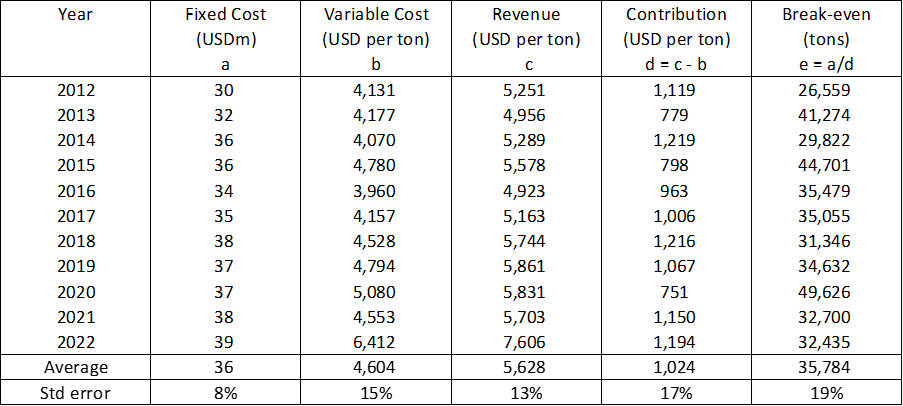
Break-even Analysis
I carried out a break-even analysis of the past 11 years' performance.
- I defined the Fixed Costs as Selling, General, and Administration ((SGA)) expenses plus Depreciation and Amortization (D&A). I assumed that the D&A provided in the Cash Flow Statement was captured under the Cost of Sales in the Income Statement.
- I defined the Variable Cost as the Cost of Sales - D&A.
- Contribution = Revenue - Variable Cost.
- Profit = Contribution - Fixed Cost.
Based on the above, I found that the Fixed Costs ranged from USD 30 million to USD 39 million per year with an average of USD 36 million per year. It averaged about 18% of the Total Cost (Fixed Cost + Variable Cost).
Chart 5 illustrates the picture.
- The gap between Revenue (denoted by the green line) and the Total Cost stacked column indicates a profitable situation.
- If the Revenue line is below the Total Cost column, it meant a loss.
When I plotted the shipment tonnage on the same chart, you can see that the company was profitable when there was a high shipment e.g. in 2012, 2018, and 2019.
It suggests that there is a break-even shipment tonnage and if the company operates below this level as in 2020 to 2022, there would be losses.
Chart 5: Break-even analysis (Author)
Table 1 illustrates how I estimated the break-even shipment tonnage for each year. You can see that the standard error (standard deviation/mean) for the Fixed Cost is about half of that for the Break-even tonnage. The analysis suggests the following:
- The Fixed Cost is not only a small component of the Total Cost, but is relatively stable.
- The Break-even tonnage is more affected by the Contribution than by the Fixed Cost.
Table 1: Estimating the Break-even tonnage (Author)
Notes to Table 1:
a) Fixed cost = SGA + D&A.
b) Variable cost = Cost of sales - D&A.
c) Revenue divided by the shipment tonnage for the year.
d) Contribution per ton = Revenue per ton - Variable Cost per ton.
e) Fixed cost to be in USD before dividing by the Contribution.
This is of course a back-of-envelop analysis as I am constrained by the data available.
But the past 3 years' situation suggests that USAP needs to rebuild its shipment tonnage as well as improve in Contribution. In the context of shipment tonnage:
- Can USAP rebuild its shipment to the Power and Oil & Gas end markets? Refer to the rightmost sub-chart in Chart 1.
- Can USAP rebuild its Specialty alloy business? Refer to the centre sub-chart in Chart 1.
- USAP has lost its OEM, Re-rollers, and Forgers market segment. These have to be rebuilt. Refer to the leftmost sub-chart in Chart 1.
In the context of the Contribution, the key takeaways are:
Despite the selling price spike in 2022 as per Chart 4, the Contribution in 2022 was about the same as that in 2021. Higher steel prices may not translate into better Contributions. The correlation between the selling price (as a proxy for steel prices) and Contribution was only 0.34. USAP may have to look at its product-market mix to increase the Contribution.
USAP may also have to focus on improving productivity and cost efficiencies. The declining gross profitability (as per Chart 2) and unchanged asset turnover (as per Chart 3) indicate areas to work on. USAP should also not forget the cash conversion cycle.
Valuation
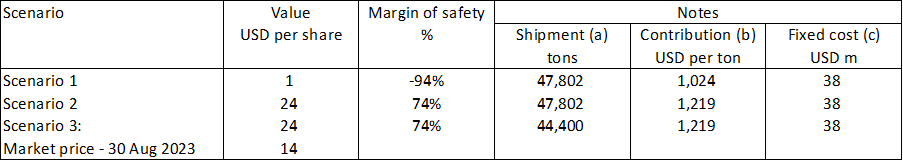
In my valuation of USAP, I assumed that it would be able to continue to operate well above its break-even levels. Hence I assumed that its shipment tonnage would match that achieved in 2012 of 47,802 tons.
I then considered 3 Scenarios.
- Scenario 1. I assumed that its Contribution would be at the 2012 to 2022 average.
- Scenario 2. I assumed that its Contribution would be the best of those achieved between 2012 to 2022.
- Scenario 3. Here I reverse-engineered the market price to determine the shipment tonnage. I assumed that the Contribution is the best of those achieved between 2012 and 2022.
In all Scenarios, I assumed that the Fixed Cost would be the average of the past 3 years.
Despite the zero growth in revenue from 2012 to 2022, in my valuation, I assumed that the company would achieve a 5% CAGR in perpetuity.
Table 2 summarizes the results. This does not look like an investment opportunity.
- There is only a margin of safety under Scenario 2 with the best past 11 years of shipment tonnage and best Contribution.
- For Scenario 3, the market is pricing USAP as if it can sustain a shipment tonnage that is 24 % higher than the historical average. At the same time, it assumed that USAP can continue to deliver the best historical Contribution.
I don't think these assumptions are supported by the earlier findings. So while there is a margin of safety under Scenario 2, it is not realistic. The market has overpriced USAP.
Table 2: Summary of intrinsic value and margin of safety (Author)
Notes to Table 2:
a) Scenario 1, 2 = best of 2012 to 2022 = 2012 value. Scenario 3 = quantity to match market price.
b) Scenario 1 = 2012 to 2022 average. Scenario 2, 3 = best of 2012 to 2022 = 2014 value.
c) Scenario 1, 2, 3 = 2020 to 2022 average.
Valuation model
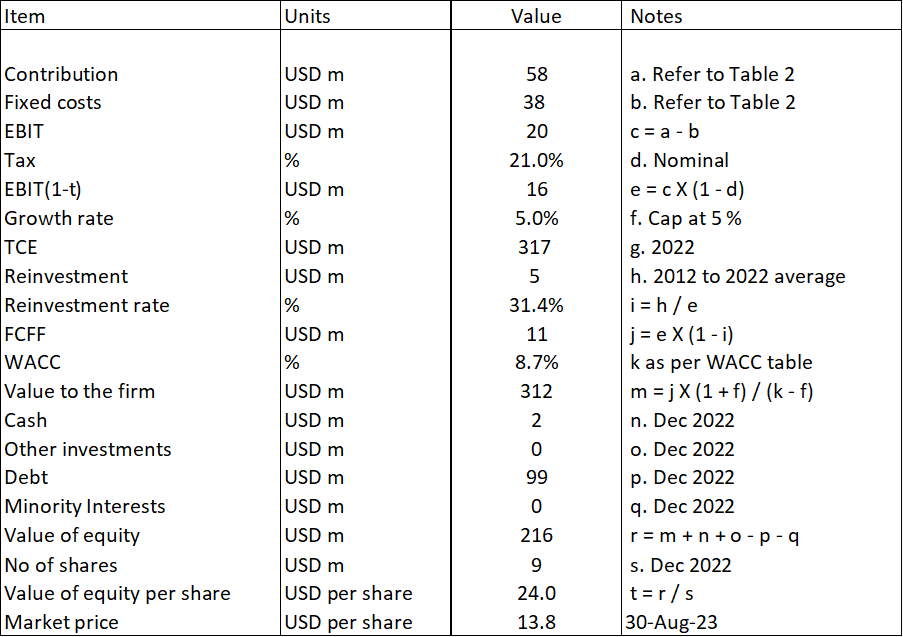
My valuation is based on the single-stage Free Cash Flow to the Firm model as illustrated in Table 3.
Table 3: Sample valuation (Author)
The critical parameters are the dollar Contribution and SGA.
The dollar Contribution was derived by shipment tonnage X Contribution per ton as presented in Table 2.
The SGA was assumed to be the average of the 2020 to 2022 levels as per Table 2.
I assumed that the tax rate, Reinvestment, and WACC are the same under both Scenarios.
FCFF = EBIT(1-t) X (1- Reinvestment rate).
The tax rate was based on a 21 % nominal tax rate.
Reinvestment = CAPEX - Depreciation & Amortization + Net Working Capital. I estimated that this was equal to the average 2012 to 2022 Reinvestments.
The WACC was based on the first page of a Google search for the term "USAP WACC" as shown in Table 4.
Table 4: Cost of Capital (Various)
The value of Equity = Value of the Firm + Cash equivalents + Investments - Debt - Minority Interests.
The Cash, Debt, and Minority Interests were based on the Dec 2022 values.
Risks and limitations
I would classify the risks and limitations into the following:
- Operational
- Growth
- Turnaround
My valuation hinges on USAP being able to build up its shipment tonnage as well as Contribution. A lot of these depend on changes to its product-market mix and improving its efficiencies. My analysis did not point to any improving trends for them.
At the same time, USAP also has a high customer concentration. For example, in 2022, 3 customers accounted for 49 % of the company sales. I have not specifically built this risk into the valuation model.
I also assumed that USAP can grow at the US long-term GDP growth rate of 5% per annum. Over the past 11 years, USAP did not achieve any revenue growth. If I valued USAP on such a no-growth scenario i.e., based on the Earnings Power Value, there is no margin of safety under Scenario 2.
Turnaround prospects
USAP is facing a turnaround and to be successful, it has to address all the issues I mentioned.
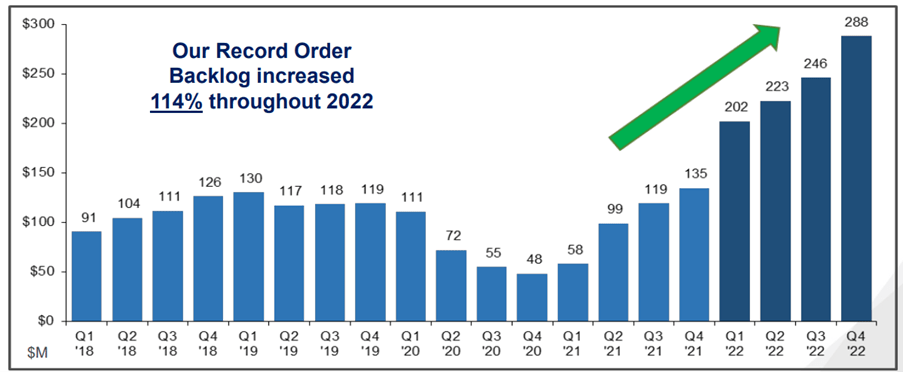
In its Feb 2023 Presentation , USAP showed a growing backlog of orders as illustrated in Chart 6. Don't be mesmerized by this.
When I carried out a 2012 to 2022 correlation between the backlog at the end of the year and the corresponding next year's revenue, it was only 0.37 %. A high backlog did not explain the coming year performance. Note that in its 2022 Annual report, the company stated that the backlog was due for shipment in 2023. So, a correlation with the following year seems appropriate.
The company has not given any indication that it would be able to operate above its break-even levels on an ongoing basis. It is not just the next year's performance but the next 10 years that we should be concerned with.
I do not doubt USAP's technical and metallurgical capabilities. I just worry about it being able to translate these into a profitable operation.
Chart 6: Backlog of orders (USAP Feb 2023 Presentation)
There is another important takeaway from Scenario 1. Assuming a Contribution at the 2012 to 2022 average level, the business is not worth anything at any shipment tonnage that is lower than the past 11 years high tonnage.
From 2012 to 2022, USAP had 5 years with less than the average Contribution. This is not a good track record.
To sustain the turnaround, USAP must improve the Contribution by either:
- Selling at higher prices for the same costs through changes in the product-market mix and/or raising the surcharge.
- Reducing variable costs through productivity and efficiency improvements. I would think that as labour cost is not really variable, increasing the shipment tonnage can partly help to reduce variable cost.
It is not going to be a simple turnaround exercise as USAP has to address 2 fronts - shipment tonnage and Contribution.
Conclusion
Over the past 11 years, USAP was not able to grow its revenue. Its profits were volatile and on a cumulative basis, the company just broke even. I also have concerns about its financial strengths.
At first sight, it is not a fundamentally sound company. But I wanted to see whether there are turnaround opportunities.
My analysis shows that to be profitable, the company needs to address 2 issues:
- Increase its shipment tonnage to be consistently at least 65 % higher than the average achieved over the past 2 years.
- Improve the Contribution to be at least 5% higher than the average achieved over the past 2 years and sustain this.
At the same time, it must be able to grow. This probably meant a growing shipment tonnage.
If the company can deliver these, there will then be a margin of safety. The Contribution improvement does not look far-fetched. But the shipment tonnage target is a big challenge. There is no track record to suggest that this shipment target is sustainable.
You can understand why I would not invest in USAP.
I am a long-term fundamental investor. As such, I try to look at how the business will perform over the next decade or so. My valuation is also from this perspective. This is not an analysis or valuation for those looking for gains over the next few months
For further details see:
Universal Stainless & Alloy Products: Its Problem Is That It Is Operating Below Break-Even