VNQ - Vanguard Real Estate ETF: Poor Outlook For The Housing Market
Summary
- The expense ratio of the Vanguard Real Estate ETF was significantly higher than that of the other well-known Vanguard ETFs, while the return is lower.
- Two well-known house price ratios are at all-time highs, which could spell bad news for house prices and the equity price of the Vanguard Real Estate ETF as mortgage rates.
- Several REITs and European real estate stocks provide better value than the Vanguard Real Estate ETF.
Introduction
The Vanguard Real Estate ETF ( VNQ ) is an exchange-traded fund (ETF) that seeks to outperform a benchmark index of global real estate companies. Vanguard manages the fund, which is intended to provide investors with exposure to a diverse portfolio of companies that own or operate commercial and residential real estate such as office buildings, apartments, warehouses, and other types of commercial and residential real estate.
The ETF has a low expense ratio of 0.12%, making it a low-cost way to gain exposure to global real estate firms. The fund is appropriate for investors seeking exposure to the real estate market as well as potential income and diversification benefits.
The return of the ETF was significantly lower than that of the Vanguard high dividend yield ETF (expense ratio = 0.06%) or the Vanguard total stock market ETF (expense ratio = 0.03%). The expense ratio of the Vanguard Real Estate ETF was significantly higher than that of the other ETFs in the chart below.
This article provides a quick overview of the current picture of the overall housing market in comparison to historical figures. Two well-known house price ratios are at all-time highs, which could spell bad news for house prices and the equity price of the Vanguard Real Estate ETF as mortgage rates rise.
Real Estate Prices Are At All-Time High
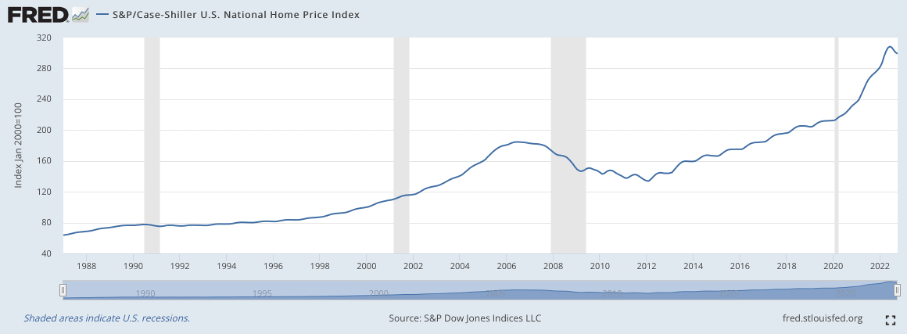
The S&P Case-Shiller Home Price Index is a well-known home price index that can be used to gain insight into house prices. The S&P Case-Shiller Home Price Index tracks changes in home prices in the United States. It is a composite of single-family home price indices for the nine Census divisions in the United States. The index is computed using the repeat sales method, which compares the sales prices of similar properties over time. The index is published monthly and is widely used to track the housing market by economists, real estate professionals, and the media. In addition, the index is used to adjust the values of adjustable-rate mortgages and to forecast future home prices. It is regarded as one of the best indicators of the housing market's health.
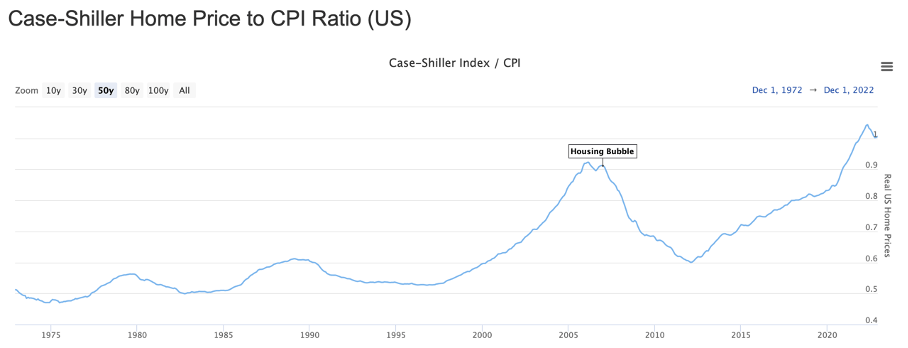
There are two common ratios that can be graphed to gain insight into home price valuation. The home price to CPI ratio is one of them.
The home price to consumer price index ((CPI)) ratio
The home price to consumer price index ((CPI)) ratio measures the relationship between changes in home prices and changes in living costs. It is calculated by dividing the change in home prices by the change in the Consumer Price Index ((CPI)). A ratio greater than one indicates that home prices are rising faster than the cost of living, whereas a ratio less than one indicates that home prices are rising slowly. The ratio can be used to chart the evolution of housing affordability over time.
The graph below shows that the home price to CPI ratio is at an all-time high of more than one. When compared to historical averages, home prices are increasing at a faster rate than the consumer price index. During the low interest rate environment at the start of the corona crisis, house prices experienced a significant increase. People went on a housing shopping spree during the lockdown. Because interest rates were low, they could borrow a lot of money, causing house prices to skyrocket. Naturally, this is unsustainable in the long run, especially if interest rates continue to rise.
During the last half-century, the ratio has increased while interest rates have decreased significantly. That said, I think a ratio between 0.6 and 0.8 is reasonable (the range from dept of the housing crisis and before the rally in 2020). Home prices would need to fall while inflation rose for the ratio to return to average levels.
Case-Shiller Home Price to CPI Ratio (United States) (longtermtrends.net)
The home price to CPI ratio is currently skewed downward, and the S&P Case-Shiller Home Price Index shows that house prices have fallen from recent highs. Inflationary pressures rose in 2022, which I see as a perfect recipe for real home price declines.
S&P / Case-Shiller US National Home Price Index ((FRED))
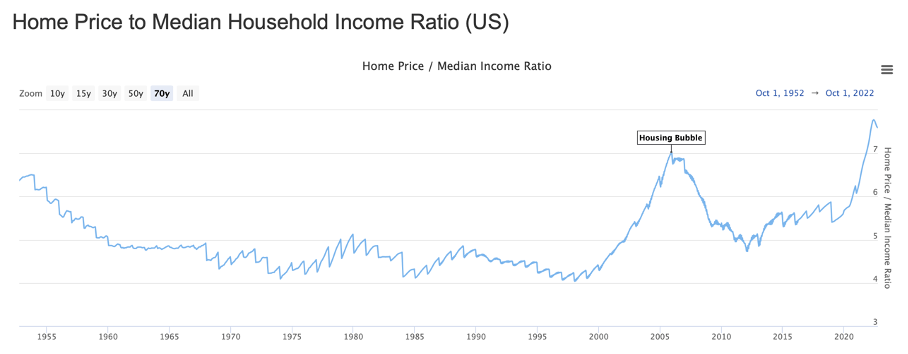
The home price to median household income ratio
The home price to median household income ratio is the second ratio to consider when valuing a home.
The home price to median household income ratio measures the relationship between the cost of housing and the average household's income level. It is calculated by taking the median home price and dividing it by the median household income. This ratio can be used to track housing affordability over time and across markets. The ratio has fluctuated between 4 and 8 over the last 70 years; interest rates and housing supply are two dependent variables that drive up home prices. Boom cycles can fail, and we can see in the graph below that housing is expensive in comparison to historical figures. The ratio is skewed downward, implying that house prices tend to fall while median household income rises.
Home Price to Median Household Income Ratio (United States) (longtermtrends.net)
A thousand words are expressed in two graphs. Both indicate that house market is expensive, which is due to historically low mortgage rates and a lack of supply. Institutional ownership now accounts for 40% of all single-family rental acquisitions. If they are unable to meet their debt obligations, they are more likely to sell a large number of houses for a lower price. At 1.86%, the delinquency rate for single-family residential mortgages remains very low. I do not believe homeowners are in risk, but I believe institutional investors will sell in the coming years, causing house prices to fall. They must refinance their debt at a higher interest rate and prefer to sell their homes to reduce their debt load.
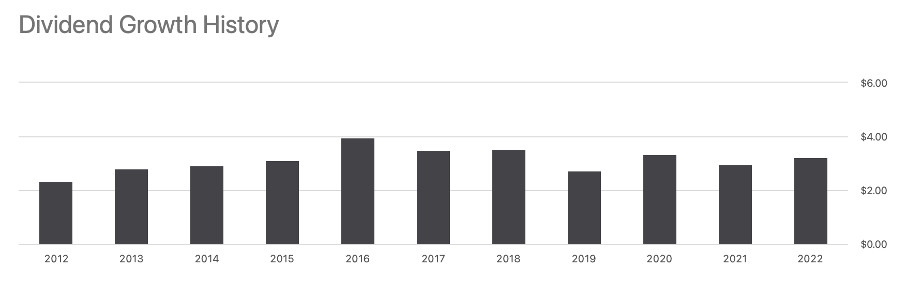
The dividend rate has not increased
Finally, let us discuss dividends. From 2017 to the present, the dividend rate has not increased and has fluctuated. The current dividend rate is $3.23, representing a dividend yield of 3.66%.
Dividend growth history (Seeking Alpha VNQ ticker page)
Many other REITs with growing revenue, earnings, and FFO are available at a lower valuation and thus a higher dividend yield. Consider Essential Properties ( EPRT ) with a dividend yield of 4.5%. Next year, the dividend rate is expected to rise by 3%. The dividend yield of Vonovia ( VONOY ), a European real estate stock, is 6%. LEG Immobilien's ( LEGIF ) dividend yield is 5.4%. In August 2022, I wrote about these and other German Real Estate stocks.
Real estate values are expected to fall, but the Vanguard Real Estate ETF hasn't seen a significant price decline yet. The dividend yield is only 3.66%, and the dividend rate hasn't increased since 2017. Other Real Estate companies offer a higher dividend yield. When compared to other REITs and European Real Estate stocks, the Vanguard Real Estate ETF is overpriced based on the dividend yield.
For further details see:
Vanguard Real Estate ETF: Poor Outlook For The Housing Market