XLF - VFH: Solid Choice But Still Not The Best Financial Sector ETF
2023-11-25 01:27:42 ET
Summary
- Vanguard Financials Index Fund ETF is likely to underperform compared to competitor ETFs due to its overly diversified holdings and lack of weight on top financial performers.
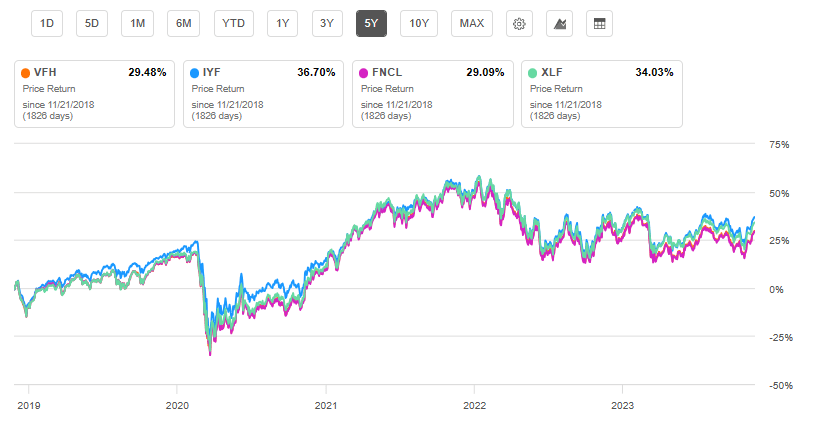
- VFH's performance has lagged behind iShares U.S. Financials ETF in all time periods examined.
- VFH's low expense ratio and high dividend yield are its key advantages, but they do not compensate for its underperformance compared to IYF.
Investment Thesis
Vanguard Financials Index Fund ETF (VFH) warrants a hold rating due to its likelihood of underperformance compared to competitor ETFs. Despite having a low expense ratio, VFH is overly diversified and lacks weight on top financial performers. Specifically, VFH has relatively lower weight on Berkshire Hathaway, JPMorgan Chase, and Bank of America while holding several laggards in the financial sector. As a result, VFH will likely underperform due to its current holdings, even when factoring in its lower cost and higher dividend payout.
Fund Overview, Objective, and Competitors
VFH's objective is to track the performance of the Spliced US IMI Financials 25/50 benchmark that measures the investment return of stocks in the financial sector. VFH is a passively managed fund that was started in 2004. The fund currently has 394 holdings and $7.87B in AUM. Top competitors for VFH are iShares U.S. Financials ETF ( IYF ), Fidelity MSCI Financials Index ETF (FNCL), and Financial Select Sector SPDR Fund ( XLF ). Investors in these ETFs and the financial sector in general are likely to have enjoyed both capital appreciation and a modest dividend yield over the past 5-10 years. However, there are multiple characteristics that set VFH apart from its competitors.
VFH Is Disadvantaged in its Holdings
A key differentiator for VFH compared to its peers is its holdings. VFH is similar to FNCL, which also strives to track the US IMI Financial Index. However, VFH has distinct differences with IYF and XLF. IYF and XLF are notably different because their objective is not to track the US IMI Financial Index but simply to match the performance of the financial sector overall.
Because IYF is not tied to the same financials benchmark as VFH, IYF has fewer holdings. As a result, IYF can put greater weight on top financial companies like Berkshire Hathaway ( BRK.B ), JPMorgan Chase & Co. ( JPM ), and Bank of America ( BAC ). This heavier weight on top financial companies represents a key advantage for IYF and XLF where VFH lags. In addition to BRK.B, JPM, and BAC, IYF maintains a heavier weight on Goldman Sachs ( GS ), BlackRock, Inc. ( BLK ), and The Progressive Corporation ( PGR ). These represent quality companies that have all outperformed the S&P 500 index over the past five years.
Quantity of Holdings and Top 10 Weights for VFH and Competitor ETFs
| VFH |
| IYF |
| FNCL |
| XLF |
| # Holdings: 394 |
| # Holdings:142 |
| # Holdings: 418 |
| # Holdings: 75 |
| BRK.B: 8.51% |
| BRK.B: 13.08% |
| BRK.B: 8.21% |
| BRK.B: 13.54% |
| JPM: 7.82% |
| JPM: 9.08% |
| JPM: 7.85% |
| JPM: 9.15% |
| V: 6.42% |
| BAC: 4.58% |
| V: 7.10% |
| V: 8.25% |
| MA: 6.13% |
| WFC: 3.79% |
| MA: 6.00% |
| MA: 6.91% |
| BAC: 3.64% |
| SPGI: 3.18% |
| BAC: 3.77% |
| BAC: 4.26% |
| WFC: 2.81% |
| GS: 2.64% |
| WFC: 2.75% |
| WFC: 3.22% |
| SPGI: 2.21% |
| BLK: 2.58% |
| SPGI: 2.37% |
| SPGI: 2.75% |
| GS: 1.94% |
| MMC: 2.37% |
| GS: 1.98% |
| GS: 2.30% |
| MMC: 1.81% |
| MS: 2.31% |
| BLK: 1.89% |
| MS: 2.09% |
| PGR: 1.78% |
| PGR: 2.24% |
| AXP: 1.81% |
| BLK: 2.08% |
Source: Seeking Alpha: 24 Nov 23
Importantly, VFH has multiple holdings that IYF and FNCL do not. VFH has 1.06% weight in PayPal ( PYPL ) which has been down 33% last 5 years. In contrast, IYF holds no weight on PYPL. VFH has almost half a percent weight on Block, Inc. ( SQ ), down 15% over last 5 years. IYF also has no weight on SQ. Therefore, VFH is overly diversified and does not place enough weight on top financial sector performers, while including several laggards. While one could counterargue that this represents a value buy for VFH, I will cover more on the strong fundamentals of these top performers later.
Performance, Expense Ratio, and Dividend Yield
As a result of these holdings distinctions, the overall performance for VFH has lagged its competitors. While all financial ETFs examined in this article lagged the S&P 500 index, VFH's total performance (YTD: 2.77%, 5-year: 30.99%, and 10-year: 94.55%) has been inferior to iShares' financial ETF, IYF, in all time periods examined.
A key redeeming quality for VFH, despite lower growth, is its expense ratio. Not surprisingly, the Vanguard fund has a low expense ratio at 0.10%. However, other leading competitor ETFs also have low expense ratios as well. The other bright point for VFH is its dividend yield. With a yield of 2.34% ((TTM)), it is the highest among financial ETFs considered. Even when considering a low expense ratio and high dividend yield, VFH lags IYF in overall, long-term returns.
Expense Ratio and Dividend Yield Comparison: VFH and Competitor ETFs
| VFH |
| IYF |
| FNCL |
| XLF |
| Expense Ratio |
| 0.10% |
| 0.40% |
| 0.08% |
| 0.10% |
| Dividend Yield |
| 2.34% |
| 1.80% |
| 2.15% |
| 1.89% |
Source: Seeking Alpha: 24 Nov 23
Outlook and Valuation
VFH has a P/E ratio of 12.3 and P/B ratio of 1.6, both lower than all competitors discussed in this article. However, I argue that this should not be misconstrued as an attractive buying opportunity for investors looking for a financial sector ETF. This is because the key holdings that VFH is underweight on, compared to its competitors, are showing strong growth and profitability potential.
First, BRK.B, only receives 8.5% weight with VFH versus over 13% with IYF and XLF. Warren Buffett's company has a long history of solid performance and is demonstrating strong potential for both growth and profitability. BRK.B's has a revenue growth ((FWD)) of 9.58% with a 21.9% net profit margin ((TTM)). Furthermore, due to the well-renowned diversification of Berkshire Hathaway, it has multiple diverse revenue streams fueling the company's growth.
Second, JPM also receives heavier weight with IYF and has a strong outlook. The company has a net income margin of 35.9%, return on common equity of 18.2% ((TTM)), and $53.9B cash from operations ((TTM)). JPM holds a P/E GAAP ((FWD)) of 9.22, 4% lower than its sector and 23% lower than its own 5-year average.
Finally, BAC's fundamentals also indicate that it is postured for growth. The company has a P/E GAAP ((FWD)) of 8.76, 9% lower than sector median, as well as a Price/Book ((FWD)) of 0.89, 14% lower than sector median. BAC also has a 31.5% net income margin ((TTM)) and $43.6B cash from operations ((TTM)), 31,000% higher than sector median.
Key Holding Metrics and Weights for VFH and IYF Compared
| BRK.B |
| JPM |
| BAC |
| MA |
| PYPL |
| VFH Weight |
| 8.5% |
| 7.8% |
| 3.6% |
| 6.1% |
| 1.1% |
| IYF Weight |
| 13.1% |
| 9.1% |
| 4.6% |
| 0% |
| 0% |
| Revenue Growth (YoY) |
| 18.1% |
| 18.1% |
| 5.7% |
| 12.6 |
| 7.7% |
| Net Income Margin ((TTM)) |
| 21.95% |
| 35.9% |
| 31.5% |
| 44% |
| 12.9% |
| P/E GAAP ((FWD)) |
| 21.5 |
| 9.22 |
| 8.8 |
| 34.41 |
| 15.3 |
| P/B ((FWD)) |
| 1.47 |
| 1.50 |
| 0.89 |
| 57.27 |
| 2.97 |
Source: Seeking Alpha, 24 Nov 23
Due to the comparatively lower weight on BRK.B, JPM, and BAC, VFH will continue to lag competitor ETFs. Additionally, VFH has weight on Mastercard Incorporated ( MA ) which has undesirable valuation metrics. MA has a P/E GAAP ((FWD)) of 34.41, 257% higher than its sector and higher than top performer financial stocks discussed above. As previously stated, VFH has weight on PYPL and SQ, both having undesirable valuation and recent performance history.
Volatility and Risks to Investors
Investors can expect volatility for the four major ETFs covered in this article as well as the financial sector overall. Not surprisingly, interest rate changes, recession fears, and inflation all have an impact on the financial sector. Higher interest rates have benefited banking stocks that have profited from the difference between the interest rate it borrows to what it lends. Therefore, when interest rates eventually decline, so may banking profits.
Additionally, banking stocks are especially sensitive to economic conditions. If a recession occurs, individual consumers are less likely to borrow money leading to reduced revenue for the financial sector. While speculation regarding recession chances in 2024 vary wildly, one Bloomberg model predicts a greater than 50% chance of recession sometime in 2024. TD Securities also recently predicted a 65% chance of recession for the U.S. in 2024.
As a result of these factors above, all major financial ETFs covered in this article have greater volatility than the market overall. Vanguard gives VFH a 5/5 for risk versus reward scale. VFH's beta value is 1.03, the lowest compared to major competitors: IYF (1.19), XLF (1.1), and FNCL (1.11).
Concluding Summary
Any long-term ETF investor knows that even slight differences in holdings can make a large difference for the fund's performance over time. Due to VFH's large number of holdings, it is overly diversified resulting in lower performance than competitors. VFH's key advantage is its low expense ratio and high dividend yield. However, even when factoring in these advantages, VFH's total return is sub-optimal.
Due to VFH's holdings mix, it will likely underperform in coming years. BRK.B, JPM, and BAC are primed for growth and have a comparatively lower weight with VFH compared to IYF and XLF. These stocks are fairly valued given their potential for growth and profitability. In contrast, VFH's weight on stocks like MA, PYPL, and SQ will drag the fund's performance down. Therefore, ETFs like IYF will likely outperform VFH looking forward. To conclude, VFH is a hold for me. Despite its low cost, relatively high dividend, and comparatively low volatility, IYF and perhaps XLF will be better performing financial sector ETFs.
For further details see:
VFH: Solid Choice, But Still Not The Best Financial Sector ETF