CGDV - VLUE Has Been Lagging Competitors For 12 Months
2023-08-07 19:02:28 ET
Summary
- iShares MSCI USA Value Factor ETF selects and weights stocks based on 3 valuation ratios.
- It keeps sector weights close to the benchmark, so it doesn’t overweight financials like most value ETFs.
- VLUE has lagged other large-cap value ETFs in the last 12 months.
- Two shortcomings of value indexes.
This article series aims at evaluating ETFs (exchange-traded funds) regarding past performance and portfolio metrics. Reviews with updated data are posted when necessary.
VLUE strategy and portfolio
iShares MSCI USA Value Factor ETF ( VLUE ) started investing operations on 4/16/2013 and tracks the MSCI USA Enhanced Value Index. It has 151 holdings, an expense ratio of 0.15%, and a distribution yield of 3.03%. Distributions are paid quarterly.
As described in the prospectus by iShares , a value score is calculated in a universe of U.S. large and mid-capitalization stocks. It is based on three metrics: price-to-book value, price-to-forward earnings and enterprise value-to-cash flow from operations. Constituents of the underlying index are updated twice a year with a proprietary algorithm using this value score. Their weights are calculated as the product of market capitalization and value score, then normalized so that sectors weights are the same in the underlying index and in the stock universe. The portfolio turnover rate was 17% in the most recent fiscal year.
VLUE invests almost exclusively in U.S. companies (98.3% of asset value), with about 55% in large caps and 44% in mid-caps. As reported in the next table, the aggregate valuation ratios of VLUE are much lower than for the SPDR S&P 500 ETF ( SPY ):
| VLUE |
| SPY |
| Price/Earnings TTM |
| 11.87 |
| 23.32 |
| Price/Book |
| 1.54 |
| 4.1 |
| Price/Sales |
| 0.94 |
| 2.62 |
| Price/Cash Flow |
| 7.35 |
| 16.37 |
Source: Fidelity.
The underlying index intends to keep the same sector weights as a large and mid-cap universe at each rebalancing. Therefore, it is not a surprise to find them very close to the S&P 500 sector breakdown. Minor drifts can be expected between rebalancing dates due to constituent weights taking into account the value score.
VLUE sector breakdown (chart: author; data: iShares, SSGA)
The top 10 holdings, listed in the next table with weights and valuation ratios, represent 33% of asset value. The largest position weighs 5.41%, so risks related to individual companies are moderate.
| Ticker |
| Name |
| Weight % |
| P/E TTM |
| P/E Fwd |
| P/Sales TTM |
| P/Book |
| P/FCF |
| Yield% |
| Intel Corp. |
| 5.41 |
| N/A |
| 55.60 |
| 2.73 |
| 1.46 |
| N/A |
| 1.42 |
| Cisco Systems, Inc. |
| 4.81 |
| 18.90 |
| 13.83 |
| 3.94 |
| 5.11 |
| 20.48 |
| 2.96 |
| AT&T Inc. |
| 4.72 |
| N/A |
| 5.78 |
| 0.83 |
| 0.99 |
| 15.76 |
| 7.93 |
| Micron Technology, Inc. |
| 3.14 |
| N/A |
| N/A |
| 4.21 |
| 1.68 |
| N/A |
| 0.66 |
| Pfizer Inc. |
| 3.1 |
| 9.32 |
| 10.59 |
| 2.57 |
| 1.98 |
| 13.22 |
| 4.68 |
| International Business Machines Corp. |
| 2.81 |
| 66.89 |
| 15.06 |
| 2.19 |
| 5.97 |
| 30.79 |
| 4.60 |
| General Motors Co. |
| 2.7 |
| 5.11 |
| 4.76 |
| 0.30 |
| 0.71 |
| N/A |
| 0.98 |
| Ford Motor Co. |
| 2.15 |
| 12.60 |
| 6.38 |
| 0.31 |
| 1.19 |
| 171.91 |
| 4.65 |
| Wells Fargo & Co. |
| 2.13 |
| 11.19 |
| 9.29 |
| 1.34 |
| 1.04 |
| 5.42 |
| 3.12 |
| Applied Materials, Inc. |
| 2.09 |
| 19.21 |
| 19.73 |
| 4.65 |
| 8.73 |
| 24.55 |
| 0.88 |
Ratios: Portfolio123.
Since inception (4/16/2013), VLUE has underperformed the S&P 500 by 3.4 percentage points in annualized return. Moreover, it shows a higher risk measured in maximum drawdown and standard deviation of monthly returns (“volatility” in the next table).
| Total Return |
| Annual.Return |
| Drawdown |
| Sharpe ratio |
| Volatility |
| VLUE |
| 149.33% |
| 9.29% |
| -39.47% |
| 0.55 |
| 17.10% |
| SPY |
| 242.02% |
| 12.70% |
| -33.72% |
| 0.82 |
| 14.84% |
Data calculated with Portfolio123.
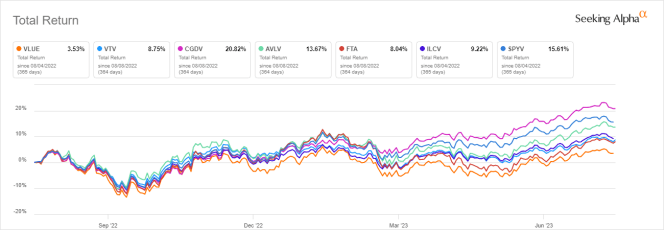
The next chart compares the 12-month total returns of VLUE and six other large cap value ETFs:
- Vanguard Value ETF ( VTV ),
- Capital Group Dividend Value ETF ( CGDV ),
- Avantis U.S. Large Cap Value ETF ( AVLV ),
- First Trust Large Cap Value AlphaDEX Fund ( FTA ),
- iShares Morningstar Value ETF ( ILCV ),
- SPDR Portfolio S&P 500 Value ETF ( SPYV ).
VLUE has been the worst performer of this list in one year. The best one is CGDV.
VLUE vs competitors, 12-month return (Seeking Alpha)
Comparing VLUE with my Dashboard List model
The Dashboard List is a list of 80 stocks in the S&P 1500 index, updated every month based on a simple quantitative methodology. All stocks in the Dashboard List are cheaper than their respective industry median in Price/Earnings, Price/Sales and Price/Free Cash Flow. After this filter, the 10 companies with the highest Return on Equity in every sector are kept in the list. Some sectors are grouped together: energy with materials, communication with technology. Real estate is excluded because these valuation metrics don't work well in this sector. I have been updating the Dashboard List every month on Seeking Alpha since December 2015, first in free-access articles, then in Quantitative Risk & Value.
The next table compares VLUE performance since inception with the Dashboard List model, with a tweak: here the Dashboard List is reconstituted annually to make it comparable to a passive index.
| Total Return |
| Annual Return |
| Drawdown |
| Sharpe ratio |
| Volatility |
| VLUE |
| 149.33% |
| 9.29% |
| -39.47% |
| 0.55 |
| 17.10% |
| Dashboard List (annual) |
| 235.72% |
| 12.49% |
| -41.13% |
| 0.67 |
| 18.54% |
Past performance is not a guarantee of future returns. Data Source: Portfolio123.
The Dashboard List outperforms VLUE by 3.2 percentage points in annualized return. However, ETF price history is real, whereas the list simulation is hypothetical.
Two common shortcomings of value ETFs
Most value indexes have two weaknesses, and VLUE is no exception. The first one is to classify all stocks on the same criteria. It means valuation ratios are considered comparable across sectors. Obviously, they are not: my monthly dashboard here shows how valuation and quality metrics may vary across sectors. By fixing sectors weights at the benchmark values, the fund partly avoids this trap. It doesn’t overweight sectors and industries with naturally lower valuation ratios (especially financials). Nonetheless, it doesn’t compare a stock to its industry peers.
The second weakness comes from the price/book ratio (P/B), which adds some risk in the strategy. Historical data show that a large group of companies with low P/B has a higher volatility and deeper drawdowns than a same-size group with low price/earnings, price/sales or price/free cash flow. The next table shows the return and risk metrics of the cheapest quarter of the S&P 500 (i.e., 125 stocks) measured in price/book, price/earnings, price/sales and price/free cash flow. The sets are reconstituted annually between 1/1/2000 and 1/1/2023 with elements in equal weight.
| Annual Return |
| Drawdown |
| Sharpe ratio |
| Volatility |
| Cheapest quarter in P/B |
| 8.54% |
| -81.55% |
| 0.35 |
| 37.06% |
| Cheapest quarter in P/E |
| 10.71% |
| -73.62% |
| 0.48 |
| 25.01% |
| Cheapest quarter in P/S |
| 12.82% |
| -76.16% |
| 0.47 |
| 34.83% |
| Cheapest quarter in P/FCF |
| 15.32% |
| -74.77% |
| 0.61 |
| 27.03% |
Data calculated with Portfolio123.
This explains why I use P/FCF and not P/B in the Dashboard List model.
Takeaway
iShares MSCI USA Value Factor ETF selects and weights large and mid-cap stocks based on three valuation ratios. It keeps sector weights very close to the benchmark. Doing so, the fund avoids overweighting sectors and industries with naturally low valuation ratios (especially financials). VLUE has lagged SPY by a wide margin since inception. It has also underperformed six of its close competitors in the last 12 months. Like most value ETFs, it suffers from two methodological shortcomings: ranking stocks regardless of their industries, and relying too much on the price/book ratio.
For further details see:
VLUE Has Been Lagging Competitors For 12 Months