JAAA - VRIG: Floating Rate Investment Grade Securities May Not Be The Best Bet Right Now
2023-10-19 14:38:17 ET
Summary
- The Invesco Variable Rate Investment Grade ETF provides exposure to floating rate investment grade securities.
- The VRIG ETF has delivered modest historical returns with a 5.6% distribution yield.
- It is hard to recommend the VRIG ETF, as its performance is middling compared to alternative funds.
With long-term interest rapidly rising, many investors have been switching from fixed-rate bond funds to floating rate funds in order to minimize duration risk. The Invesco Variable Rate Investment Grade ETF ( VRIG ) is one such floating rate bond fund.
VRIG provides exposure to floating rate investment grade securities like floating rate treasuries, corporate bonds, and structured securities. While the VRIG ETF pays an attractive 5.6% distribution yield, I struggle to find a reason why investors should prefer it over alternative funds. Simply put, VRIG's strategy of buying floating rate investment grade securities offer middling performance.
Fund Overview
The Invesco Variable Rate Investment Grade ETF is an actively managed ETF that provides exposure to floating rate investment grade securities. The VRIG ETF's mandate includes investments in floating rate US Treasuries, government sponsored agency mortgage-backed securities ("MBS"), US Agency debt, structured securities and floating rate investment grade corporate securities. The VRIG ETF may also invest in other securities including up to 20% in non-investment grade securities.
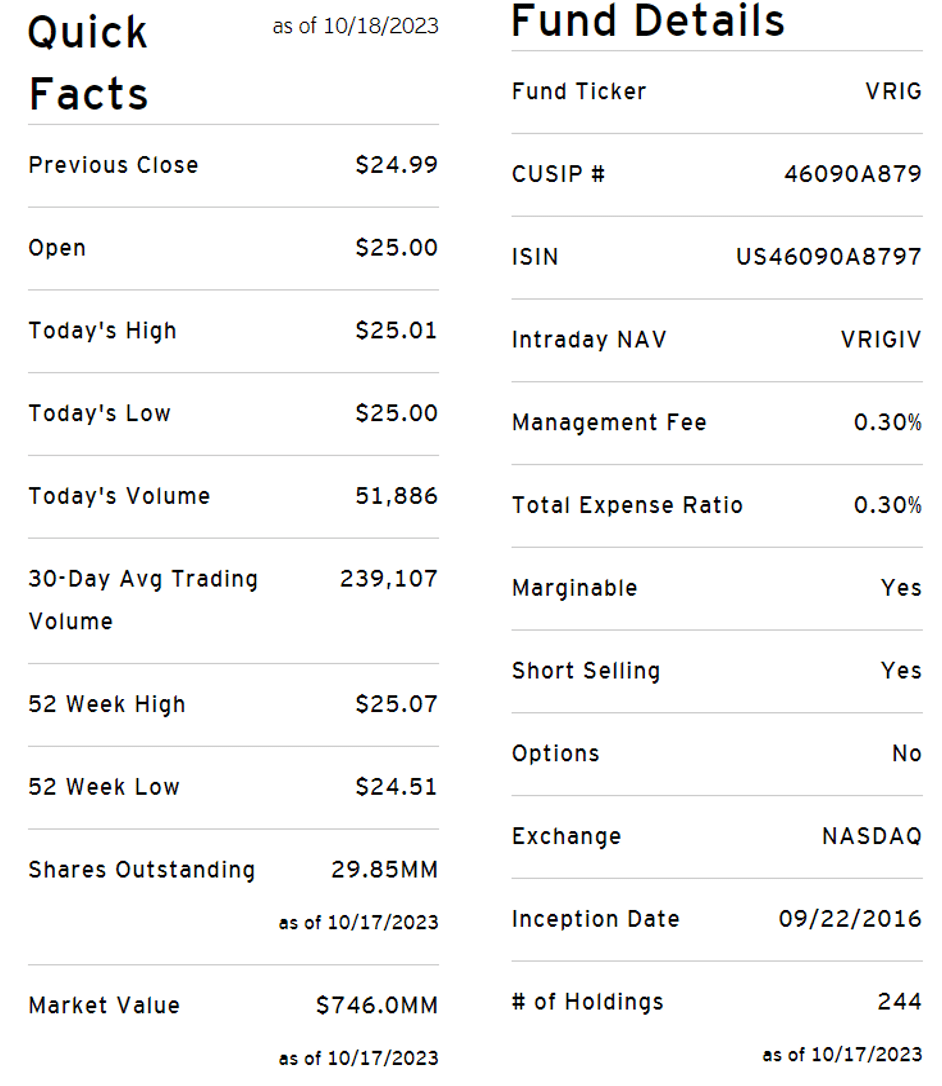
The VRIG ETF has $746 million in assets and charge a 0.3% expense ratio (Figure 1).
Figure 1 - VRIG overview (invesco.com)
Portfolio Holdings
In terms of sector allocation, the VRIG ETF has 38.5% allocation to corporate securities, 37.5% to securitized securities, and 23.9% allocation to treasury securities as of September 30, 2023 (Figure 2).
Figure 2 - VRIG sector allocation (VRIG factsheet)
VRIG's portfolio is predominantly domiciled in the US, with 84.1% weight. There are a handful of securities from the U.K. (4.0%), Netherlands (2.9%), Canada (2.7%), and Germany (2.2%) (Figure 3).
Figure 3 - VRIG geographical allocation (VRIG factsheet)
Figure 4 shows the VRIG ETF's credit quality allocation. 34.7% of the portfolio is AAA-rated, 17.6% is AA-rated, 28.0% is A-rated and 18.5% is BBB-rated.
Figure 4 - VRIG credit quality allocation (VRIG factsheet)
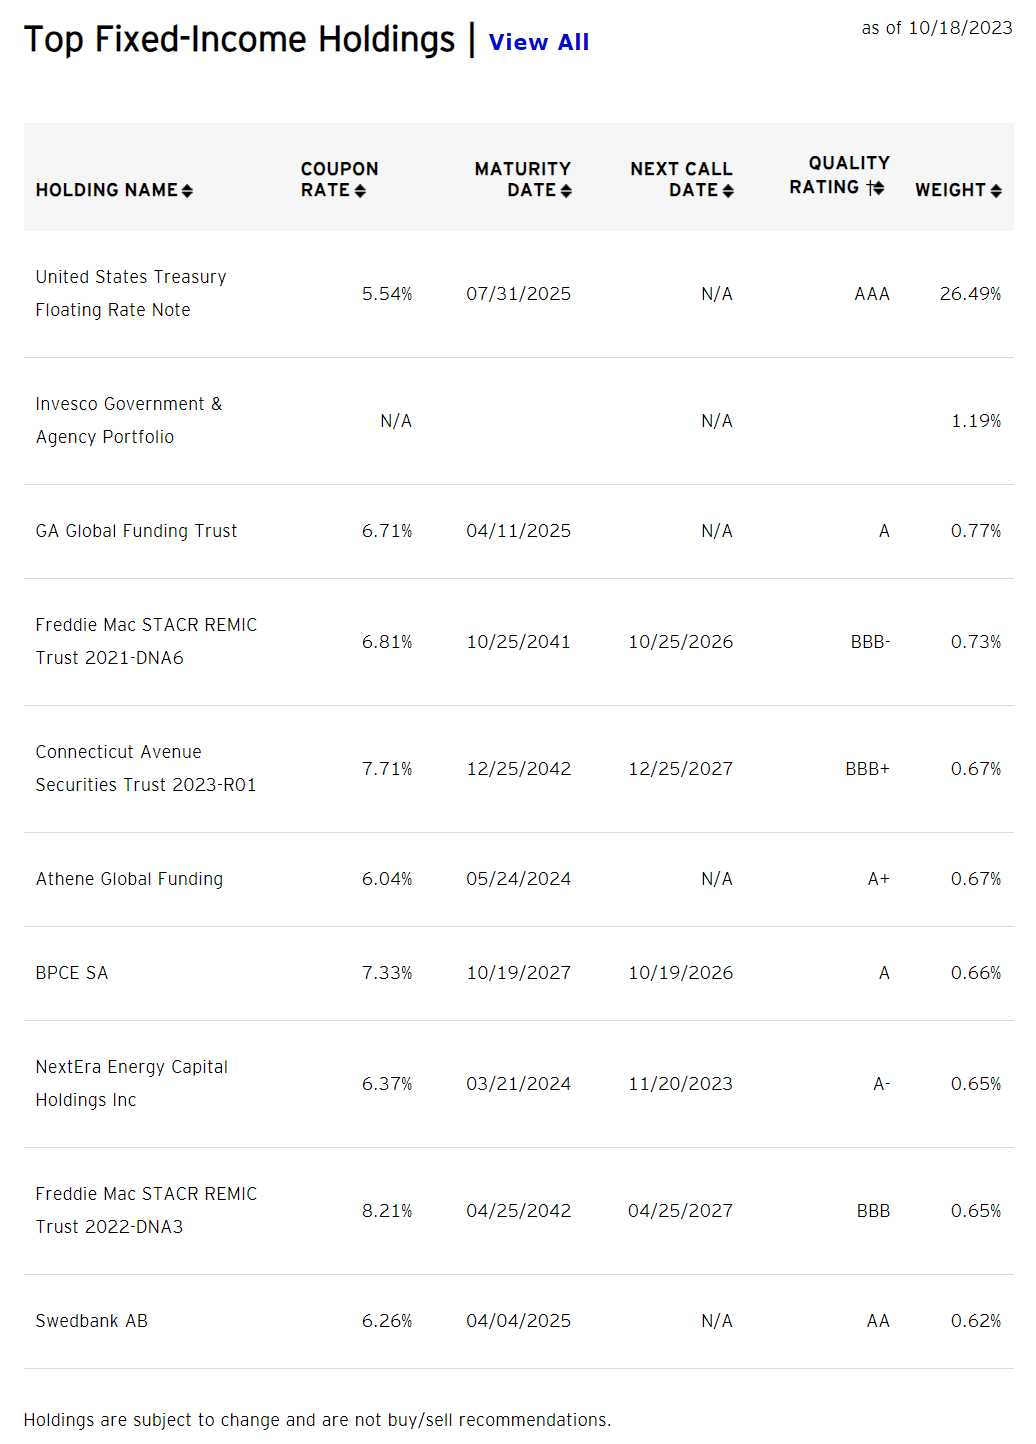
Aside from a large holding in floating rate US treasury notes, the VRIG ETF's portfolio is broadly diversified, with no single issuer holding more than a 1% weight (Figure 5). In total, VRIG holds 245 securities, so the average holding has a 0.3% weight.
Distribution & Yield
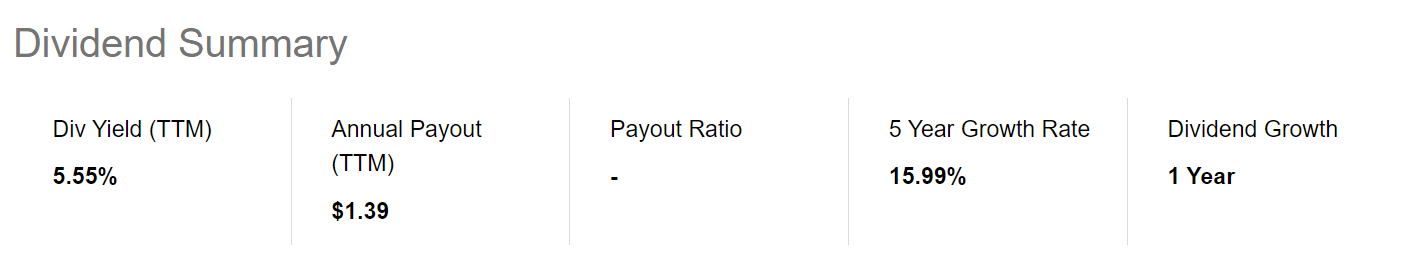
The VRIG ETF's portfolio has a 30-Day SEC yield of 6.3%. The fund is paying a trailing 12-month distribution yield of 5.6% (Figure 6). VRIG's distribution is paid monthly.
Returns
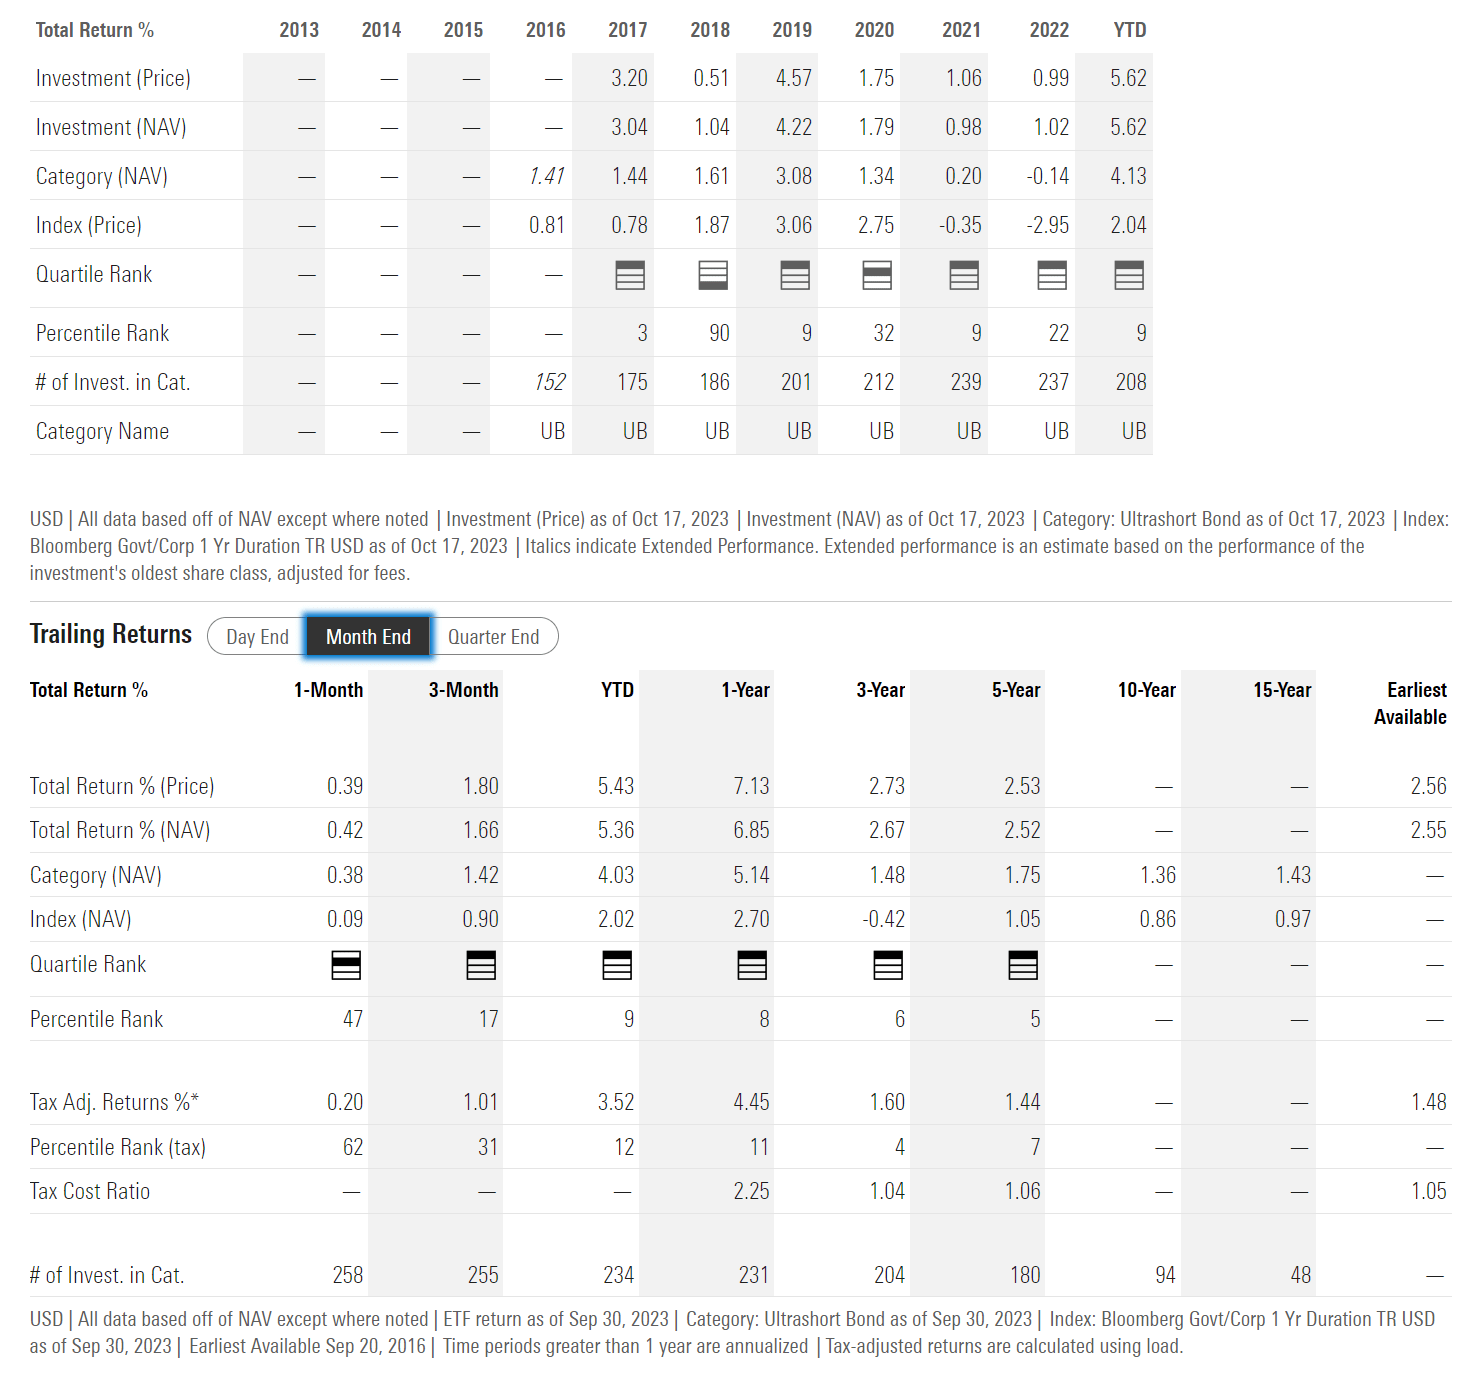
The VRIG ETF historically has delivered modest returns, with 3 and 5 year average annual returns of 2.7% and 2.5% respectively to September 30, 2023 (Figure 7).
Figure 6 - VRIG historical returns (morningstar.com)
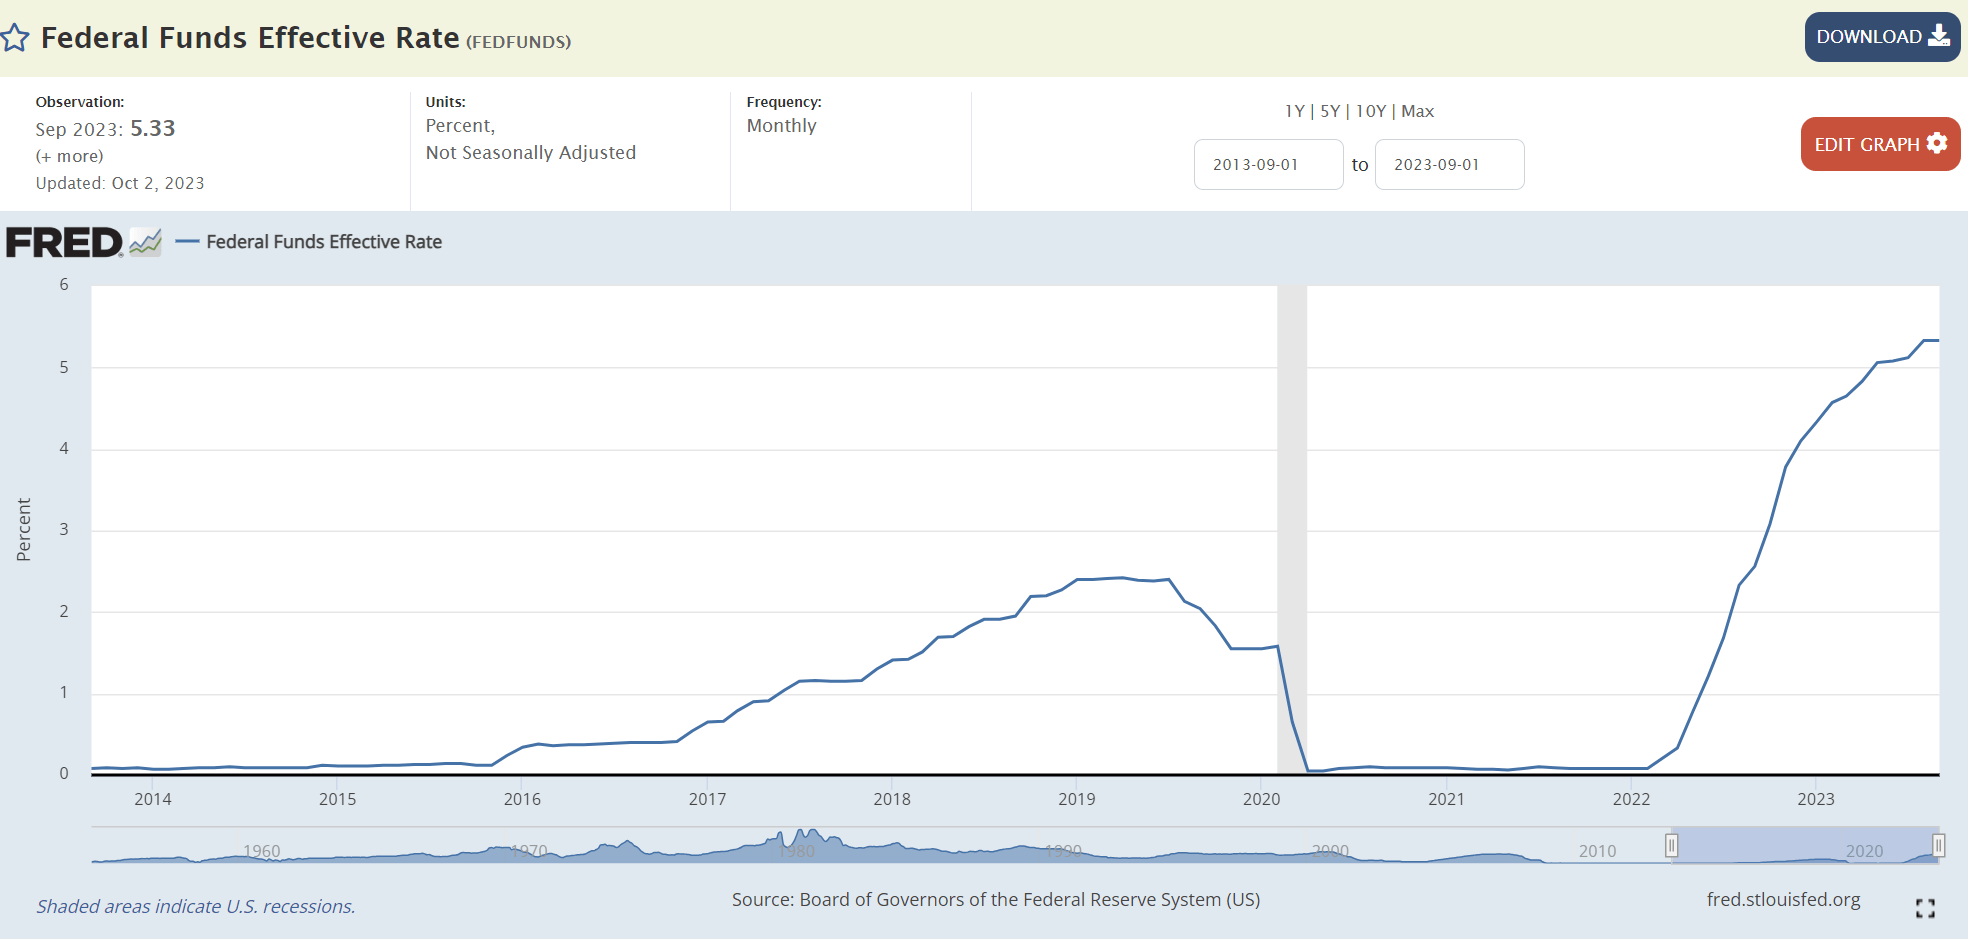
Since March 2022, the Federal Reserve have significantly raised short-term interest rates and VRIG's returns have likewise scaled higher as it holds floating rate investments that track short-term interest rates. Short-term Fed Funds rate are now the highest in the past decade (Figure 8).
Figure 8 - Fed Funds rate is now at decade highs (St. Louis Fed)
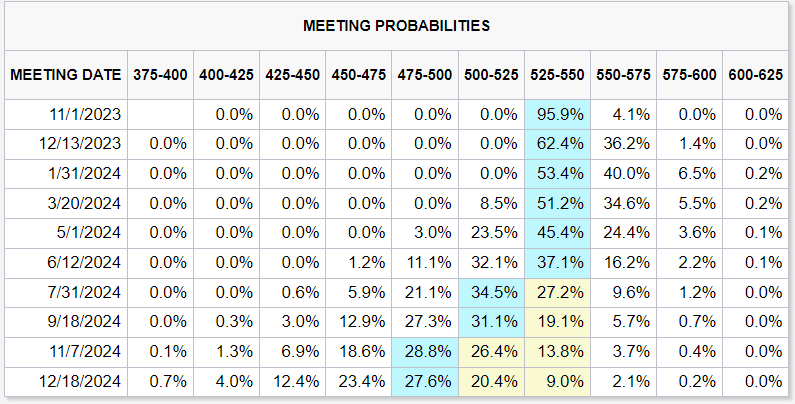
However, with the Federal Reserve now widely expected to be at or near the end of its current rate hiking cycle (most analysts are expecting at most 1 more interest rate hike), investors holding floating rate investments should start to consider the forward returns if short-term interest rates have indeed reached a peak (Figure 9).
Figure 9 - Analysts are expected end of rate hiking cycle (CME)
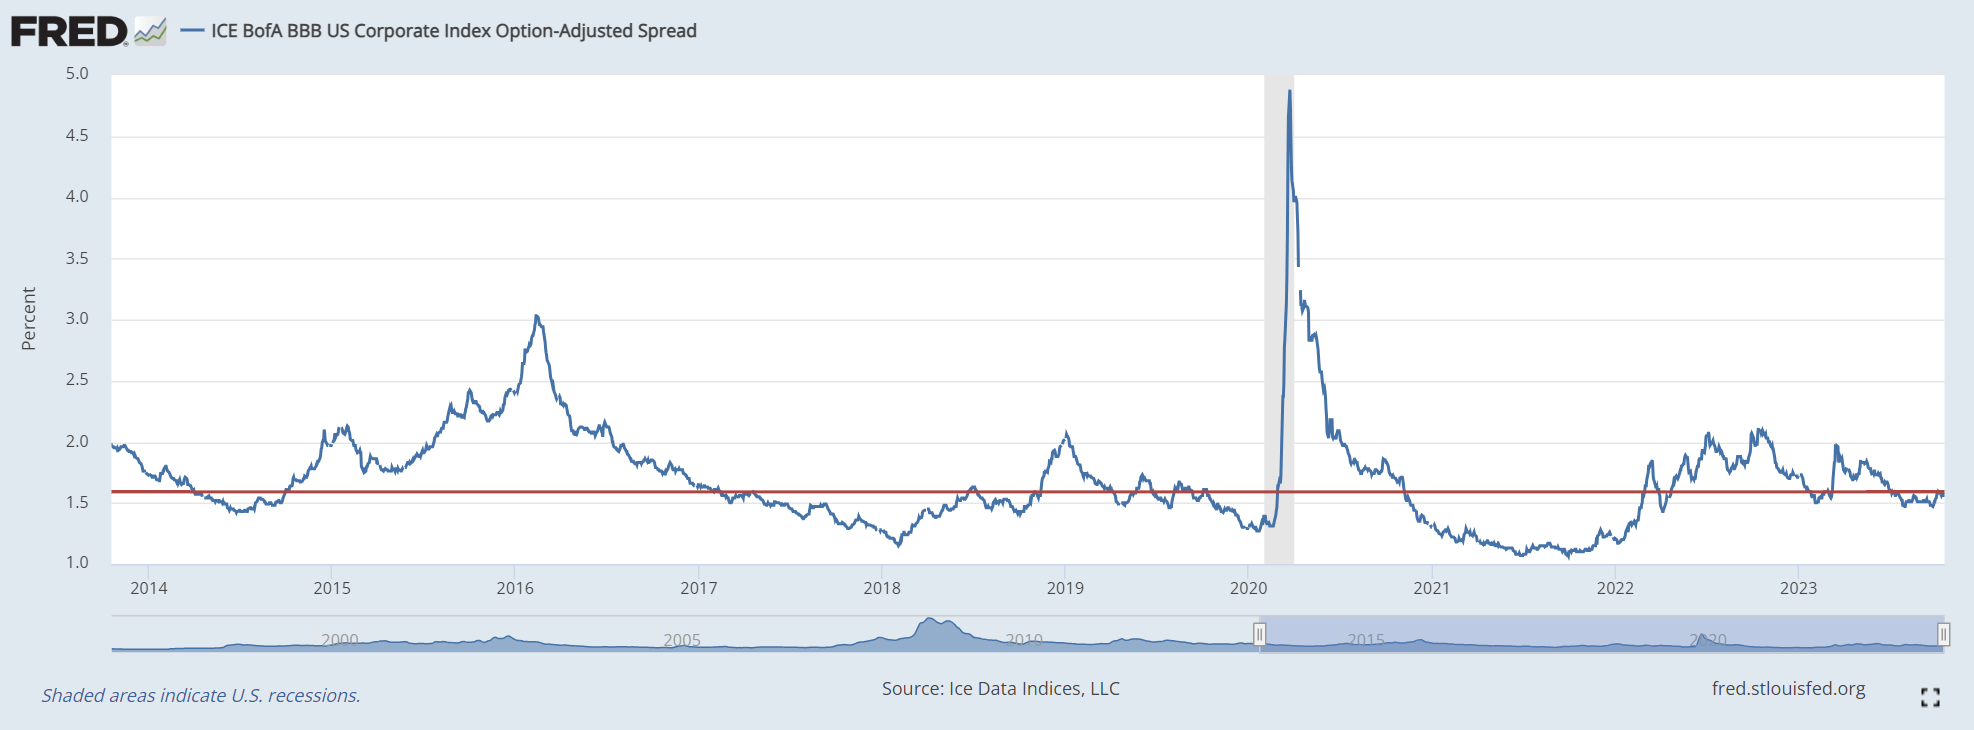
Broadly speaking, future returns of the VRIG ETF can be thought of as earning short-term interest rates (for example, 3 month treasury bill yields) plus an investment grade credit spread. Historically, BBB credit spreads (the lowest investment grade rating) has averaged 1.59% over the past decade (Figure 10).
So all-in, investors could be looking at 6.5-7.0% gross returns, or ~6.5% returns, net of expenses. This is consistent with what the VRIG ETF has delivered in the past year. So returns for VRIG are about as good as it gets.
VRIG vs. Comparable Funds
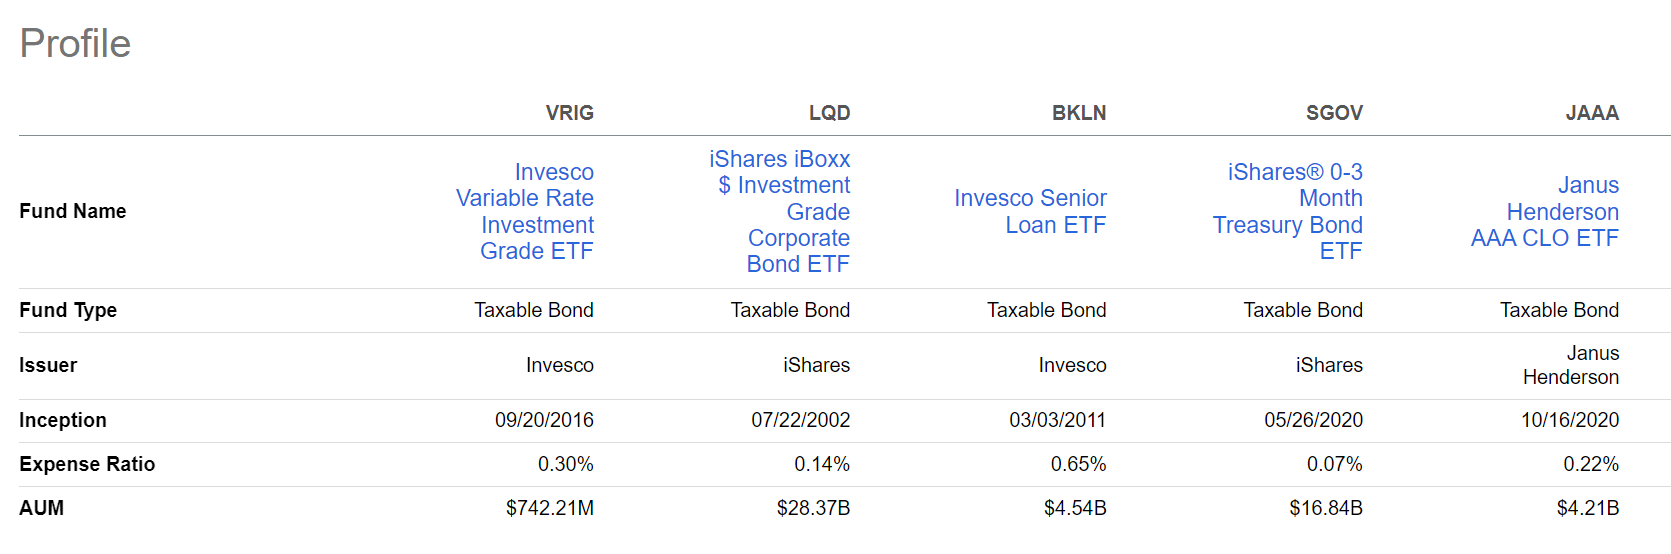
However, to properly assess the attractiveness of the VRIG ETF going forward, I believe we need to consider the potential risks the VRIG ETF holds, and compare it against other alternative investment funds on the market like the iShares iBoxx $ Investment Grade Corporate Bond ETF ( LQD ), the Invesco Senior Loan ETF ( BKLN ), the iShares 0-3 Month Treasury Bond ETF ( SGOV ), and the Janus Henderson AAA CLO ETF ( JAAA ).
First, let me briefly discuss these comparable fund strategies: the LQD ETF invests in fixed-rate investment grade corporate bonds with a portfolio duration of 8.0 years; BKLN invests in non-investment grade floating rate leveraged loans; SGOV invests in floating rate treasury bills between zero to 3 month maturities; and finally, the JAAA ETF invests in floating rate AAA-rated tranches of collateralized loan obligations ("CLOs"). I have written longer articles discussing these comparable funds here , here , and here .
Compared to LQD, the obvious difference is interest rate risk, as VRIG is floating rate investment grade bonds while LQD is fixed-rate. The difference between VRIG and BKLN/SGOV/JAAA lies in their respective credit risks.
If we consider the macro environment, there are 2 key scenarios investors should consider. First, there is a risk that 'higher for longer' monetary policies from the Federal Reserve will cause an economic slowdown, and perhaps even a recession. If that were to occur, then credit spreads will widen, and the VRIG ETF may suffer from realized/unrealized losses on its credit investments. In this scenario, the absolute safety of SGOV would be preferred over VRIG's portfolio. Also, the AAA-rated CLO investments in JAAA should outperform VRIG, since CLOs have structural enhancements to protect senior tranche security holders.
Furthermore, if the economy does fall into recession, there is a high likelihood that the Federal Reserve will lower short-term interest rates to stimulate the economy, in which case VRIG's returns will also scale lower. If expectations for much lower interest rates were to occur, then the LQD ETF should outperform VRIG, as LQD's portfolio is positively impacted by lower long-term interest rates (from its 8.0 year duration) and negatively impacted by wider credit spreads while VRIG is negatively impacted by both.
On the other hand, if the economy proves resilient, then the BKLN ETF should outperform VRIG, as BKLN's non-investment grade leveraged loans earn a higher credit spread than VRIG.
I struggle to imagine a scenario in which VRIG is expected to outperform this peer group, as it requires short-term interest rates to remain high, but non-investment grade credit spreads to widen significantly without impacting investment grade credit spreads.
Figure 11 compares the fund structure of VRIG against this peer group. The VRIG charges a 0.30% expense ratio, which is middle of the pack.
VRIG's trailing 5.6% distribution yield is also middling (Figure 12). The BKLN ETF pays the highest yield, as its non-investment grade leveraged loan holdings are now yielding 8-10%.
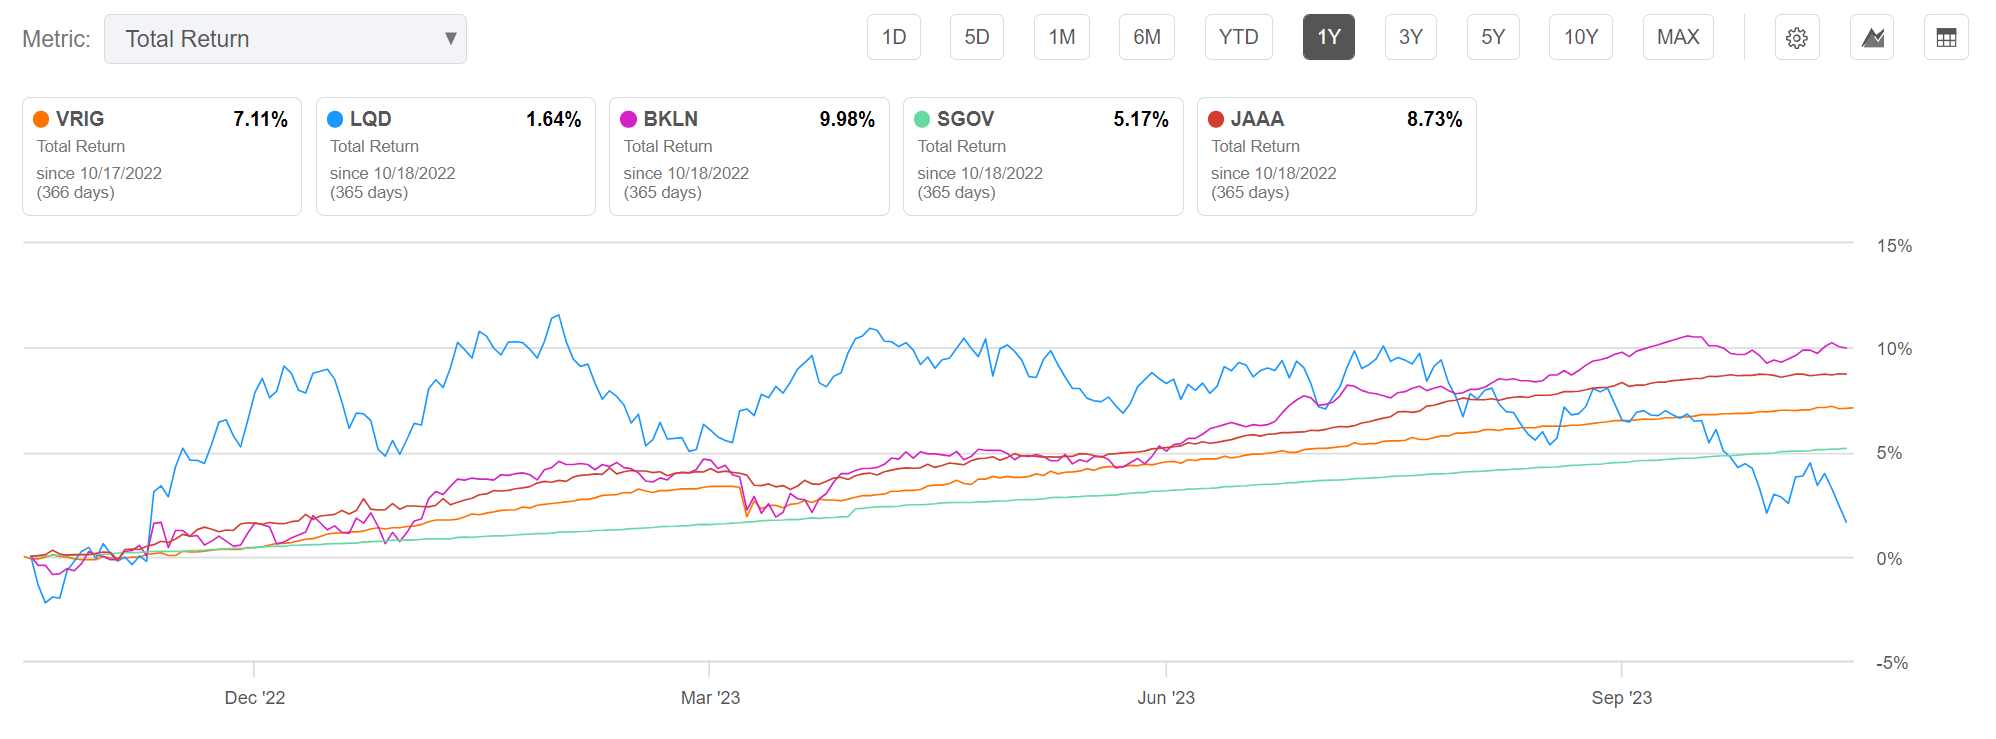
Finally, Figure 13 and 14 compare trailing total returns of the funds on a 1 and 3 year basis. As expected, VRIG does not excel against this selected peer group, with a 1 year total return of 7.1%, lagging BKLN at 10.0% and JAA at 8.7%
Figure 13 - VRIG vs. peers, 1 yr total return (Seeking Alpha)
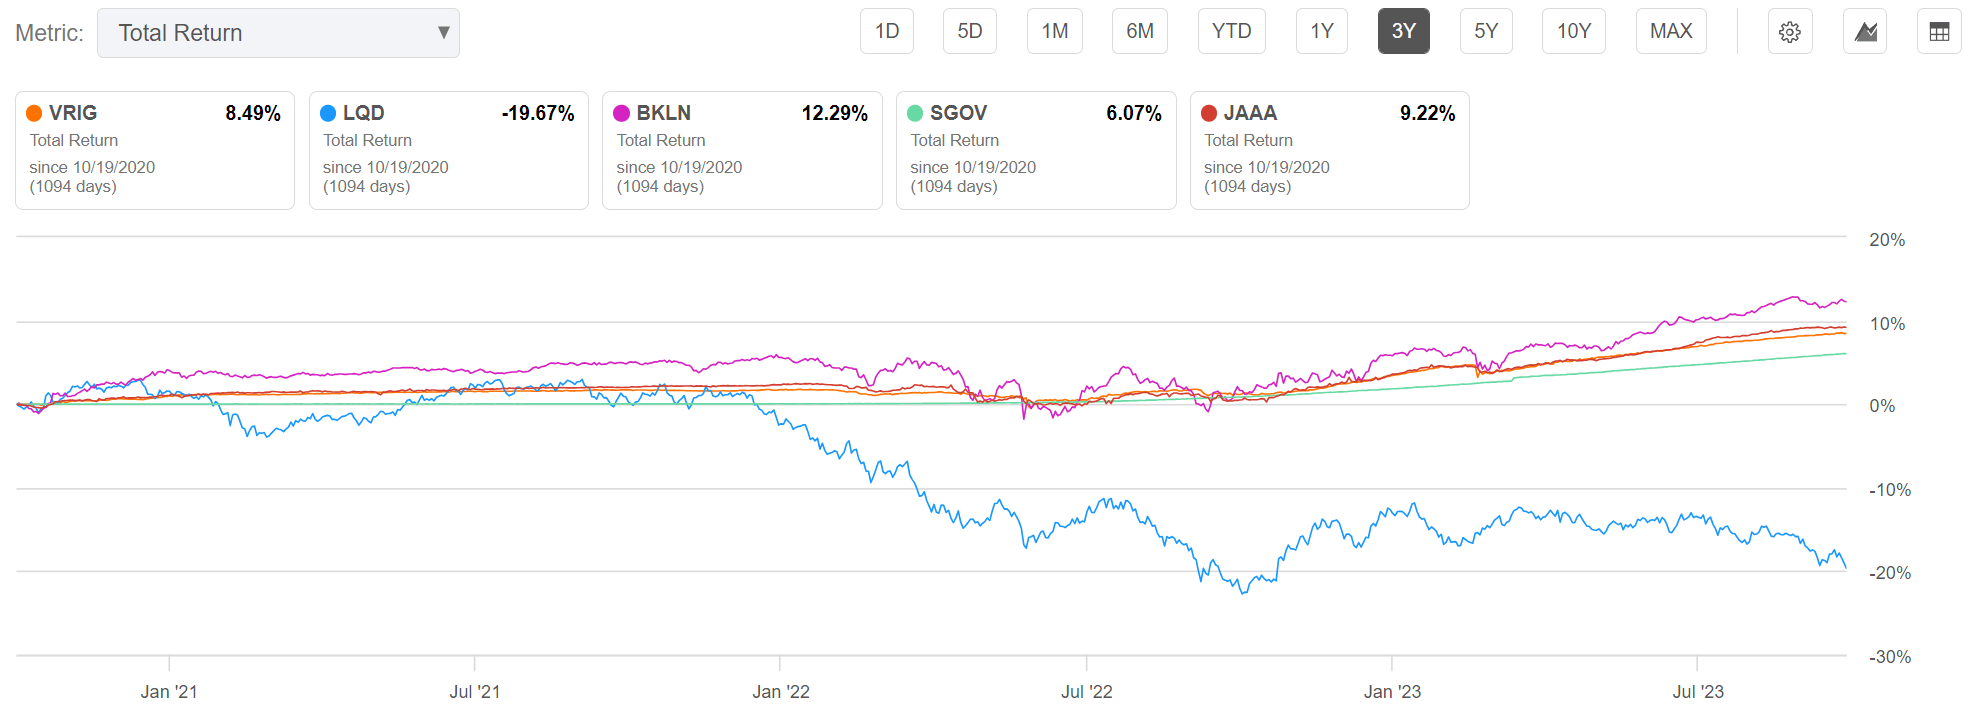
On a 3 year basis, the VRIG ETF has total returns of 8.5% compared to BKLN at 12.3% and JAAA at 9.2% (Figure 14).
Figure 14 - VRIG vs. peers, 3 yr total returns (Seeking Alpha)
Overall, considering the two main scenarios above, economic slowdown vs. no economic slowdown, we can see that VRIG is not expected to outperform in either scenario. In an economic slowdown scenario, SGOV and LQD are expected to outperform VRIG. In a steady economy scenario, BKLN and JAAA are expected to outperform.
Conclusion
The Invesco Variable Rate Investment Grade ETF ((VRIG)) provides exposure to floating rate investment grade securities such as treasuries and corporate bonds. Overall, the VRIG ETF has delivered modest returns and pay a 5.6% yield, commensurate with modest credit risk on top of elevated short-term yields.
Looking forward, I struggle to find a reason investors should own the VRIG ETF compared to alternative investment funds. If investors are bearish the economy, then they should prefer SGOV and LQD over VRIG. If they are bullish on the economy, then BKLN and JAAA should outperform VRIG. Overall, I rate the VRIG a hold .
For further details see:
VRIG: Floating Rate Investment Grade Securities May Not Be The Best Bet Right Now