SPGP - VYM Vs. VTV: $200B In AUM But Vanguard's Dividend And Value ETFs Have Major Growth Problems
2023-11-29 10:33:16 ET
Summary
- VYM and VTV are high dividend and value ETFs offered by Vanguard with a combined $200 billion in AUM. Yields are 3.17% and 2.60%, and fees are 0.06% and 0.04%.
- This article compares both funds based on historical performance and current fundamentals, revealing there isn't much separating the two, driven by a 64% overlap by weight.
- VYM offers a better yield and cheaper valuation, but VTV includes Berkshire Hathaway and generally offers better growth potential. It's a toss-up, but growth is extremely weak in both cases.
- I looked into a few complementary ETFs to consider, including VIG, SPGP, MOAT, and QUAL. Each has a unique strategy and structure, but the main takeaway is to avoid being a strict value investor.
- Vanguard's Growth ETF has outperformed VTV by 38% this year alone, and that's a gap value investors might never be able to close.
Introduction
The Vanguard High Dividend Yield ETF ( VYM ) and the Vanguard Value ETF ( VTV ) have nearly $200 billion in combined assets under management and purport to follow different strategies. Earlier this year, I covered VYM here and VTV here , concluding that both were solid funds despite a relatively poor start to the year. However, the two ETFs have a 64% overlap, and it's most efficient for investors to select just one. Therefore, this article compares VYM and VTV based on current fundamentals and historical performance and determines which one I prefer moving forward. In addition, I will highlight both funds' concerning lack of growth potential and suggest alternative ETFs to bridge the gap. I hope you enjoy the read.
Overview
Strategy Comparison
Launched in November 2006, VYM tracks a proprietary Index derived from the FTSE Global Equity Index series, selecting from a universe representing nearly the entire U.S. investable equity universe. The Index excludes REITs and other securities with unique structures, selections are based on forecasted dividend yields, and reconstitutions are annual, with low turnover prioritized. You'll find many recognizable names in VYM's top ten holdings list, suggesting the weighting scheme incorporates size in addition to yield. One popular method is a dividend-dollar weighting scheme, which weights based on the product of a company's dividend yield and shares outstanding. It's also the preferred weighting scheme for many WisdomTree dividend ETFs.
In contrast, VTV is more transparent. Tracking the CRSP US Large Cap Value Index, VTV holds large-cap securities based on five factors:
- Book-To-Price Ratio
- Future Earnings-To-Price Ratio
- Historical Earnings-To-Price Ratio
- Dividend-To-Price Ratio
- Sales-To-Price Ratio
The Index incorporates dividends, typical for many value strategies, but traditional valuation ratios drive the selections. As discussed in a prior article , I prefer forward-looking metrics, and unfortunately, trailing metrics dominate the Index's selection process. Still, it's better than what S&P Style Indices offer, reflected in funds like the Vanguard 500 Value ETF ( VOOV ).
Top Ten Holdings and Sector Exposures
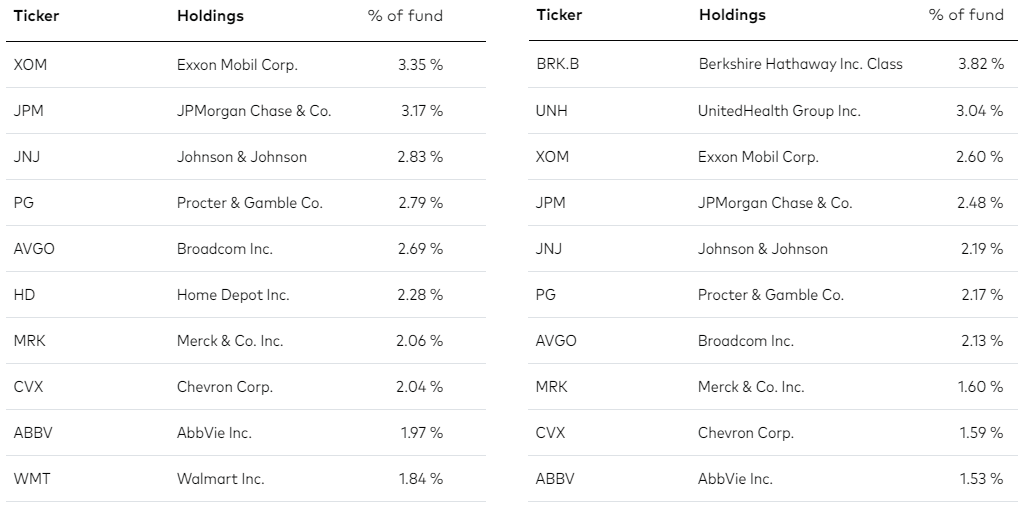
The top ten holdings for VYM (left) and VTV (right) are highlighted below, representing 25.02% and 23.15% of their portfolios, respectively. One key difference is that VTV holds Berkshire Hathaway ( BRK.B ), and since the security does not pay a dividend, it's excluded in VYM. There are some similarities, though. Exxon Mobil ( XOM ), JPMorgan Chase ( JPM ), Johnson & Johnson ( JNJ ), Procter & Gamble ( PG ), Broadcom ( AVGO ), Merck & Co. ( MRK ), Chevron ( CVX ), and AbbVie ( ABBV ) are common to both top ten lists.
This considerable overlap is why I recommend investors choose one or the other, as holding both isn't an efficient use of capital. The ETF Research Center reports a 64% overlap by weight , and as you'll see shortly, the long-term performance charts are also similar.
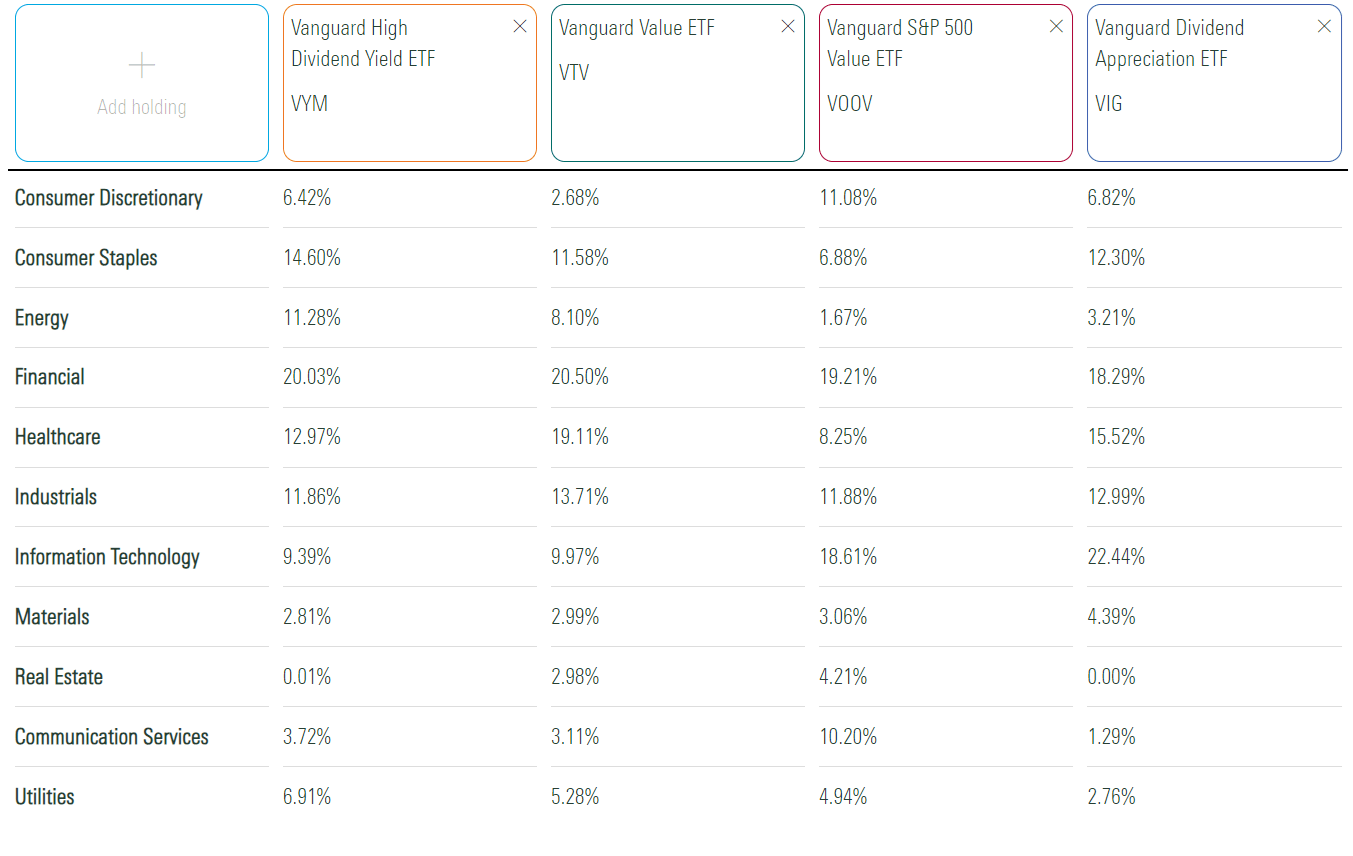
Sector exposures for VYM and VTV are listed below, and I've included VOOV and the Vanguard Dividend Appreciation ETF ( VIG ) as comparators. As shown, the four have a lot of similarities at this level, but VYM overweights Consumer Staples and Utilities, two defensive sectors. Also, it overweights Energy, which helped it perform relatively well last year, but the sector's unpredictability somewhat offsets its defensive leans elsewhere.
Performance Comparison
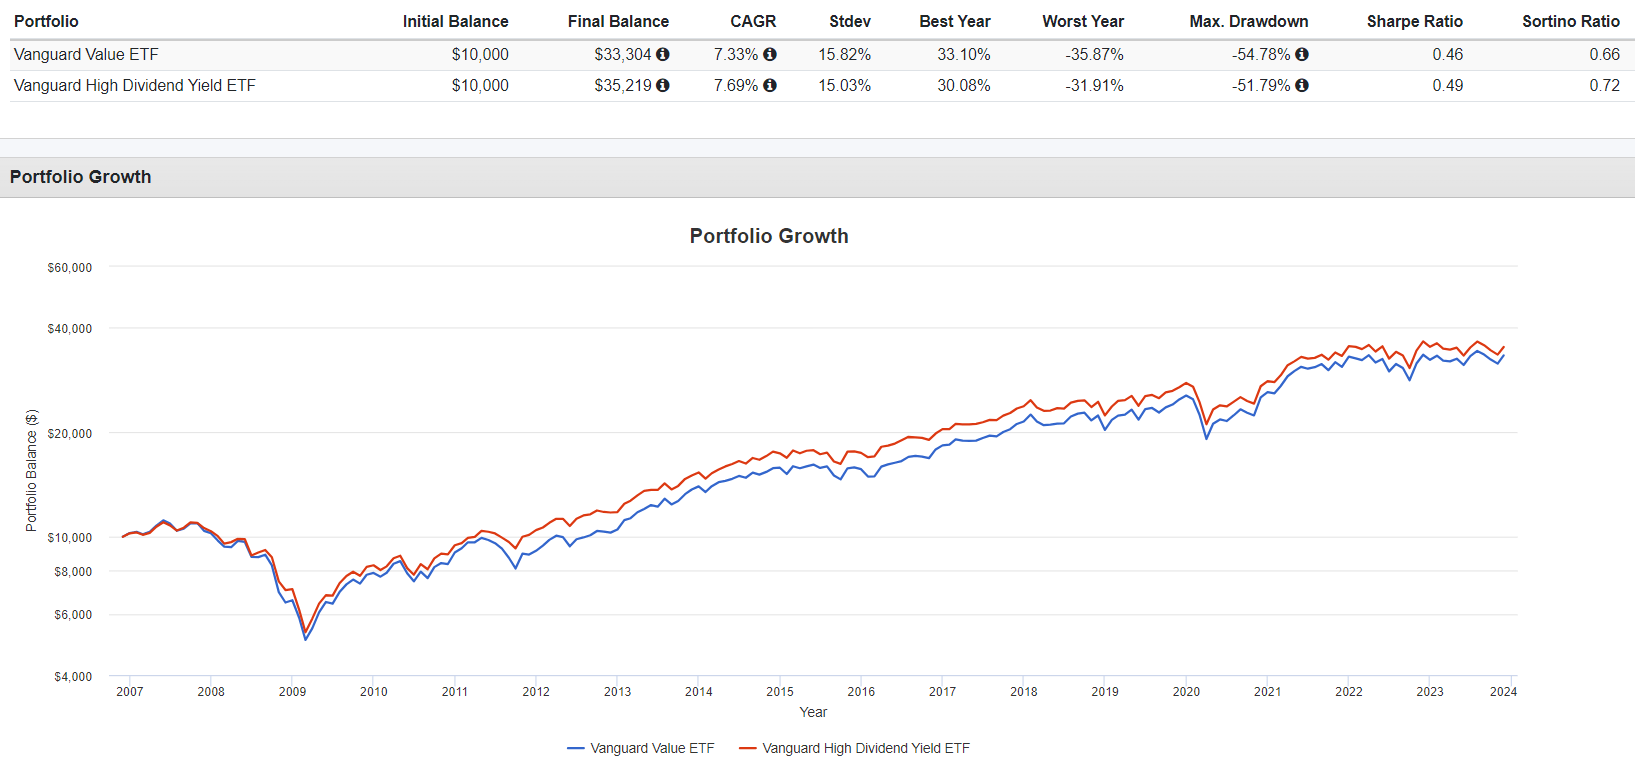
Since November 2006, VYM and VTV have followed a similar path, delivering 7.33% and 7.69% annualized returns with similar levels of volatility. The log scale helps us quickly identify that VYM broke away in 2011 with a 9.43% beat (10.54% vs. 1.11%), but it's been pretty even since then. In all other years, performance was within approximately 3%, including YTD, where VTV is up 2.98% compared to a -0.12% decline for VYM.
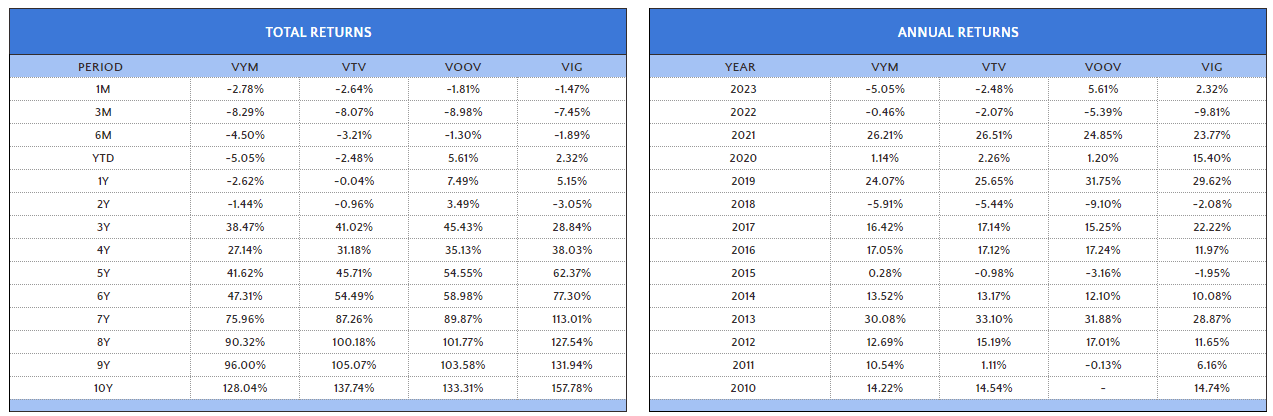
Over the last ten years through October 2023, VYM was the worst performer, lagging behind VTV, VOOV, and VIG by 9.70%, 5.27%, and 29.74%, respectively. VIG is more growth-focused, so it makes sense for it to have the best total returns. However, VYM outperformed VIG by 4.38% in 2011 and 9.35% in 2022, so high-dividend investors won't necessarily have to sacrifice total returns for yield. It depends on the environment.
Fundamental Analysis
VYM and VTV Key Differences
I've mentioned the similarities in holdings between VYM and VTV, but a few key differences might cause you to lean one way. VYM overweights five securities by more than 0.75%, as follows:
- Home Depot ( HD ): 2.28% vs. 0.00% = 2.28%
- McDonald's ( MCD ): 1.51% vs. 0.00% = 1.51%
- Texas Instruments ( TXN ): 1.02% vs. 0.00% = 1.02%
- Starbucks ( SBUX ): 0.82% vs. 0.00% = 0.82%
- Exxon Mobil ( XOM ): 3.36% vs. 2.61% = 0.75%
In contrast, VTV overweights four securities by more than 0.75%, as follows:
- Berkshire Hathaway ( BRK.B ): 3.83% vs. 0.00% = 3.83%
- UnitedHealth Group ( UNH ): 3.06% vs. 0.00% = 3.06%
- Oracle ( ORCL ): 1.03% vs. 0.00% = 1.03%
- Abbott Laboratories ( ABT ): 1.01% vs. 0.00% = 1.01%
The differences are few, but I am partial to Berkshire Hathaway. However, Health Care has struggled this year, and Seeking Alpha's Quant System has "D-" and "F" Valuation Grades assigned to UNH and ABT. VTV's adjusted value score using this system is just 3.73/10 compared to 4.08/10, and given how low these scores are, it might signify that value stocks just aren't good value right now.
VYM Fundamentals By Company
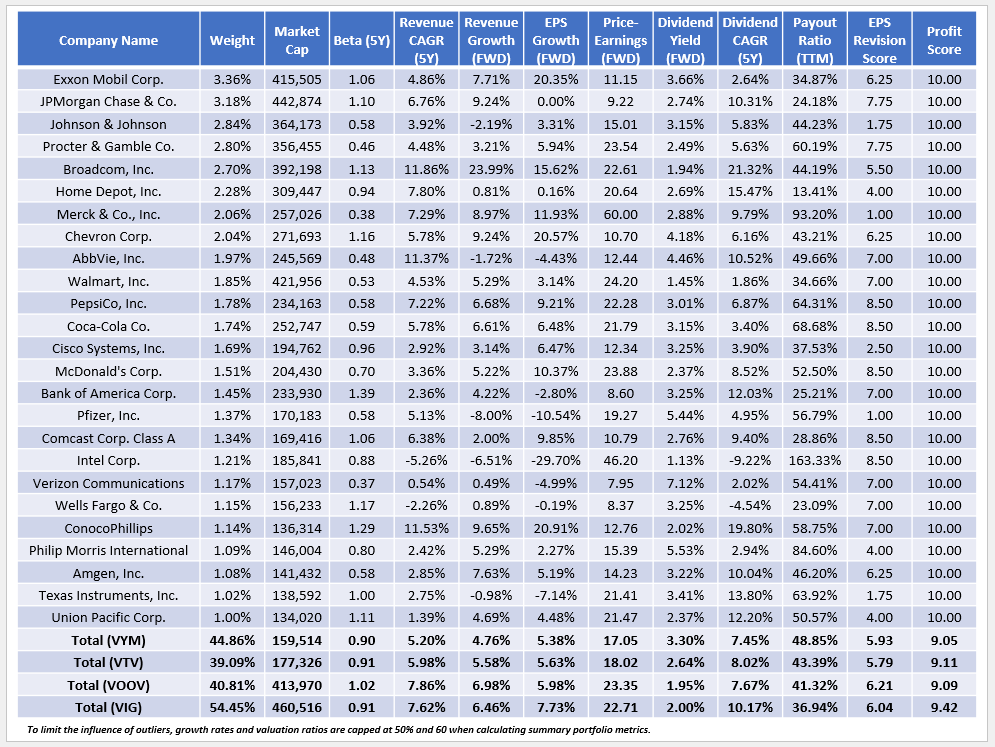
The following table takes a closer look at VYM's fundamentals by company, of which the top 25 total 44.86% of the portfolio. One of its strengths is excellent diversification, but as you can see, VTV's is even better at 39.09%. As stated earlier, these funds are sufficiently diversified, so either would make a solid core holding on the value side.
I want to make the following observations regarding dividend yield, VYM's primary advantage over VTV.
1. VYM's gross dividend yield is 3.30%, and after subtracting the fund's low 0.06% expense ratio, the net yield is 3.24%. It's better than the quoted 3.17% trailing dividend yield and relatively high for a pure U.S. equity ETF. If a higher income level is desired, I suggest alternative asset classes like REITs or allocating to fixed-income products. It's a mistake to go with the highest-yielding U.S. stocks, as they are usually of substantially lower quality, and the research I've done using data from the Ken French Data Library shows that total returns for the top decile of dividend-paying stocks are consistently the lowest decade after decade.
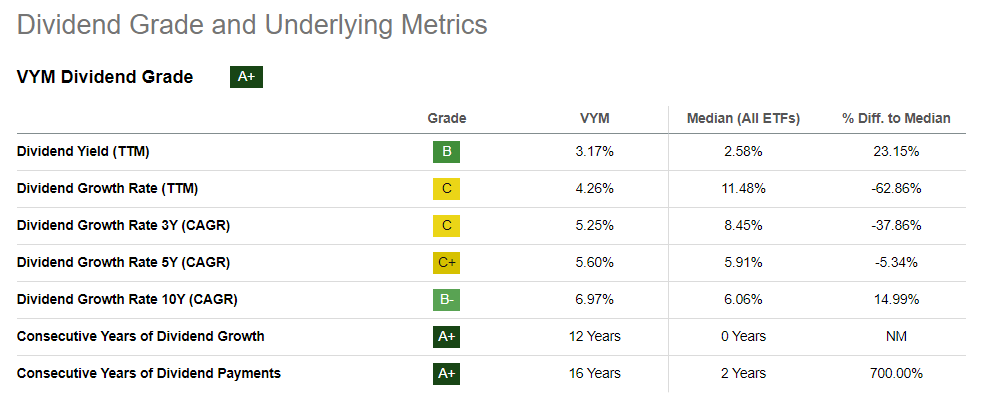
2. VYM's constituents have increased dividends by an annualized 7.45% over the last five years. It's slightly better than the 5.60% rate for the ETF, but I caution dividend growth investors not to expect much going forward. Estimated earnings growth rates are down across the board (5.38% for VYM), and although VYM's larger holdings have some flexibility, we're already seeing the impacts this year. As shown below, VYM's is 4.26%, and even dividend growth for the Schwab U.S. Dividend Equity ETF ( SCHD ) was underwhelming over the last twelve months at 5.70% vs. its 13.69% five-year growth rate.
3. The weighted average dividend payout ratio for VYM's constituents is 48.85%, the highest of the four but still at a comfortable level. For context, the four-year average payout ratio is 53.12%, but VYM also has the highest Dividend Safety Score at 7.55/10, based on Seeking Alpha Factor Grades. VTV, VOOV, and VIG, score 7.99/10, 7.88/10, and 8.39/10, respectively.
VTV Fundamentals By Company
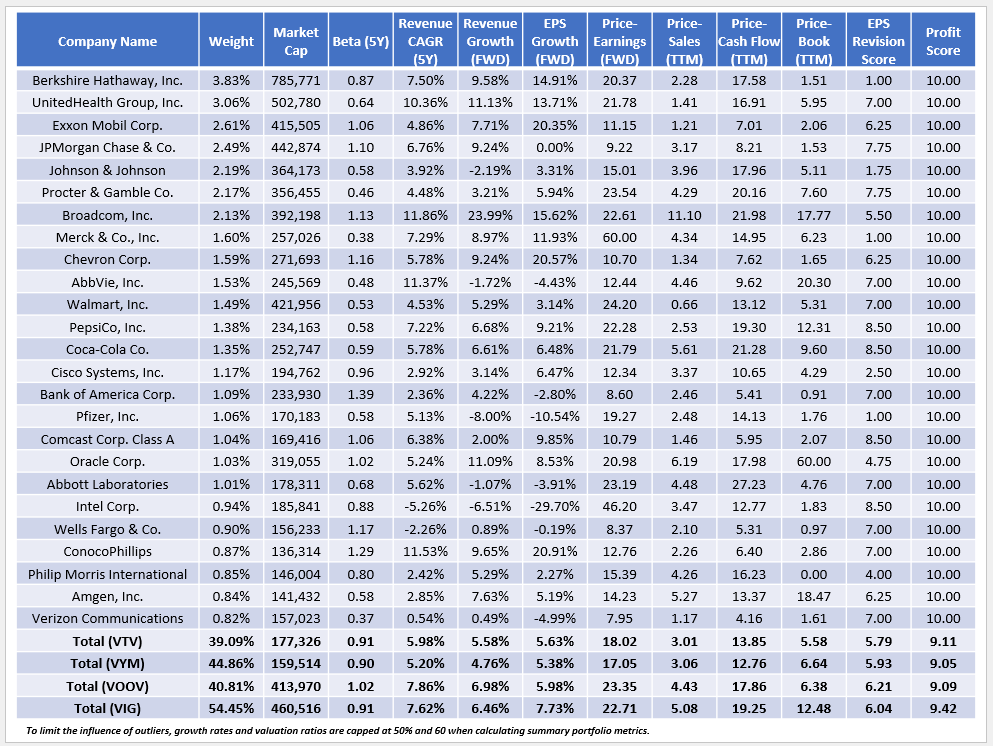
The following table highlights VTV's fundamentals by company and emphasizes its valuation metrics instead of the dividend ones just discussed. Notably, despite screening for forward P/E, its 18.02x valuation is one point more than VYM. The same is true for P/CF, which is not screened for, and VTV's most significant advantage is on P/B (5.58x vs. 6.64x), a metric I don't rely on because many modern companies have large amounts of intangible assets (e.g., intellectual property).
In this respect, I'm disappointed VTV's valuation ratios don't stand out more. Its 18.02x forward P/E is one point more expensive than last year, but its 5.63% estimated EPS growth rate is about half of what it was previously. To my earlier point, value ETFs don't seem like very good values now, despite VTV's substantial underperformance vs. the Vanguard Growth ETF ( VUG ) this year.
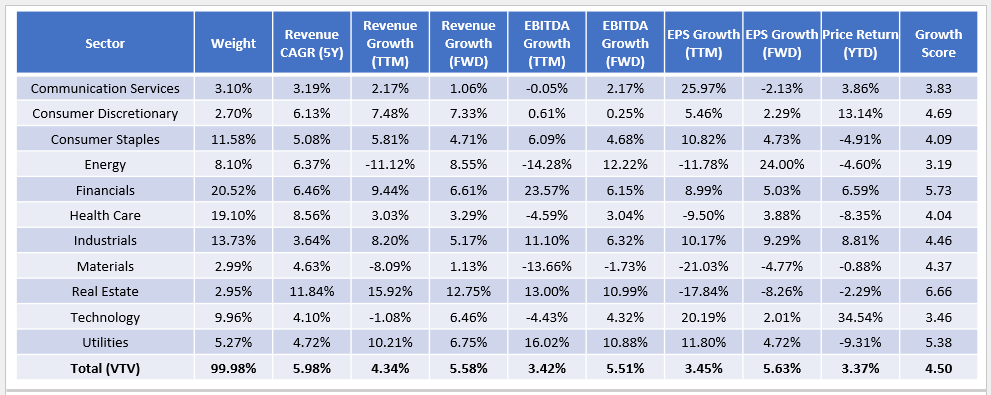
To understand what's happening with growth, consider the following sector breakdown for VTV, which includes revenue, EBITDA, and EPS growth metrics.
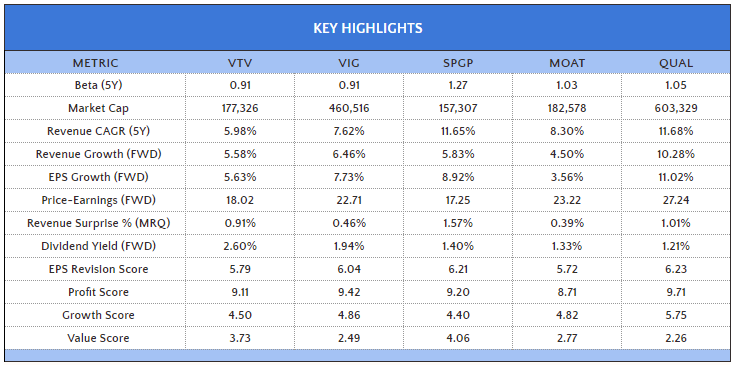
At first glance, it's nice that estimated revenue, EBITDA, and EPS growth rates are higher than what was realized over the last year. However, a closer look reveals most of the growth is coming from the highly volatile Energy sector, with growth rates of 8.55%, 12.22%, and 24.00%, respectively. VYM's metrics for the sector are similar, but to illustrate how unpredictable these estimates are, Wall Street analysts expected 28.52% sales growth for Exxon Mobil to begin the year, but over the last twelve months, the actual figures came in at -10.22%. Absent much growth potential elsewhere, I'm troubled by VTV and VYM's extreme value and growth imbalance. A solution is VIG, with its 7.73% estimated EPS growth rate and minimal 3.21% Energy sector exposure. One reader expressed interest in trimming VTV in favor of VIG, SPGP , MOAT , and QUAL . At least currently, MOAT fits the bill without sacrificing quality, as summarized in the table below.
As shown, these solutions require compromise:
1. SPGP, which follows a growth-at-a-reasonable-price strategy, naturally has the best combination of earnings per share growth (8.92%) and forward earnings valuation (17.25x). But it's also highly volatile, with a 1.27 five-year beta. The benefit is that it only has about 15% overlap with VTV and VYM, so allocating a portion to this fund makes sense for diversification purposes.
2. MOAT, to my surprise, has a terrible combination of estimated earnings per share (3.56%) and valuation (23.22x forward earnings). Typically, the ETF succeeds because of its superior sector allocations rather than security selections. The current iteration overweights Financials (20.12%), Health Care (18.92%), Technology (15.80%), and Industrials (15.68%), but except for Technology, its selections are virtually flat on the year. Examples include U.S. Bancorp ( USB ), Agilent Technologies ( A ), Wells Fargo ( WFC ), Charles Schwab ( SCHW ), and Gilead Sciences ( GILD ).
3. QUAL offers the best estimated earnings per share growth rate at 11.02% but trades at 27.24x forward earnings. It has a 22% overlap and does not sacrifice quality like MOAT. However, it could conflict with other market-cap-weighted funds, as it has a 24.54% allocation to five Magnificent Seven stocks and a 40% overlap with the SPDR S&P 500 ETF ( SPY ).
Investment Recommendation
VYM and VTV are very similar in composition, so if a high dividend is important to you, I would go with VYM. It's cheaper than VTV, and given how similarly they've performed over the last decade, it's a toss-up from a total returns perspective. However, my analysis revealed how both ETFs are weak on growth, and although growth is not a goal with value funds, it still matters because it drives dividend growth and overall profitability. In short, I don't recommend being a strict value investor, as the impact of value ETFs falling out of favor could be substantial. Possible complements include VIG, SPGP, QUAL, and the Vanguard Growth ETF, which I suggested five months ago. Please let me know if any of these interest you in the comments section below, and I hope you found this information helpful.
For further details see:
VYM Vs. VTV: $200B In AUM, But Vanguard's Dividend And Value ETFs Have Major Growth Problems