WTI - W&T Offshore: This One Missed The Rally
2023-09-12 12:01:42 ET
Summary
- W&T Offshore reported a loss of $12.11 million in Q2 2023, compared to an income of $123.44 million in the previous year.
- Total revenues dropped 31% to $126.18 million in Q2 2023.
- I recommend buying WTI between $3.95 and $3.80 with possible lower support at $3.65.
Introduction
Houston-based W&T Offshore, Inc. (WTI) released its second quarter 2023 earnings report on August 1, 2023.
Note: I have been covering W&T Offshore regularly quarterly since May 2016. This article is an update of my preceding article , published on May 12, 2023.
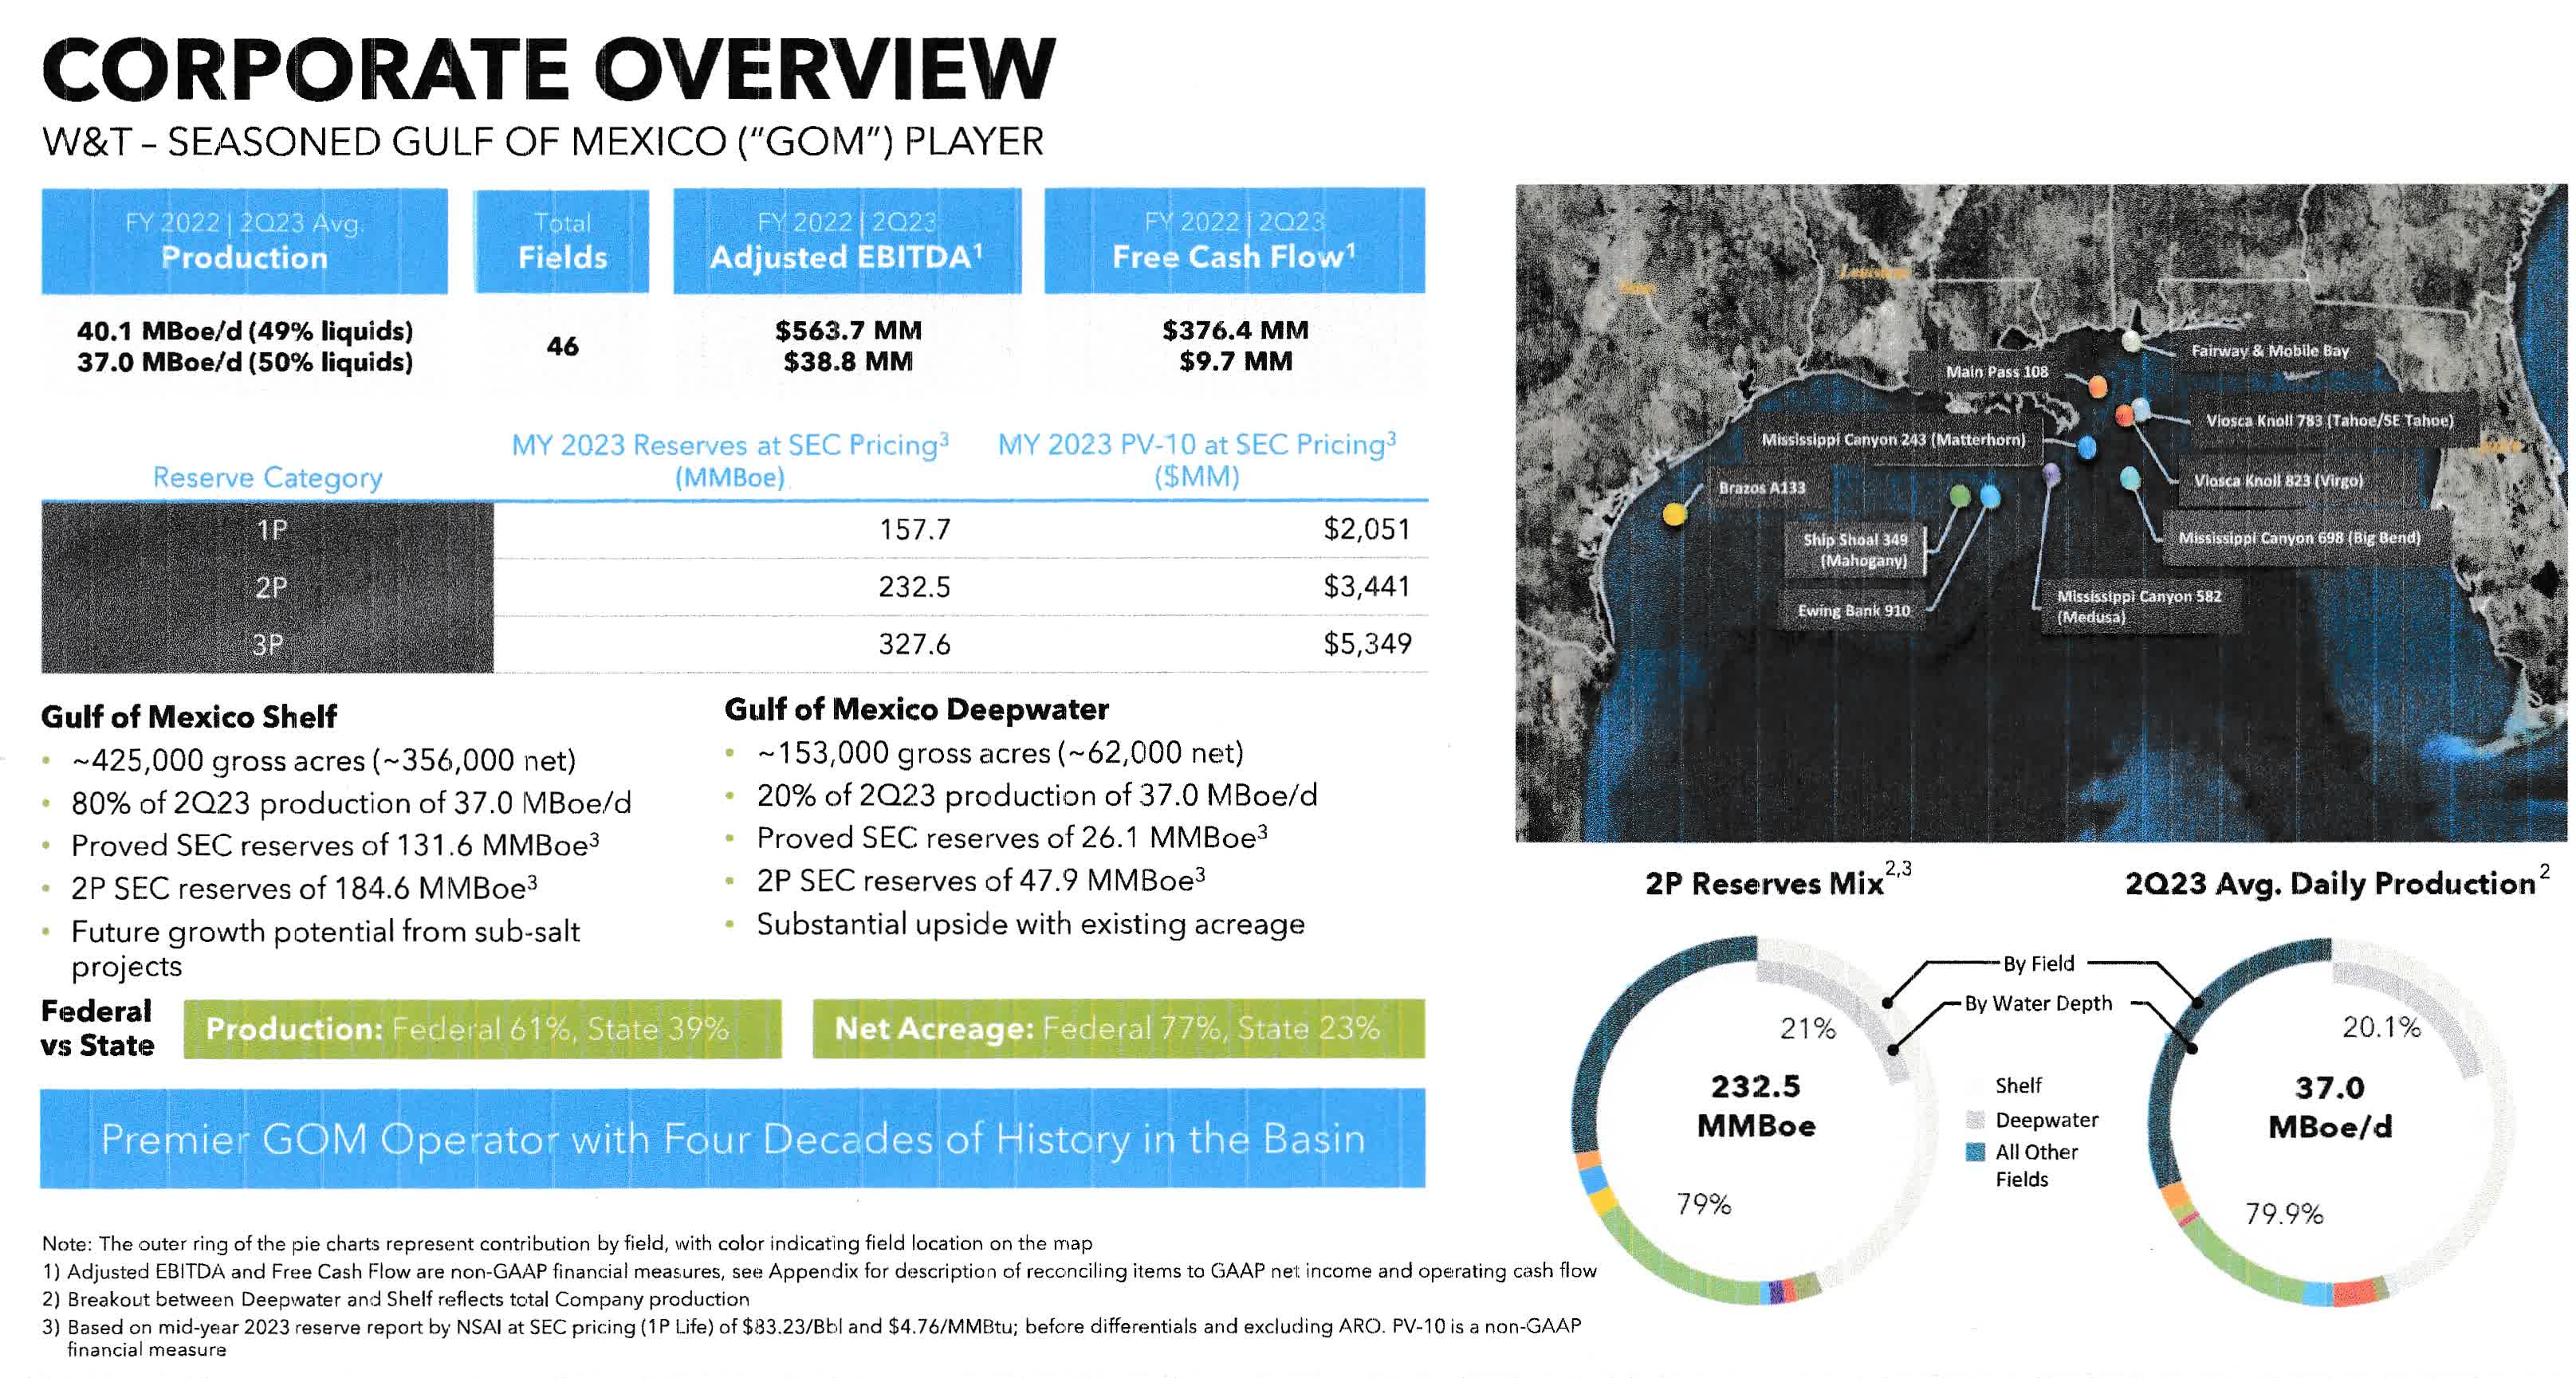
The company specializes in oil & gas offshore production in the Gulf of Mexico, with production in the Gulf of Mexico Shelf (381K acres net) and the Gulf of Mexico Deepwater (72K acres net).
WTI Overview (WTI Presentation)
1 - 2Q23 result snapshot
The Company came out with a loss of $12.11 million or $0.08 per diluted share. It compares with an income of $123.44 million or $0.85 per share a year ago. The adjusted earnings were a loss of $0.08 per share or $12.38 million. Results missed analysts' expectations.
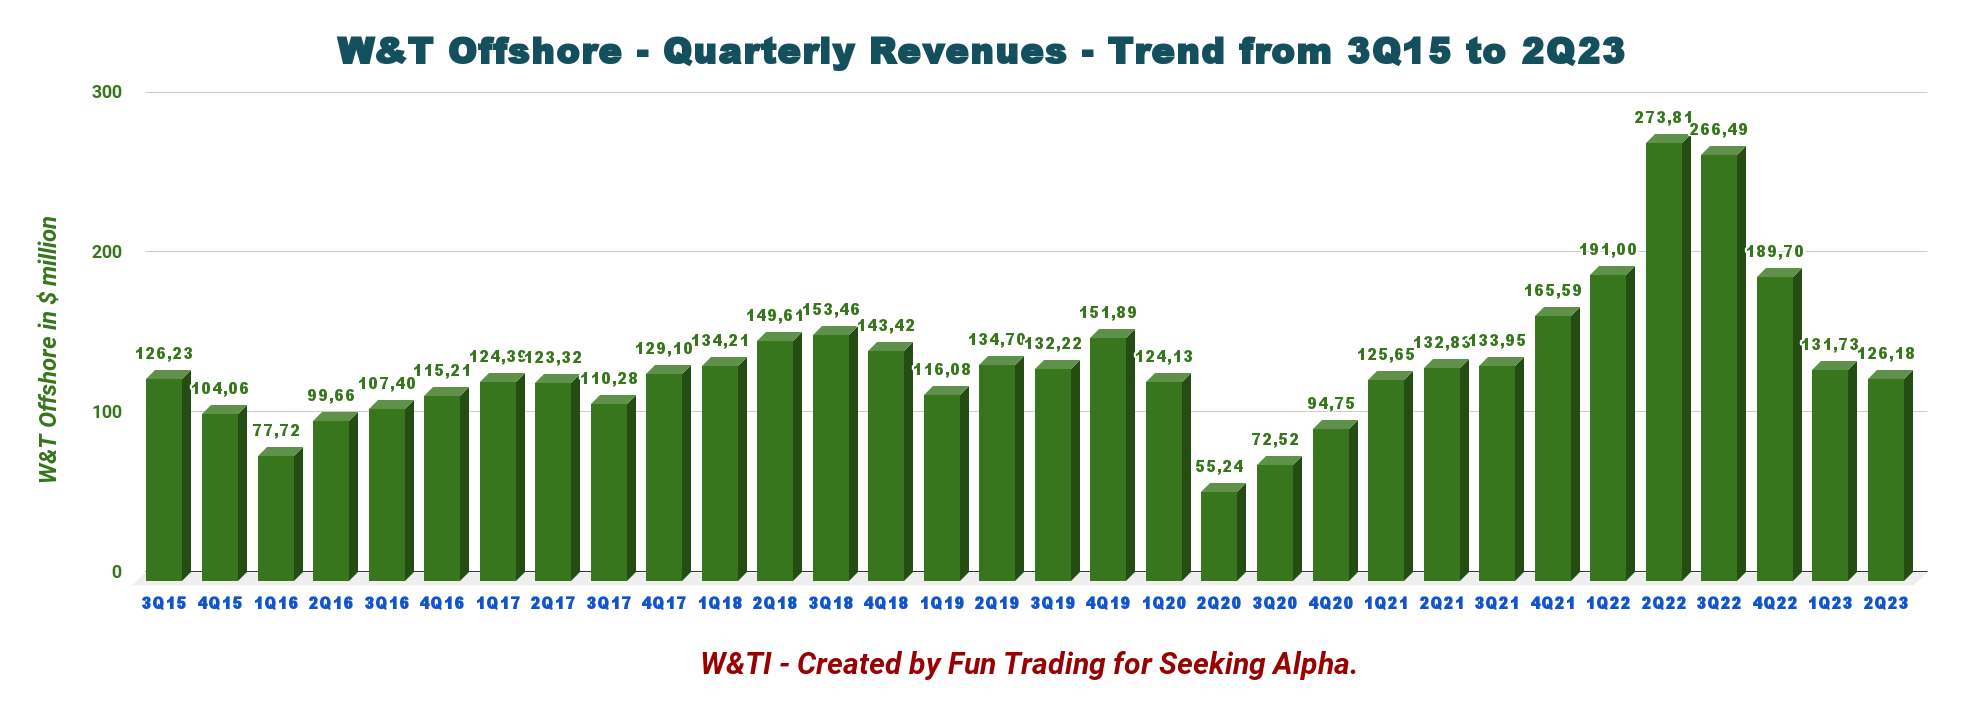
Total revenues were $126.18 million , down 31% from $273.81 million earned a year ago.
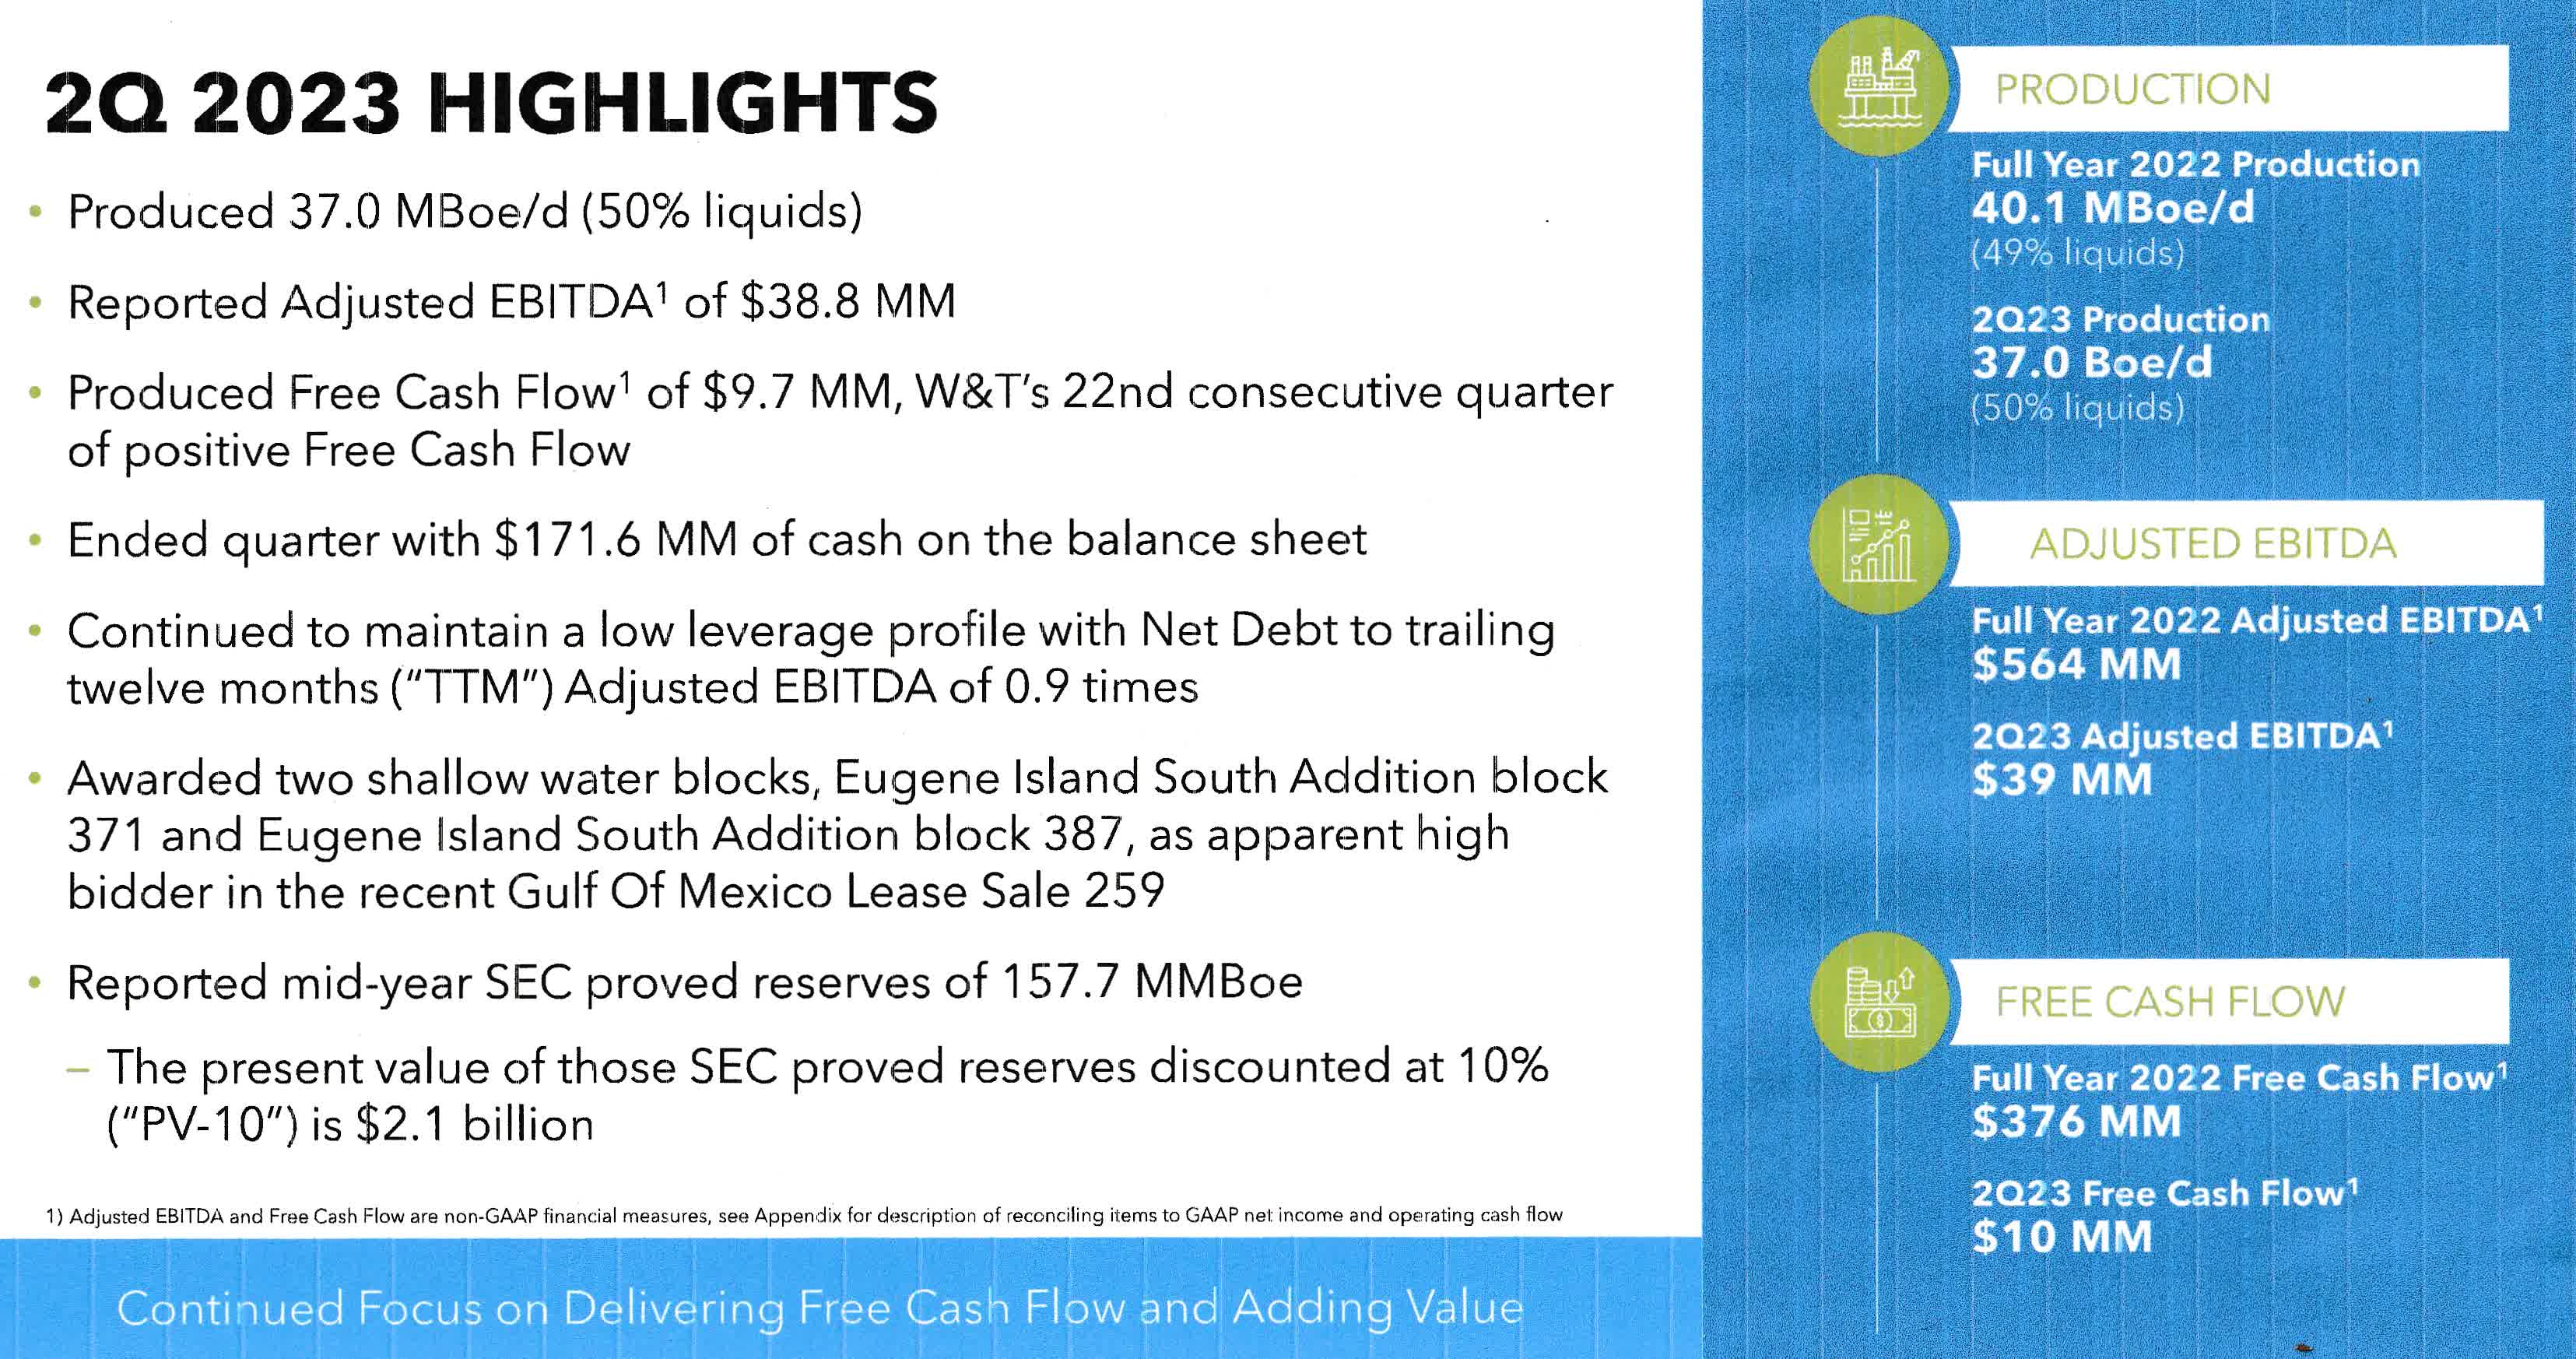
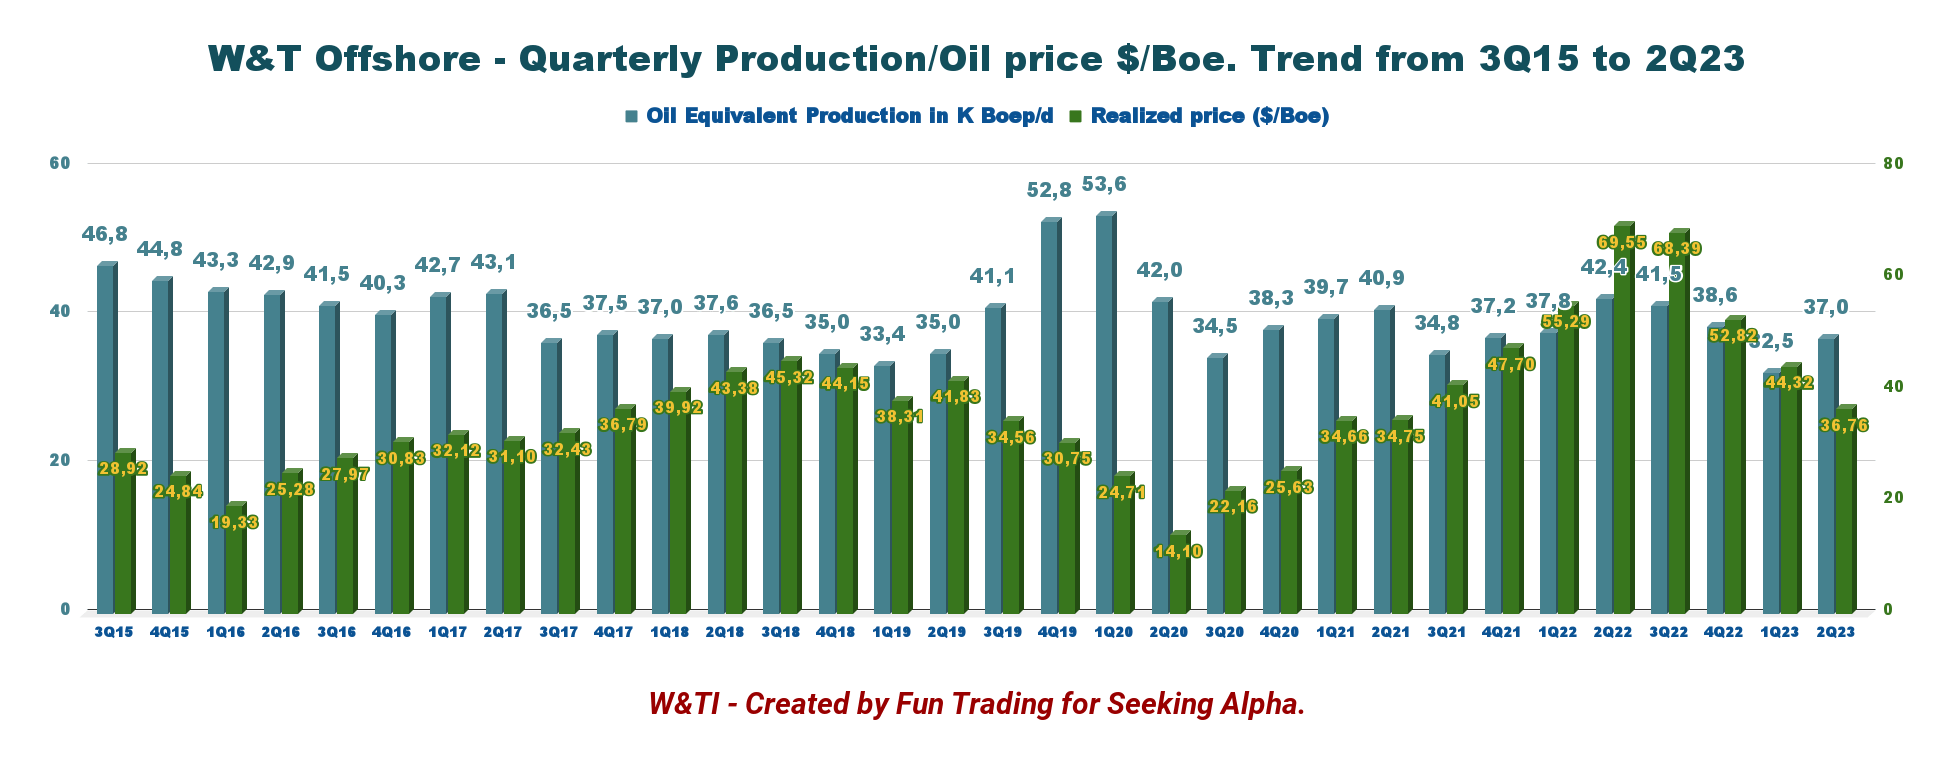
Oil equivalent production was 37.0K Boepd in 2Q23, with 50.4% liquids. The average price per $/boe was $36.76 per Boe, well below the $69.55 made last year. Mid-year SEC proved reserves were 157 MMBoe.
Lower oil equivalent production, rising expenses, and lower commodity price realizations were the reasons for weak quarterly results.
Tracy W. Krohn, Chairman and Chief Executive Officer, said in the conference call:
We clearly adhered to our strategy and delivered sustainable and consistent results. We believe that continued success is driven by the ability of both our operations and finance teams to execute at a high level and our outstanding base in the Gulf of Mexico helps with that effort. Helped with our ability to pay down debt and improve our balance sheet, we're fairly in a much stronger financial position today, and we remain focused on operational execution in 2023 and beyond to continue building on those outstanding results.
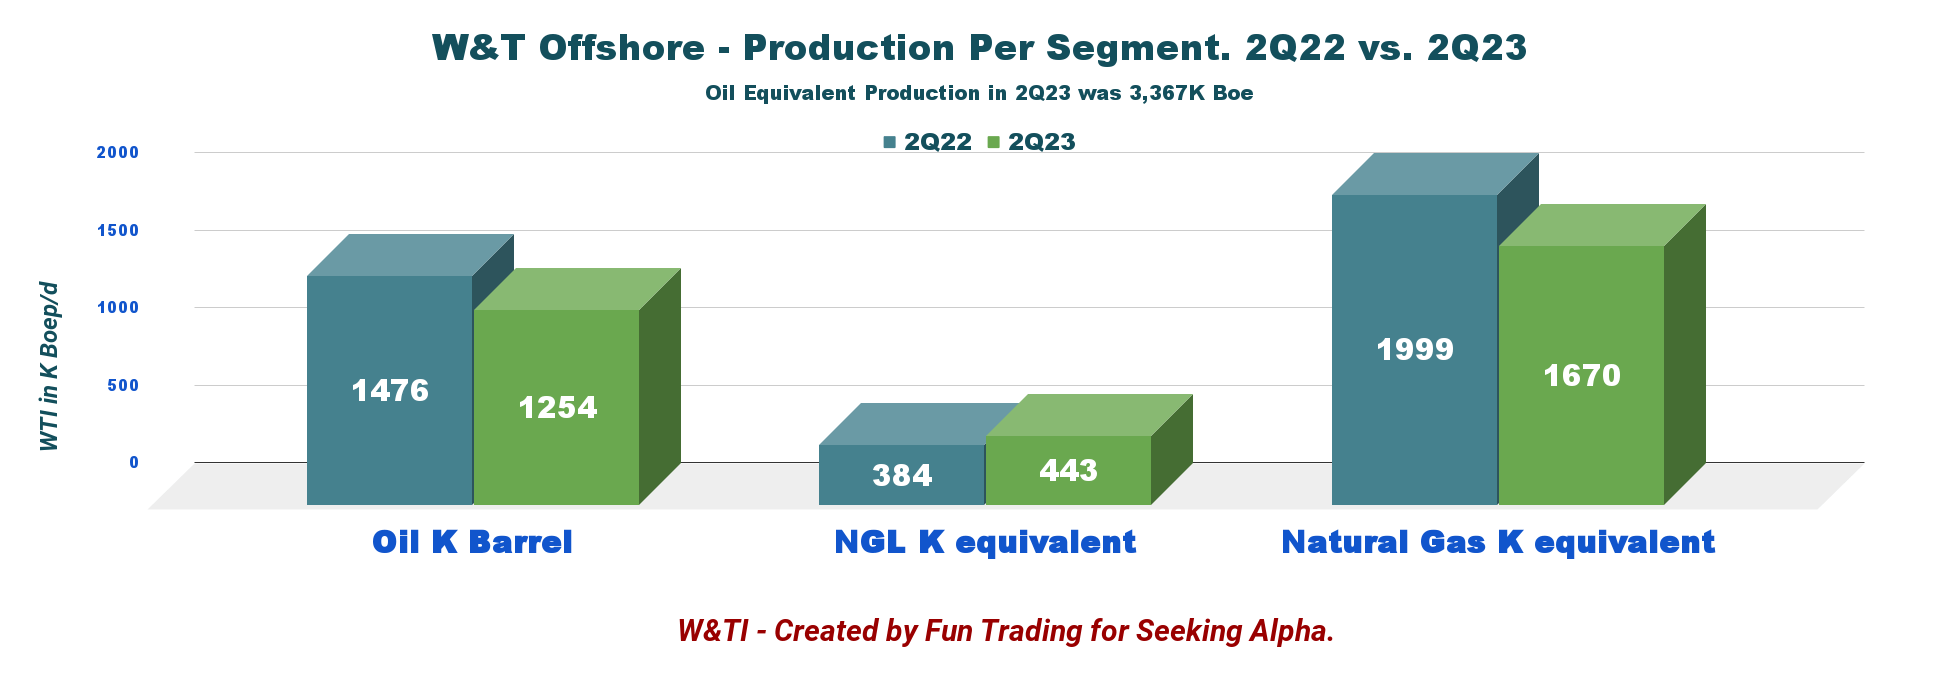
WTI Quarterly Production per Segment 2Q22 versus 2Q23 (Fun Trading)
W&T Offshore's fundamentals have changed for the better starting in 2022, especially with the increase in oil prices beginning in July 2023 after Saudi Arabia cut its oil supply by 1.2 million barrels.
In July, oil supply from the OPEC+ alliance fell by 1.2 mb/d to a near two-year low as a voluntary reduction from Saudi Arabia came into effect.
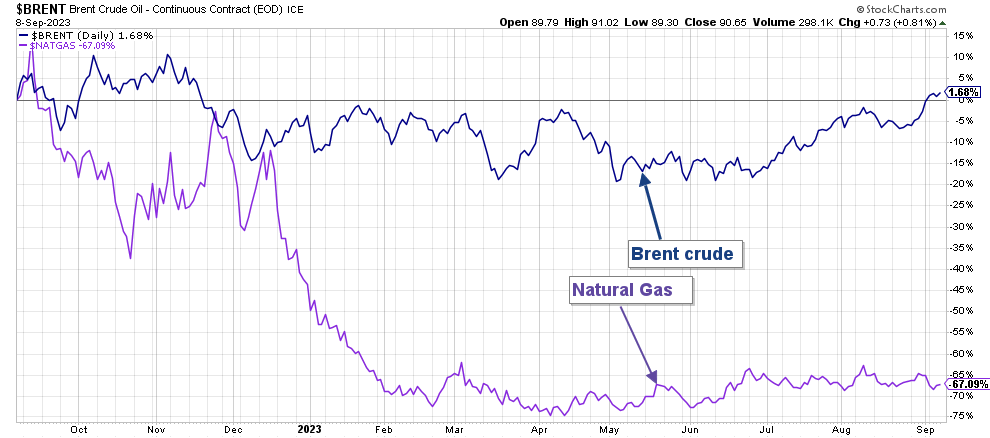
However, contrary to many large E&P and oil majors, WTI has not reacted positively to the recent rally in oil prices because WTI production is 49.5% Natural Gas, with NG prices down nearly 68% YoY. Another issue with WTI is that it produces from offshore Gulf of Mexico and may suffer from the hurricane season.
As we can see in the chart below, oil prices are now up nearly 2% on a one-year basis, whereas natural gas has reached solid support.
WTI 1-Year Chart Brent versus NG Prices (Fun Trading StockCharts)
Hence, the best trading/investing strategy is to trade short-term LIFO the volatility and keep a medium core long-term position for an eventual higher payday. WTI spiked over $8 a year ago and could eventually retest this price. All we need is patience.
This simple dual strategy is the most rewarding and safest way in the long term. Choosing a strategy adapted to the company will make you a winner.
2 - Stock performance
WTI has underperformed Chevron Corporation (CVX) and Exxon Mobil (XOM) and is now down 36% on a one-year basis. A massive slide from the high in October/November 2022. However, as shown below, the stock is now trading at a strong support.
W&T Offshore, Inc. - Historical Financial and Production Ending 2Q23 - The Raw Numbers
| W&T Offshore, Inc. |
| 2Q22 |
| 3Q22 |
| 4Q22 |
| 1Q23 |
| 2Q23 |
| Total Revenues in $ Million |
| 273.81 |
| 266.49 |
| 189.70 |
| 131.73 |
| 126.18 |
| Net Income in $ Million |
| 123.44 |
| 66.72 |
| 43.45 |
| 26.01 |
| -12.11 |
| EBITDA $ Million |
| 207.07 |
| 134.08 |
| 99.08 |
| 79.49 |
| 37.11 |
| EPS diluted in $/share |
| 0.85 |
| 0.46 |
| 0.30 |
| 0.17 |
| -0.08 |
| Cash from operations in $ Million |
| 210.22 |
| 89.09 |
| 12.68 |
| 23.44 |
| 26.20 |
| Capital Expenditure in $ Million |
| 25.52 |
| 8.33 |
| 11.75 |
| 7.52 |
| 24.68 |
| Free Cash Flow in $ Million |
| 184.70 |
| 80.77 |
| 0.93 |
| 15.91 |
| 1.52 |
| Total Cash in $ Million |
| 377.72 |
| 447.13 |
| 461.36 |
| 177.39 |
| 171.63 |
| Total LT Debt in $ Million |
| 709.17 |
| 701.42 |
| 693.44 |
| 403.27 |
| 403.57 |
| Shares outstanding (diluted) in Million |
| 144.53 |
| 145.88 |
| 146.27 |
| 148.73 |
| 146.45 |
| Oil Production |
| 2Q22 |
| 3Q22 |
| 4Q22 |
| 1Q23 |
| 2Q23 |
| Oil Equivalent Production in K Boepd |
| 42.4 |
| 41.5 |
| 38.6 |
| 32.5 |
| 37.0 |
| Realized price ($/Boe) |
| 69.55 |
| 68.39 |
| 52.82 |
| 44.32 |
| 36.76 |
Source: Company news
Analysis: Revenues, Earnings Details, Net Debt, Free Cash Flow, and Oil-Equivalent Production
1 - Total Revenues of $126.18 million in 2Q23
WTI Quarterly Revenues History (Fun Trading)
Revenues dropped again this quarter to $126.18 million from $273.81 million a year ago, a drop of 53.9% .
The adjusted EBITDA was $38.832 million . The Adjusted Net loss totaled $12.38 million , or $0.08 per diluted share, in the second quarter of 2023.
The realization of commodity prices dropped $36.76 per Boe . The low revenue was due to lower realized prices and lower production volumes.
The average operating expenses in 2Q23 were $126.11 million , from $111.484 million realized in 2Q22.
At the same time, oil-equivalent production was down to 37.0K Boepd (50.4% liquids) or 1.697 million barrels of oil equivalent ("MMBoe"). The Company reported a net loss of $12.11 million or $0.08 per diluted share.
Oil production increased by 13.8% sequentially. Production was at the midpoint of Guidance and recovered from planned and unplanned downtime in the first quarter of 2023.
Finally, WTI was awarded two shallow water blocks , Eugene Island South Addition Block 371 and Eugene Island South Addition Block 387, in the recent Gulf of Mexico Lease Sale 259 in March 2023. These two blocks cover a total of approximately 10,000 gross acres.
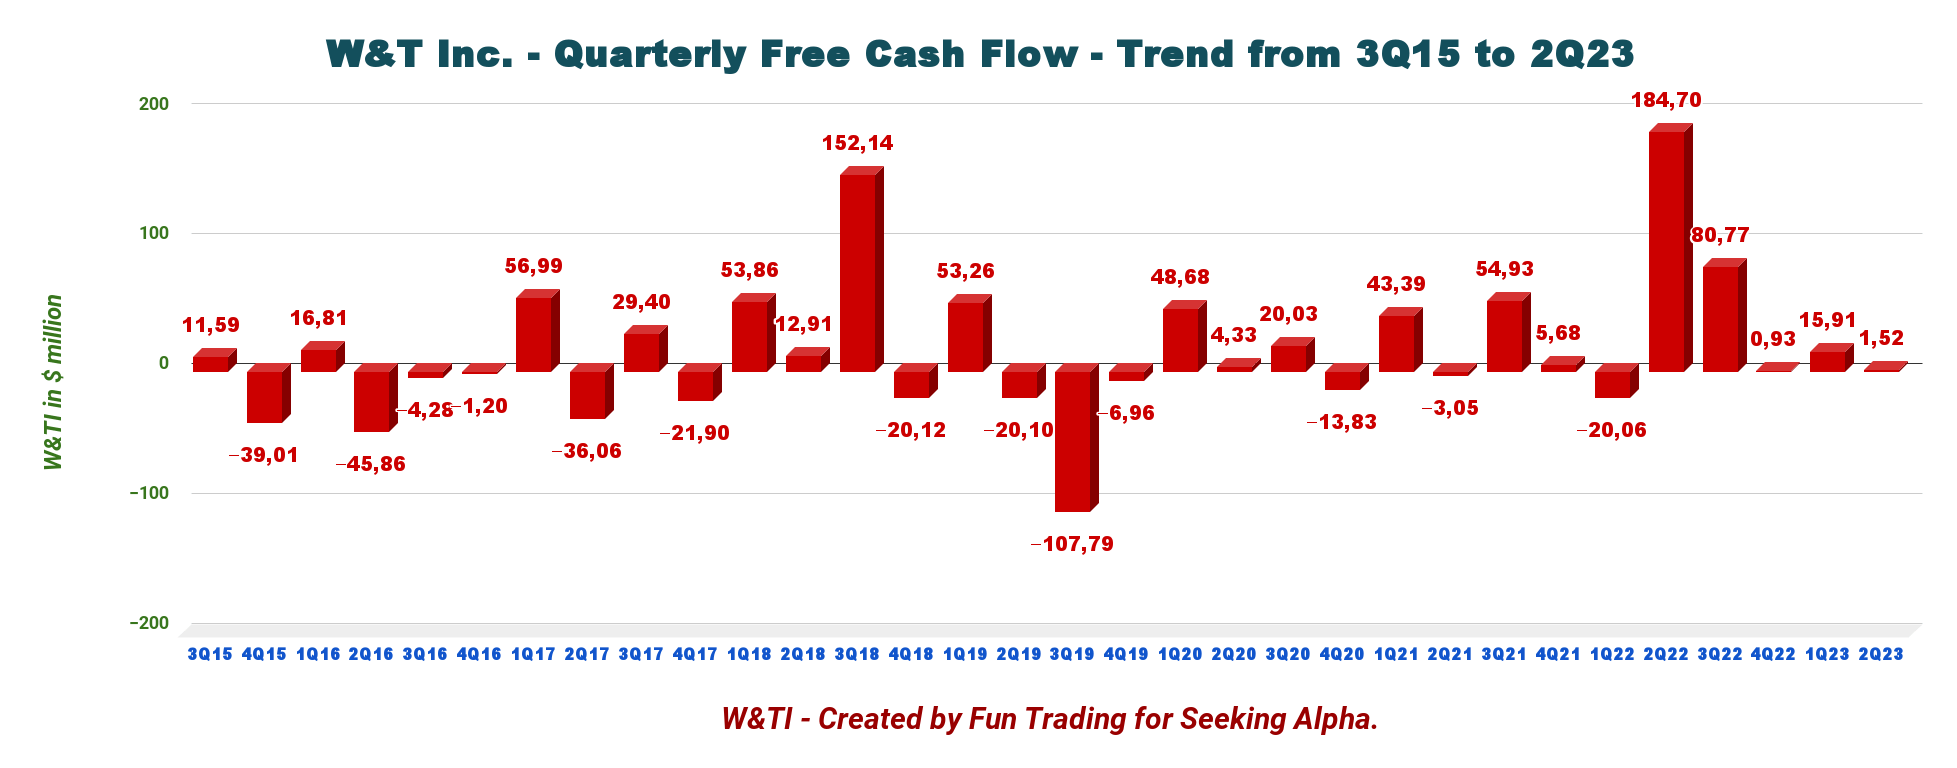
2 - The free cash flow was $1.52 million in 2Q23
WTI Quarterly Free Cash Flow History (Fun Trading)
W&T Offshore's trailing 12-month free cash flow was $99.13 million , with $1.52 million for 2Q23.
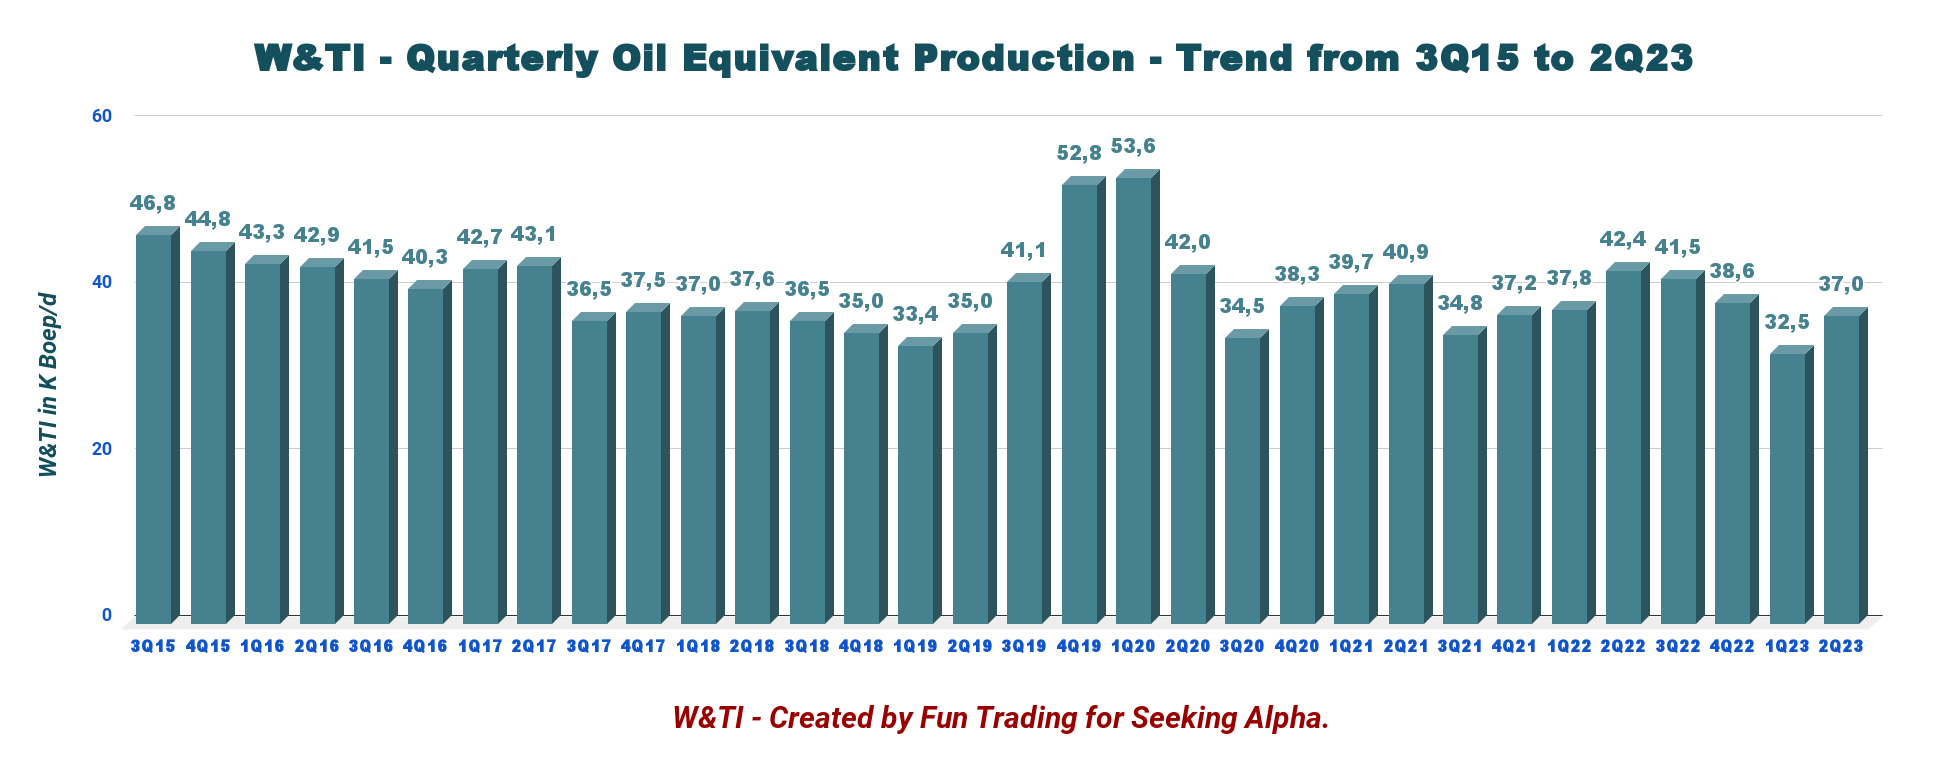
3 - Oil equivalent production and other considerations
3.1 - Oil equivalent production
WTI Quarterly Oil Equivalent Production History (Fun Trading)
Second quarter 2023 production was comprised of 13.8K Bopd of oil (37.3%), 4.9K boepd of natural gas liquids (13.2%) ("NGLs"), and 18.3 Boepd of natural gas (49.5%).
Production for the second quarter of 2023 was 37.0k Boepd . It represented a decrease of 12.7% compared to 2Q22 and was up 13.8% from 1Q23.
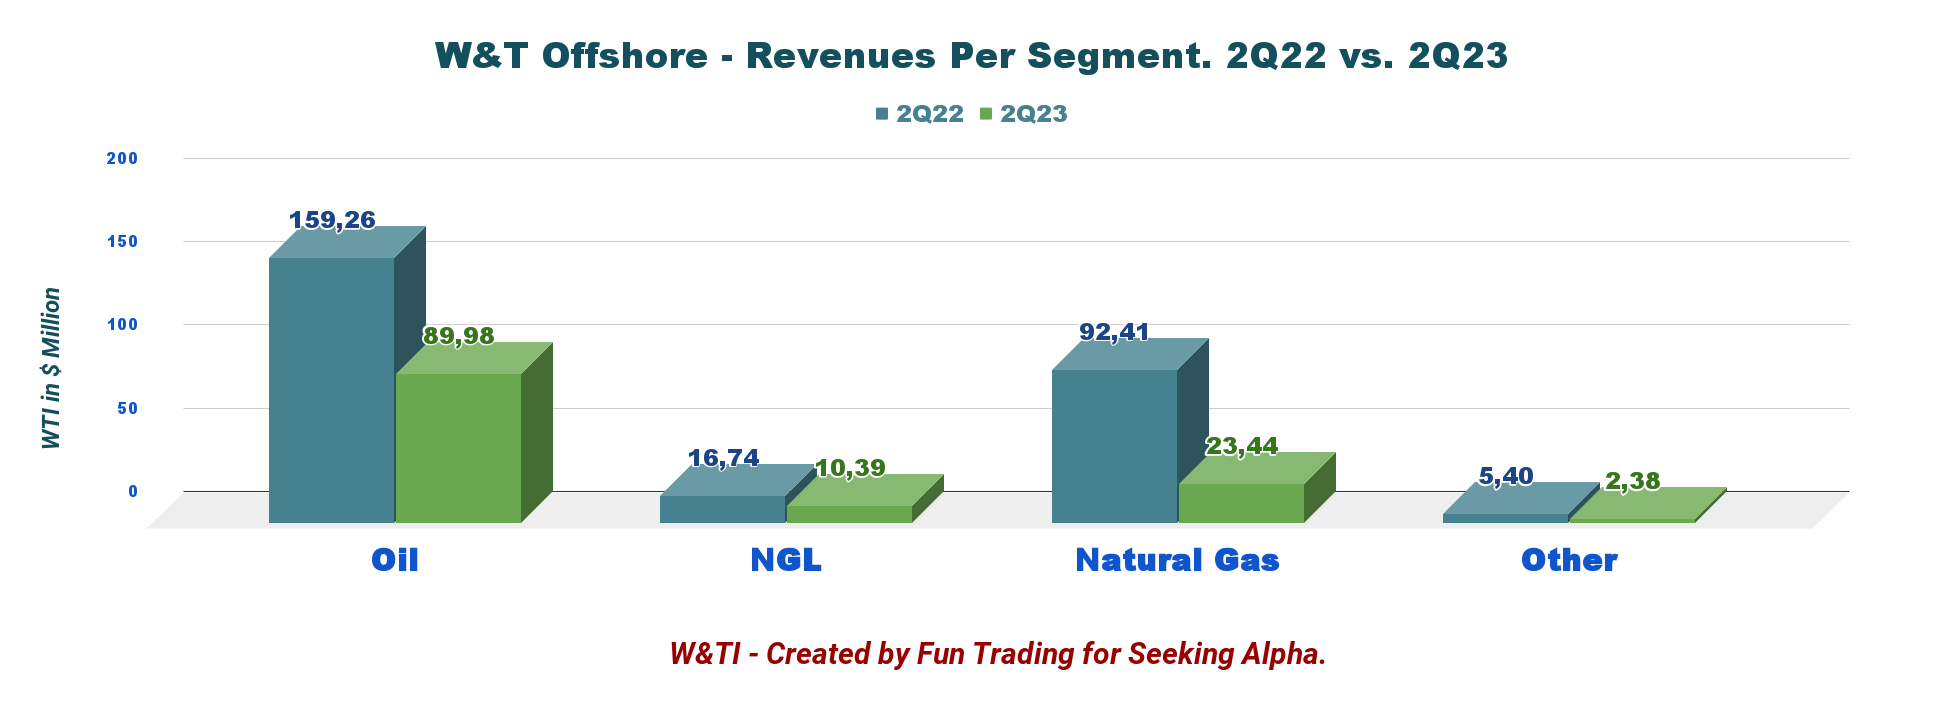
3.2 - Details revenues YoY:
WTI Quarterly Revenue per Segment 2Q22 versus 2Q23 (Fun Trading)
W&T's average realized price per barrel of oil equivalent ("Boe") before realized derivative settlements was $44.32 per Boe in the first quarter of 2023, a decrease of 47.1% from $69.55 per Boe in the second quarter of 2022.
On a production basis, LOE (lease operating expenses) costs were $19.60 per Boe in 2Q23. This is compared to $13.73 in the second quarter of 2022.
Before realized derivative settlements, crude oil, NGL, and natural gas prices for the second quarter of 2023 were $71.76 per oil barrel, $23.44 per NGL barrel, and $2.34 per Mcf.
Liquids (oil and NGL) represented 50.4% of the total production in the quarter.
WTI Quarterly Oil and NG Prices History (Fun Trading)
4 - Net debt was $231.94 million in 2 Q23
WTI Quarterly Cash versus Debt History (Fun Trading)
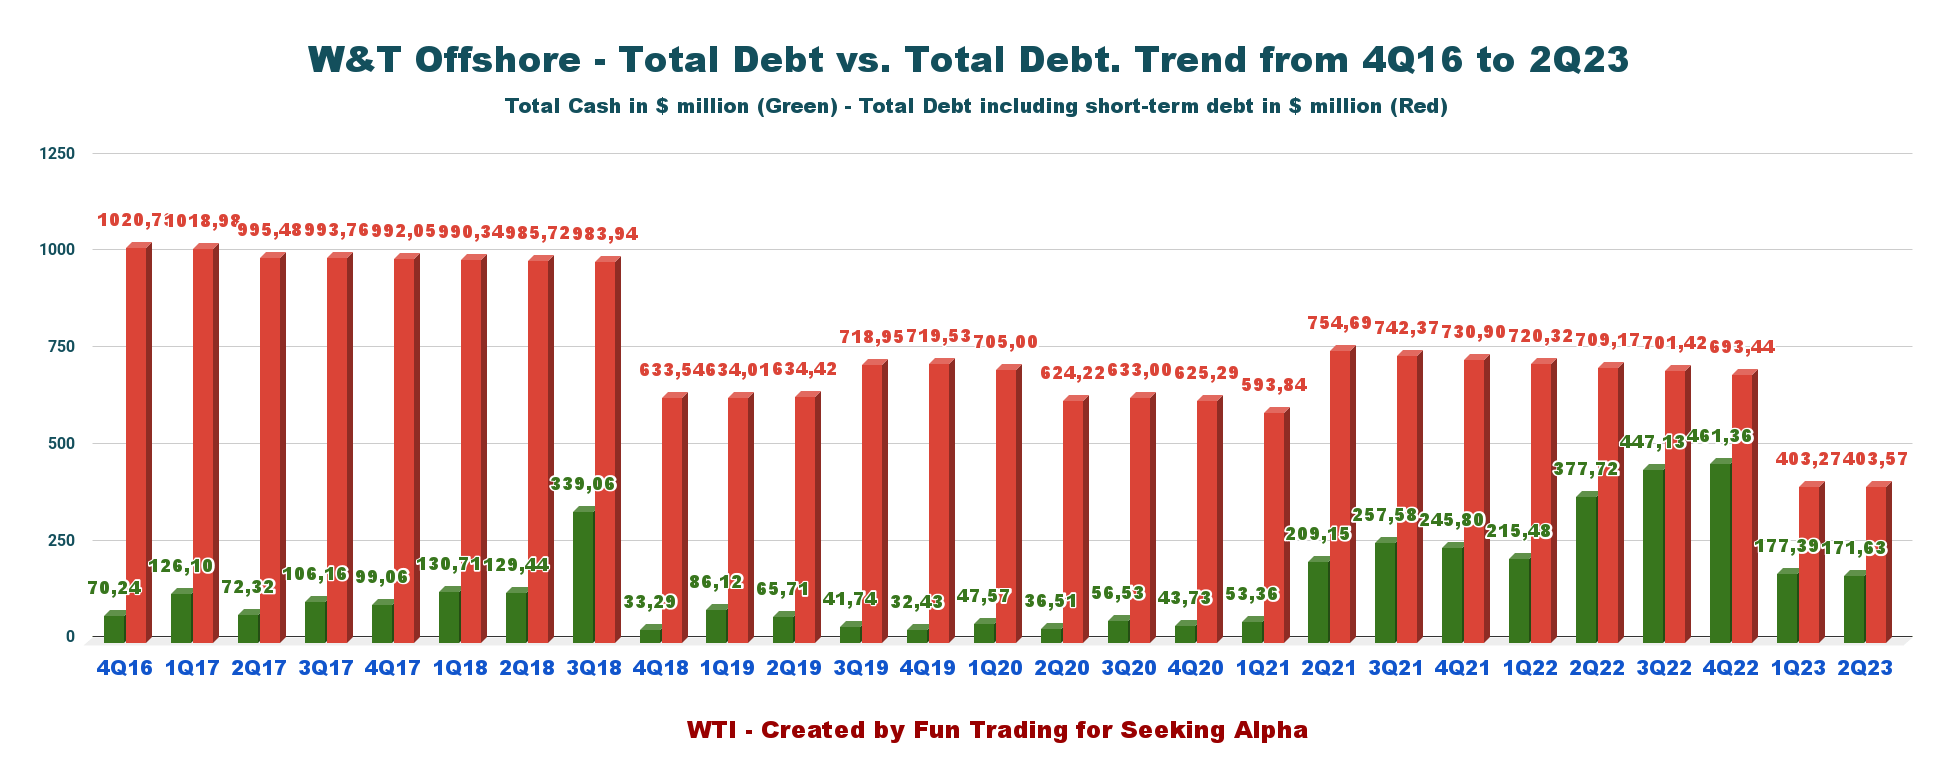
W&T had available liquidity of $221.6 million , comprised of $171.63 million in cash, cash equivalents, and securities, and $50.0 million of borrowing availability under W&T's first priority secured revolving facility provided by Calculus Lending LLC ("Calculus").
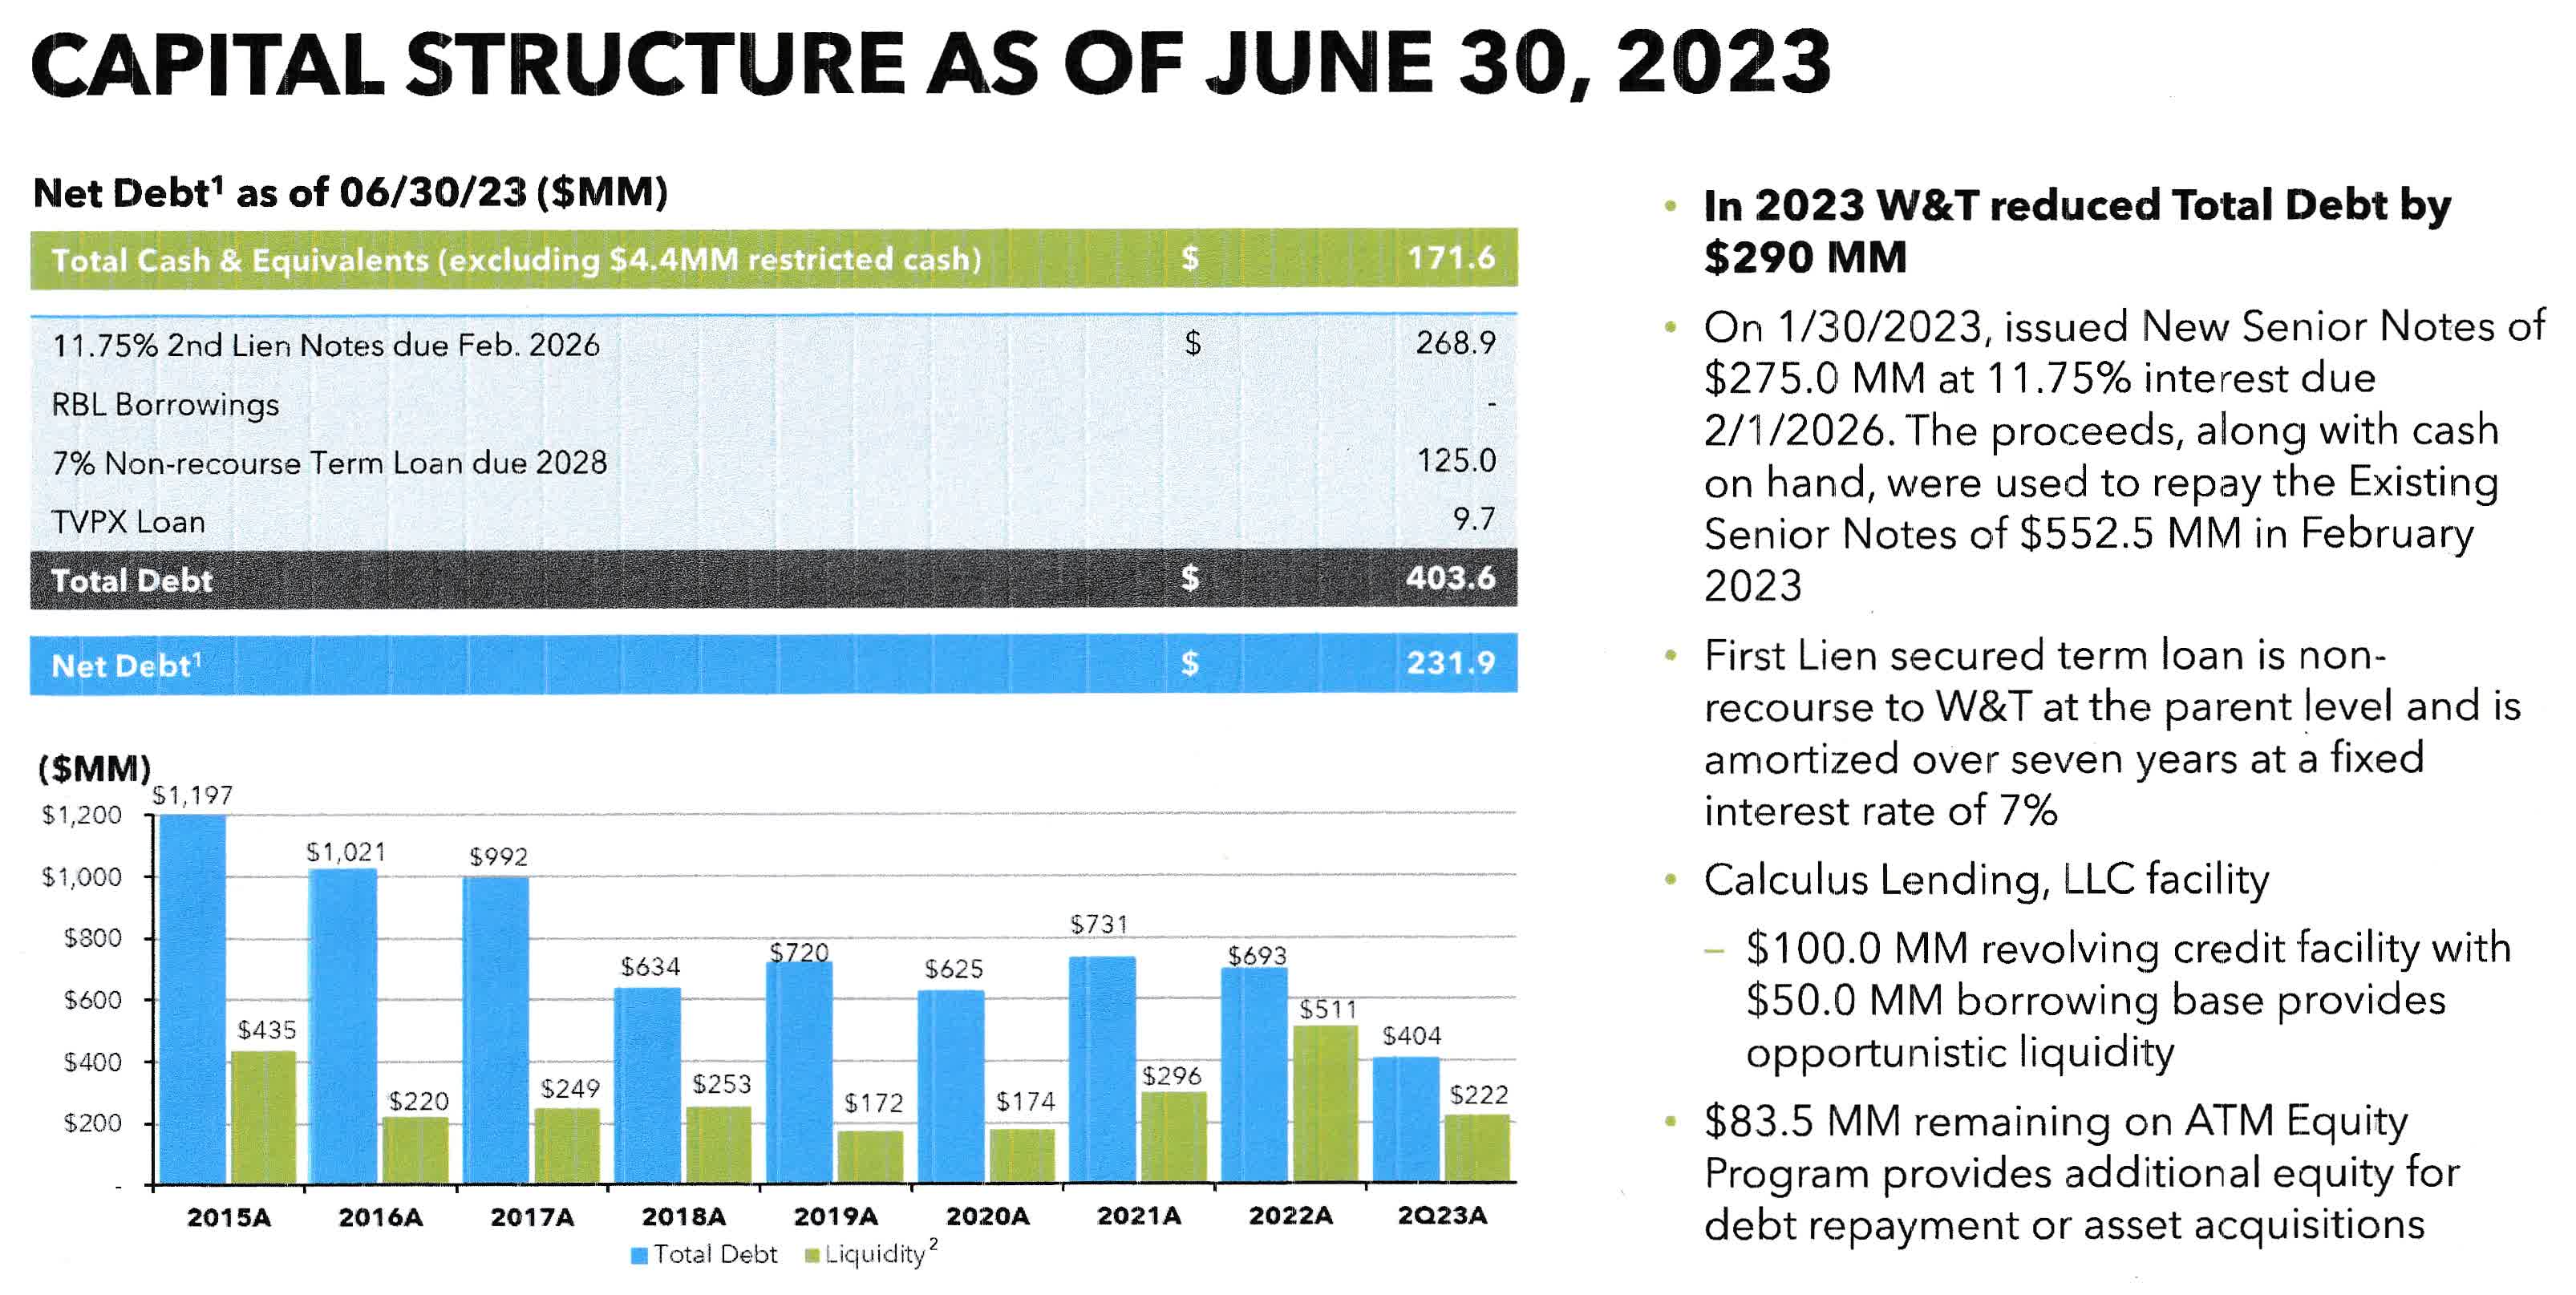
As of June 30, 2023, W&T Offshore had a total debt of $403.57 million or a net debt of $231.94 million .
On January 30, 2023, the company closed an offering of $275 million in aggregate principal amount of 2026 Senior Second Lien Notes at par in a private offering exempt from registration under the Securities Act of 1933, as amended.
WTI Balance Sheet (WTI Presentation)
5 - 3Q23 guidance
For the third quarter of this year, W&T Offshore projects production in the band of 3,100 to 3,453 MBoe. For 2023, WTI expects an output of 12,150 to 13,430 MBoe. Lease operating expenses for the third quarter are anticipated to be between $60-$67 million and $240-$260 million for the full year 2023.
Production for the third quarter of 2023 is expected to be between 3,100 MBoe and 3,453 MBoe, with a range of 12,150 MBoe and 13,430 MBoe for the full year 2023.
Technical Analysis & Commentary
WTI TA Chart Short Term (Fun Trading StockCharts)
WTI forms an Ascending Channel pattern, with resistance at $4.40 and support at $3.90. RSI is now 47 and descending, which suggests that WTI will retest support this week.
Ascending channel patterns or rising channels are short-term bullish in that a stock moves higher within an ascending channel, but these patterns often form within longer-term downtrends as continuation patterns. The ascending channel pattern is often followed by lower prices, but only after a downside penetration of the lower trend line.
The short-term trading strategy is to trade LIFO about 55%-65% of your position and keep your core long-term amount for a potentially higher payday above $8.
I suggest selling gradually between $4.35 and $4.50 with possible higher resistance at $4.90 and waiting for a retracement between $3.95 and $3.80 with possible lower support at $3.65.
Watch oil prices like a hawk.
Warning: The TA chart must be updated frequently to be relevant. The chart above has a possible validity of about a week. Remember, the TA chart is a tool only to help you adopt the right strategy. It is not a way to foresee the future. No one and nothing can.
For further details see:
W&T Offshore: This One Missed The Rally