DJIA - Watching January Returns
2023-12-24 07:55:51 ET
Summary
- The January Barometer has been accurate 85.7% since it was devised in 1972.
- More recently, the results are not as clear.
- January returns can indicate investor mood, but the overall market tends to go up most years regardless of January performance.
The January Barometer has two parts, (1) the first five days of January determine the strength of the year, and (2) the returns of January determine the year.
In an article by Christian Galipeau (1/20/2021), he claims that the January Barometer has been accurate 85.7% since it was devised by Yale Hirsch in 1972. Another article in Home Page says that, since 1945, when January is up, the rest of the year shows a gain of 11.7%; when it is down, the remainder of the year shows a gain of 7.2%.
I always need to verify that those numbers are correct by using the Dow daily data from 1954. Of those years, 60% showed higher returns in January. For those years, the rest of the year had a return of 8.10%. When January was down, the year had an average return of 5.03%.
Not quite the same, but still better when January was higher. It is possible that the nine years before my test and the two years after made some difference. But let’s look a bit closer.
Market Prices in January
A lot of funds will stop trading in mid-December if they have a profit. Some investors will exit losing positions for tax purposes before the end of the year. Both may reset their positions after the new year.
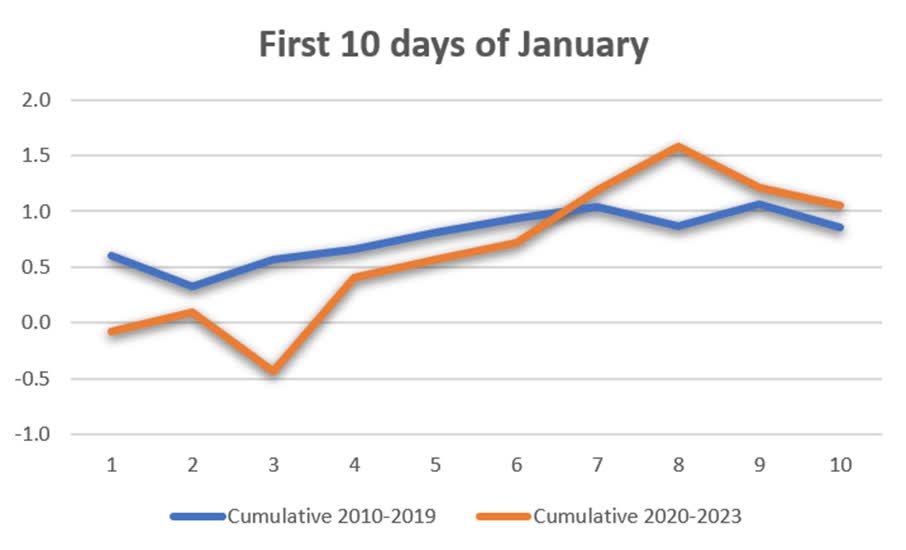
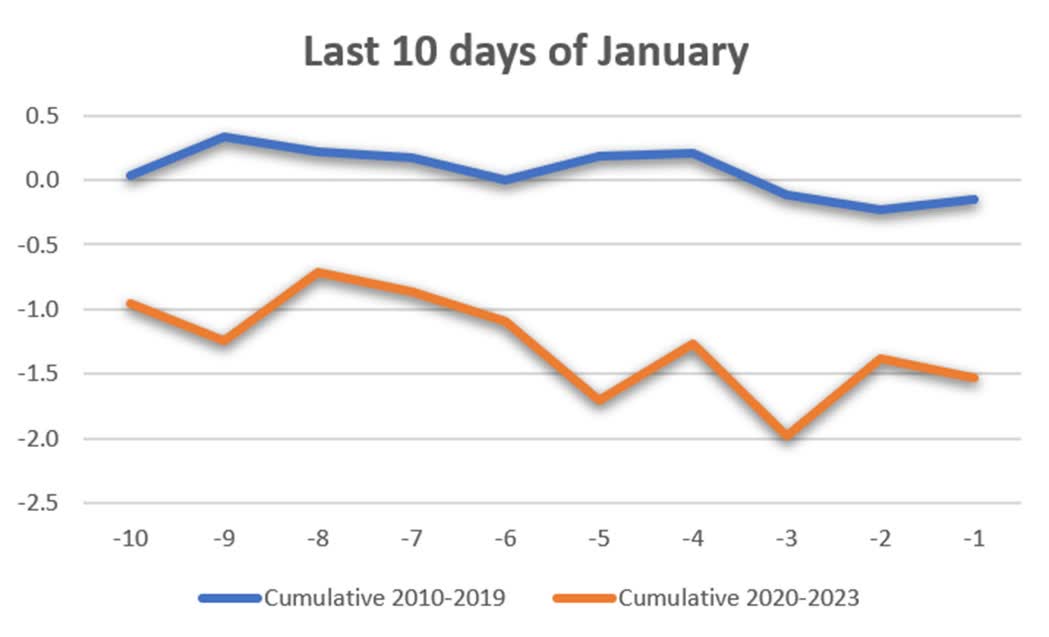
Using the S&P ETF ( SPY ), we can align the first 10 trading days of January from 2010, the beginning of the bull market. We can also go backwards from the end of January and align the last 10 days of the month. Chart 1 and Chart 2 show the results from 2010 to 2019, and also from 2020 to 2023.
Chart 1. SPY average returns for the first 10 trading days of January, cumulative.
Generally, the first 10 days gained about 1% for both periods. We could conclude that resetting stock position could have been the cause.
Chart 2. SPY average returns for the last 10 trading days of January, cumulative.
Chart 2 shows the some of the profits gained in the first 10 days are given back. In fact, in the past four years, the decline at the end of January exceeded the gain in the first 10 days.
Let’s go back to the first rule in the January Barometer, where the first five days determine the year. In my opinion, forecasting the rest of the year from the first five days is not likely to be successful. Economists have a harder time forecasting the next month from all previous data. Even if the first five days showed a correlation to the yearly returns, I would have a difficult time basing my full year investment on any five days. Given my opinion, I did not test that rule.
Using All of January
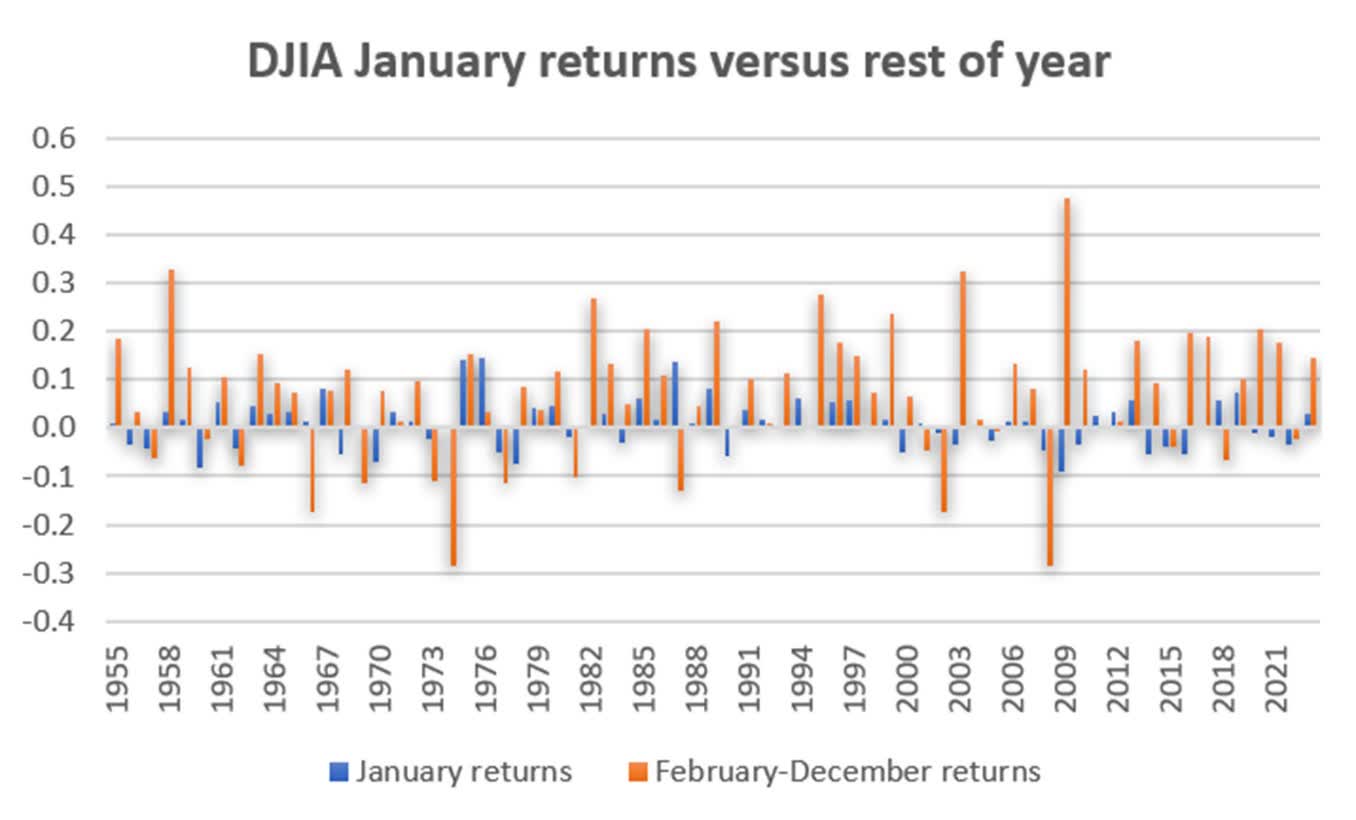
January returns can tell you the mood of the investor. But let’s look at the big picture from 1954. Chart 3 shows the January returns versus the total returns from February through December. It may be hard to read.
Chart 3. Dow Industrials for 1955 showing January returns compared to February through December returns.
What you should take away from Chart 3 is that there are very few losing years. In fact, there were 60% positive returns in January but 74% positive returns from February through December. We showed earlier that, when January was positive, the returns for the rest of the year were better than the average. But the average was still pretty good and highly reliable.
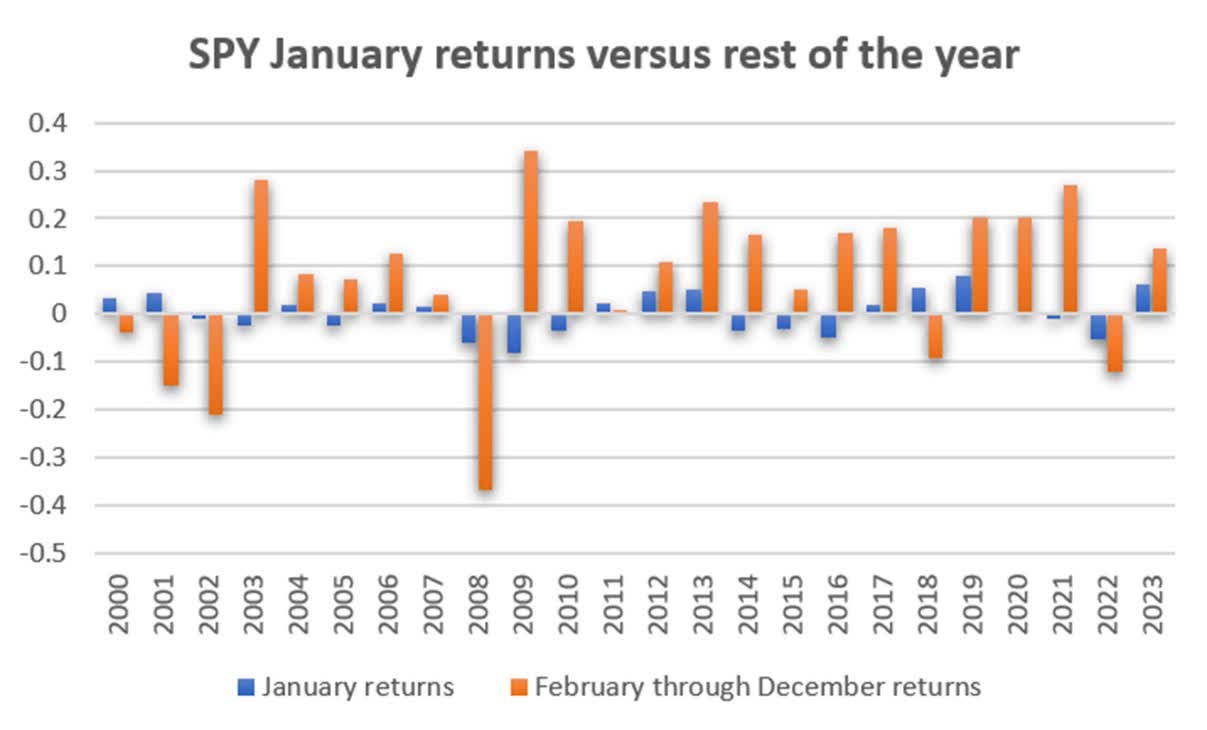
If we look more recently, using the SPY from 2000, the picture for January is not as clear. January returns were positive only 50% of the time, while the returns from February (without January) were positive 75% of the time.
Chart 4. SPY returns from 2000, January versus February to December.
While the average SPY returns from 2000 was 8.08%, the average without January was 7.83%, not ever 0.02% lower. If we remove January and February from the 2000 test we raise the return to 8.26%.
The Result
I’m not suggesting that we don’t trade until the end of February, because the overall results can be good and can fluctuate a lot, with or without January. As a short-term trader, you might want to take advantage of the early January rally and exit before the market tends to turn.
As for relying on January to set the tone for the year, it seems that party is over. The market will go up most years, with or without January.
For further details see:
Watching January Returns