SPMO - We May Be Getting Close To A Market Top
2024-01-08 04:43:00 ET
Summary
- We are entering a period whereby supportive structural flows for stocks are much less prominent, leaving the market open to a window of vulnerability.
- Measures of market internals and market breadth are no longer wholly supportive of higher stock prices, at least in the short-term.
- Sentiment and positioning have again reached levels of extreme bullishness, meaning it will be difficult for equities to move sustainably higher from here unless we achieve a soft landing. The market is priced to perfection as it were.
- It seems likely that 2024 will be a year much more like 2022 than it was 2023.
Stock market vulnerability on the rise
Since bottoming out in late October, the S&P 500 rallied roughly 15% through November and December, the Nasdaq 20% and the Russell 2000 25%. While I opined in early November such a rally was likely, I must admit I did not expect risk assets to boom during this period as much as they did. Nonetheless, following such a swift rally it hardly seems ludicrous to suggest a pullback - or even a mild correction - is due. This is exactly what I intend to lay out within this article.
Indeed, there are a number of indicators of the stock market that I monitor suggesting this is indeed the case. Most notably, we are once again about to enter the “window of vulnerability” during which many of the supportive flows (i.e., vanna and charm) that stem from an oversupply of volatility dissipate, leaving risk assets (and in particular the S&P 500) more susceptible to moves lower should the fundamentals deem it so.
This “window” is expected to open as we approach January’s equity and VIX options expirations around the 16-19th of January, with said windows generally more notable in January as this options expiration usually consists of a large number of single stock open interest. We can see this below by looking at S&P 500 seasonality, of which mid-January is generally a less-than-stellar period for stocks.
Such “windows of vulnerability” do not guarantee market weakness and thus a continued January decline is far from guaranteed, thus it is worth noting stocks could continue to rally into mid-February, where the post-February options expiration “window” looms large.
Other seasonal factors that should also weigh on stocks over the coming couple of months are buybacks or the lack thereof. Corporate buybacks are generally the least supportive of equities during January and February.
Source: Goldman Sachs Turning our attention now toward market internals, it is notable that several of these key indicators have been very much confirming the recent drop in stocks. This is most prescient in the VIX term structure, the cyclicals vs defensives ratio, and the high-beta vs low-volatility ratio, while credit spreads remain supportive for now.
Of even greater concern, however, is the ever-growing divergence between my pro-cyclical index and the S&P 500. This index tracks the relative performance of the most cyclically sensitive sectors within the stock market (i.e., retail, industrials, materials, to name a few) relative to the S&P 500 and is an excellent internal scorecard of the health of the market. The fact the S&P 500’s end-of-year rally was met with a lower high in this index is somewhat cause for concern.
Likewise, all of my measures of short-term market breadth also diverged negatively from the index at the recent highs, very much suggesting the rally was becoming increasingly narrow rather than being led by the broad swath of underlying constituents. Thus, this latest pullback should be of no surprise.
And although stocks have already retreated ~5% off the highs, what primarily leads me to believe we may be in for a more pronounced correction/consolidation over the next couple of months is the current state of sentiment and positioning. Indeed, as we can see below, the extreme level of bearishness that was present this time last year and was so supportive of equities throughout 2023 has now been almost entirely unwound, with hedge funds being the only exception.
As it stands, investors are once again outright bullish on stocks and risk assets, both on a discretionary and systematic basis. Such levels of bullishness generally do not bode well for future market returns.
Nowhere is this bullishness more notable than in the Nasdaq (a 20% rally in two months will do that). Speculators are the most bullish on the index they have been since the beginning of 2022, which turned out to be a tough year for the Nasdaq.
Perhaps the most important of these positioning extremes are CTAs, who have gone from historical short positions at the October lows to now being heavily long the market.
Source: Goldman Sachs And while CTAs could increase their overweight positions somewhat further from here, CTA convexity is now firmly to the downside. Source: Goldman Sachs What is also of note is the number of short-term sell signals that have popped up over the past couple of weeks. Firstly, my small-caps vs junk bonds relative strength indicator triggered several sell signals over the second half of December.
We have also seen a couple of S&P 500 and VIX correlation sell signals pop up in recent weeks too. It is particularly notable when we see breakdowns of the negative correlation between stocks and volatility and such breakdowns are generally seen at turning points in the market. For example, when the market moves higher and volatility does not move lower, it could mean that downside volatility (i.e., downside protection) has become too cheap and thus we see a bid in volatility despite upside moves in the underlying index. As a result, this can become self-reinforcing as dealers move from being long volatility and supportive of markets in their hedging flows to short volatility/short gamma, thus resulting in an increase in both implied and realised volatility as their hedging flows exacerbate moves in the underlying. Therefore, when we see periods of positively correlated moves in stocks and volatility to the upside, it can often (not always) be a powerful signal of short-term tops in price.
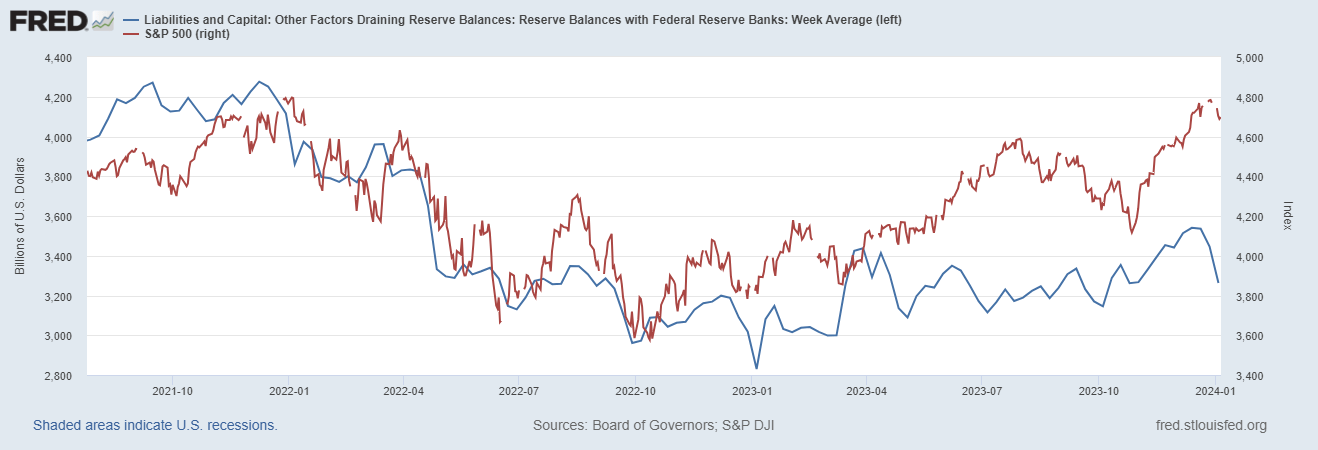
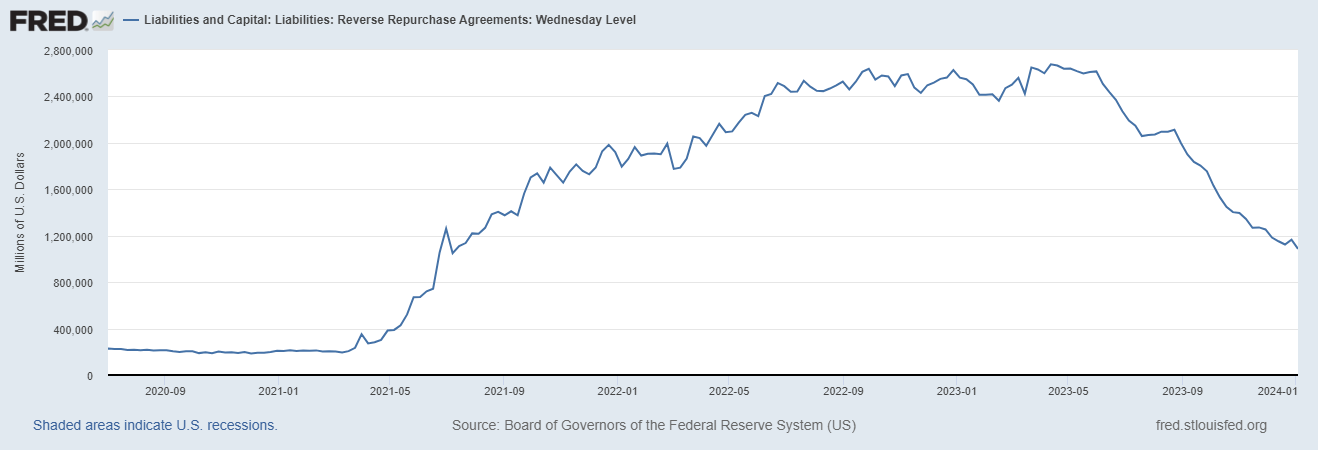
Another dynamic worth highlighting is the divergence between the S&P 500 and net liquidity (as measured by the Fed’s balance sheet less the Treasury General Account and the Reverse Repo Facility, which equates to central bank reserves). Despite the Fed undertaking QT and attempting to reduce liquidity, this was offset for much of 2023 by Yellen drawing down the TGA in addition to her reducing the duration of the Treasury bonds being issued throughout the year (particularly in Q4). This incentivised money market funds to move out of the Fed’s Reverse Repo Facility and to buy T-Bills (a net positive for liquidity as this funded the TGA, which was subsequently drawn down by the Treasury and made its way onto bank balance sheets), which not only offset QT but increased overall net liquidity, a boon for risk assets.
As we can see below, this dynamic was particularly powerful during the latter stages of last year, resulting in the Reverse Repo Facility falling from $2.5t to $1.2t. At some point, Yellen will need to increase the percentage of long-duration bonds versus short-duration bills the Treasury is issuing to fund its deficits, and when this occurs, we are likely to see net liquidity move lower as the ability for the Treasury to tap the Reverse Repo Facility will be constrained. I have no view as to a time for when this may occur, but it remains a key variable to markets worth keeping an eye on this year. In addition, it is also worth noting that there remains $1.2t in the RRP facility. This is cash on the sidelines that at some point over the coming year or so is likely to re-enter the financial system.
Turning now to the technical picture, at first glance, we can see how this rally was looking increasingly exhausted. Not only were the recent highs met with stark divergences in both RSI and momentum, but we also completed a daily 9-13 DeMARK sequential sell signal. Thus, it seems a pullback to the 4,550-4,600 level of support on the S&P 500 looks to be on the cards at some point over the next couple of months.
Whether we move materially lower or merely see a prolonged period of sideways price action remains to be seen. But, given how extreme positioning has become, and how many of the medium- to long-term indicators of equities that I monitor remain fairly neutral, there is a strong case to be made that 2024 will be a market much more akin to 2022 than it was 2023. I expect at least the first half of the new year to be ripe with volatility.
Editor's Note: The summary bullets for this article were chosen by Seeking Alpha editors.
For further details see:
We May Be Getting Close To A Market Top