LAD - Weitz Short Duration Income Fund Q1 2023 Commentary
2023-06-30 01:14:00 ET
Summary
- Weitz Investment Management is a boutique, employee-owned asset management firm headquartered in Omaha, Nebraska.
- The Short Duration Income Fund's Institutional Class returned +1.97% in the first quarter compared to a +1.51% return for the Bloomberg U.S. Aggregate 1-3 Year Index.
- Since our goal is to invest in sectors that we believe offer the best risk-adjusted returns, our allocations may change significantly over time.
The Short Duration Income Fund's Institutional Class returned +1.97% in the first quarter compared to a +1.51% return for the Bloomberg U.S. Aggregate 1-3 Year Index. For the fiscal year ended March 31, 2023, the Fund's Institutional Class returned +0.98% compared to a +0.24% return for the index. Given the investment challenges of the past year, we are pleased to report positive absolute results for the quarter and fiscal year - and good relative results.
Despite the dizzying ups and downs of an extremely volatile first quarter, fixed-income investors generally posted solid gains (our Fund included), riding the strong performance of U.S. Treasury bonds (as they often do). Price gains for bonds in January resulting from weak economic data fueled speculation of a Fed pivot, or at least a pause, in its year-long pursuit of higher short-term interest rates to slow inflation. February brought a 'blowout' jobs report that undermined any thoughts of a slowdown and resulted in a violent reversal of January's interest rate rally (as rates decrease, bond prices increase). By early March, the yield curve had reached its deepest inversion (the difference between 2-year and 10-year U.S. Treasury rates) in over 40 years.
Recession fears eased and pundits began to believe the economy could grow despite the Fed's efforts to tame inflation. Then came the collapse of Silicon Valley Bank (SIVBQ) (and others) and overall turmoil in the banking industry. Rates plummeted during the final stretch of the first quarter in a classic flight to safety amid growing worries about tightening lending conditions and the attendant effects on future economic growth. 'Pause' or 'pivot' has been replaced by market expectations of rate cuts later this year. Overall, the first quarter of 2023 had echoes of 2022. Instead of calm after a tumultuous year, investors have received more volatility and choppy markets. However, overall forward returns in fixed income (tax-free and taxable) are where the echoes/comparisons end. For the first time in seemingly forever, forward (coupon) returns compensate for this year's volatile/choppy markets where the higher overall yield environment presents a much wider range of attractive investment opportunities for fixed-income investors.
Whether the Fed does pause or pivot in its battle against inflation, we have been active in improving the forward return prospects for the Short Duration Fund. By design, the Fund has the distinct feature of having about a quarter of its holdings paydown or mature in any given year. This allows us to reinvest proceeds into today's improved forward-return environment. Part of this improvement can be seen in the Fund's improved yield-to-worst (YTW) metric. As a reminder, YTW has historically been a reasonable predictor of forward returns. The Fund's YTW increased from 2.72% on March 31, 2022, to 5.86% on March 31, 2023 - comparing favorably to the index's YTW of 4.46% as of March 31 (see table below). As important, or perhaps more so, the difference of percentage change between the Fund's and the index's YTW has widened over the past year, principally due to asset/security selection and the ability to reinvest maturities/paydowns mentioned above into a rising rate environment
| Yield to Worst / Duration Analysis |
| 3/31/22 |
| 3/31/23 |
| Change |
| % Change |
| Yield to Worst (%) |
| Short Duration Income Fund |
| 2.72 |
| 5.86 |
| 3.14 |
| 115% |
| U.S. 1-3 Yr Agg Index |
| 2.40 |
| 4.46 |
| 2.06 |
| 86% |
| Average Duration (yrs) |
| Short Duration Income Fund |
| 1.58 |
| 1.46 |
| (0.12) |
| -7.59% |
| U.S. 1-3 Yr Agg Index |
| 1.85 |
| 1.80 |
| (0.05) |
| -2.70% |
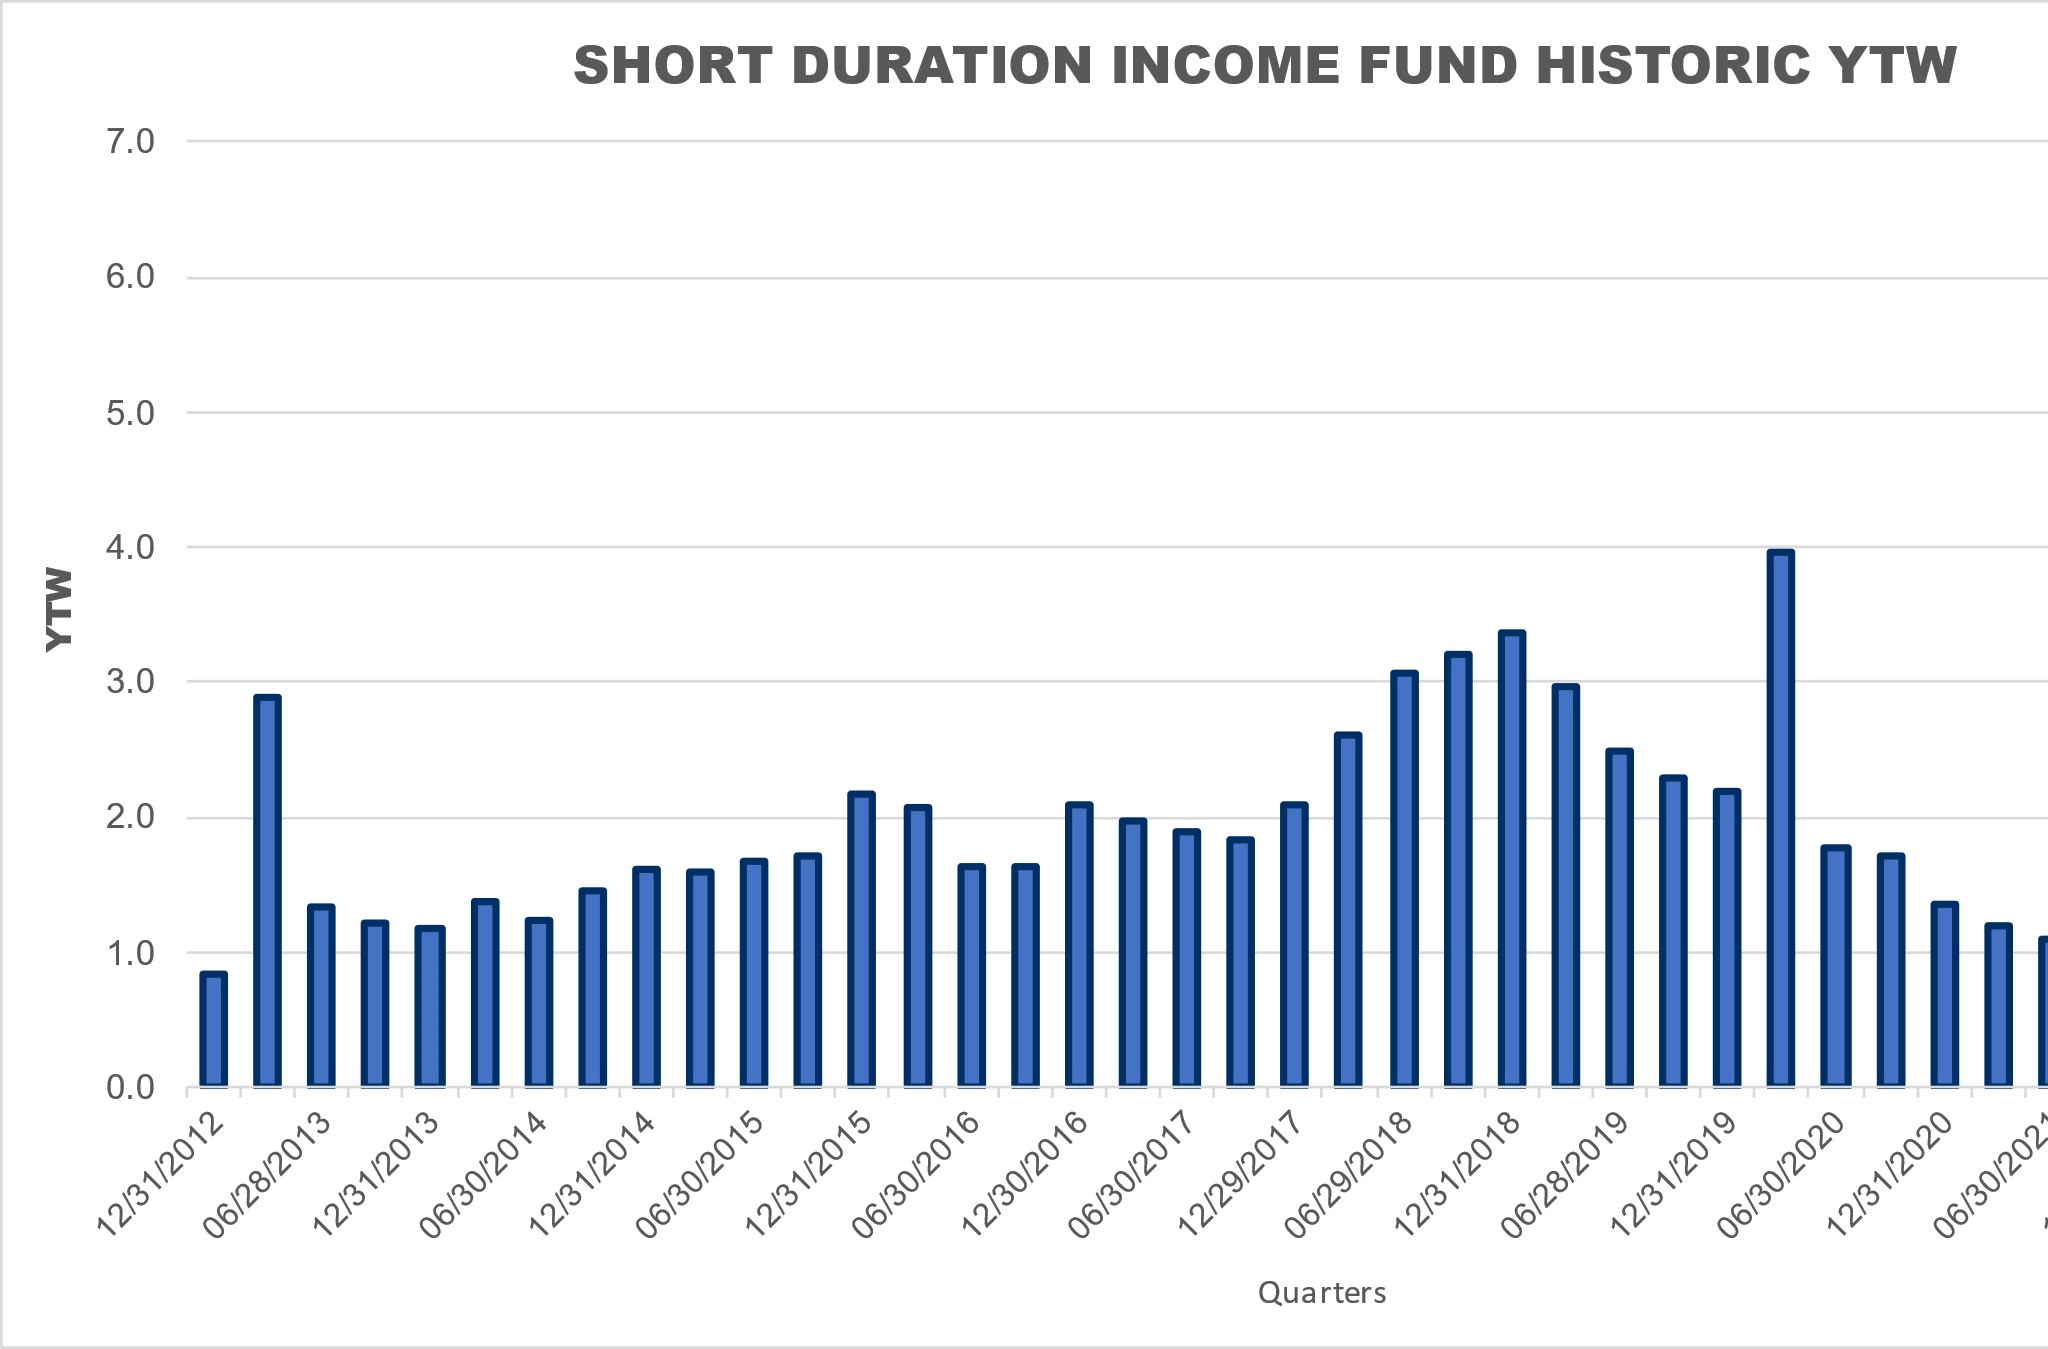
The chart below provides a longer-term view (10 years) of the Short Duration Income Fund's forward return prospects, or yield-to-worst (YTW). Until the first quarter of 2022 (right-hand side of the bar chart below), the Fund's YTW had never breached 4%. It has now exceeded 5.5% for three consecutive quarters. Given the 10-year average of 2.3% of the time series below, today's forward return prospects as measured by a YTW of 5.86% on March 31, 2023, reinforce comments we made in the 2022 year-end Fixed Income Insights (Bonds' 'Great Reset' and the Return of Income), that we remain particularly optimistic about the role fixed-income has in an overall asset allocation framework.
Portfolio Positioning
The table below shows the change in allocation to various sectors, from the prior quarter and from the prior year. This summary provides a view over time of how we have allocated capital. Since our goal is to invest in sectors that we believe offer the best risk-adjusted returns, our allocations may change significantly over time.
| SECTOR ALLOCATION (% of net assets) |
| 3/31/2023 |
| 12/31/2022 |
| Qtr Over Qtr Change |
| 3/31/2022 |
| Yr Over Yr Change |
| Corporate Bonds |
| 13.0 |
| 13.2 |
| -0.2 |
| 12.6 |
| +0.4 |
| Corporate Convertible Bonds |
| 1.1 |
| 1.8 |
| -0.7 |
| 2.5 |
| -1.4 |
| Asset-Backed Securities ((ABS)) |
| 41.1 |
| 38.7 |
| +2.4 |
| 32.8 |
| +8.3 |
| Corporate Collateralized Loan Obligations (CLOs)* |
| 13.2 |
| 13.0 |
| +0.2 |
| 11.4 |
| +1.8 |
| Commercial Mortgage-Backed Securities ((CMBS)) |
| 9.4 |
| 12.0 |
| -2.6 |
| 12.5 |
| -3.1 |
| Agency Mortgage-Backed (MBS) |
| 3.6 |
| 3.9 |
| -0.3 |
| 5.2 |
| -1.6 |
| Non-Agency Mortgage Backed ((RMBS)) |
| 5.7 |
| 6.2 |
| -0.5 |
| 7.3 |
| -1.6 |
| U.S. Treasury |
| 25.0 |
| 23.9 |
| +1.1 |
| 23.2 |
| +1.8 |
| Cash & Equivalents |
| 1.1 |
| 0.3 |
| +0.8 |
| 3.9 |
| -2.8 |
| TOTAL |
| 100 |
| 100 |
| 100 |
| High Yield** |
| 3.8 |
| 4.4 |
| -0.6 |
| 4.8 |
| -1.0 |
| Average Effective Duration |
| 1.5 |
| 1.5 |
| 0.0 |
| 1.6 |
| -0.1 |
| Average Effective Maturity |
| 2.9 |
| 3.6 |
| -0.7 |
| 3.1 |
| -0.2 |
*Corporate CLOs are included in the ABS segment in the Fund's schedule of investments but are additionally called out separately for the purposes of the discussion.
**For the current period, high-yield exposure consists of investments in the Corporate, Corporate Convertible, ABS, and CMBS sectors.
Investment activity remained strong in the first quarter as we sourced a little more than $90 million in new investments for the Fund. This helped offset the typical (and by design) feature of monthly/quarterly paydowns and maturities of securities (approximately $80 million in the first quarter). As mentioned, about a quarter of the Fund's holdings paydown or mature in any given year allowing us to frequently reinvest investor capital into areas of the fixed-income market that we believe provide the best current relative value opportunities. While this continuous reinvestment has been an occasional headwind as rates fell to near-historic lows in recent years, we believe it has and will continue to provide return upside from the rapid increase in interest rates over the past year.
Noteworthy additions in the first quarter included:
U.S. Treasury securities in the 2-3-year maturity range.
Asset-backed securities ((ABS)) issued by LendBuzz, America's Car-Mart ( CRMT ), and Lithia Motors ( LAD ), backed by auto receivables. We also participated in the senior-most securities of unsecured consumer loans issued by Marlette and Bankers Healthcare Group. LendBuzz and America's Car-Mart are new investees to the Fund lineup. LendBuzz was founded in 2015 with the goal of expanding access to credit for those who lack credit history for a variety of reasons. The company uses proprietary technology in its underwriting to analyze borrower data and create a personal credit risk profile. America's Car-Mart is an Arkansas-based public company that sells and finances the sale of used automobiles and trucks. The company operates dealerships primarily in small cities and rural locations throughout the South-Central United States and provides financing for substantially all of its customers. Like most of our other ABS investments, our LendBuzz and Car-Mart investments consist of senior-most securities (first to be repaid and last to receive any possible future loss) that have a short average life (less than 2.0 years).
Middle-market collateralized loan obligations (CLOs) issued by Deerpath, Twin Brook, and Apogem (formerly Madison Capital). We continued to expand our comfort and coverage in the middle-market private lending space with Twin Brook and Apogem being the newest investees to the Fund lineup. The decline in the number of U.S. public companies by a third over the last 25 years has meaningfully expanded the market for private lenders like Deerpath, Twin Brook, Apogem, and our other middle-market investee sponsors. Per public sources, the U.S. middle market consists of roughly 200,000 companies, accounts for approximately one-third of U.S. jobs, 33% of private sector GDP, and represents companies across all industry segments and geographies with $10 million to $1 billion in annual revenues. Twin Brook is a Chicago-based provider of cashflow-based financing for the middle-market private equity community. Backed by the broader Angelo Gordon platform, Twin Brook has the scale and industry expertise to provide tailored finance solutions that fit its sponsors' and borrowers' needs. Apogem, a wholly owned subsidiary of New York Life, is an alternative investor that has decades of experience investing in the middle market. Twin Brook and Apogem, like the vast majority of the Fund's other middle-market CLO investments, are floating-rate, senior securities.
Commercial real estate CLOs (CRE CLOs) issued by Arbor Realty ( ABR ).
Noteworthy reductions (sales) in the first quarter:
We proactively took advantage of favorable valuations and, in hindsight, good timing (before the Silicon Valley Bank collapse) to reduce our exposure to CRE CLOs by selling a little over $20 million of Fund investments across five sponsor investees. This represented the largest reduction in Fund segment/sector exposure during the quarter and fiscal year. The CRE CLO sales were backed primarily by multi-family loans. We will likely partner with and lend to these sponsors in the future - but we deemed it appropriate to reduce our exposure given the valuations presented to us at the time of sale.
In terms of overall portfolio metrics, from December 31, 2022, to March 31, 2023, the average effective maturity decreased from 3.6 to 2.9 years, and the average effective duration stayed steady at 1.5 years. These measures provide a guide to the Fund's interest rate sensitivity. A higher average effective maturity and longer average effective duration increase the Fund's price sensitivity to changes in interest rates (either up or down). Another portfolio attribute to highlight is the Fund's investments in floating-rate securities (mainly middle-market CLOs and CRE CLOs). As of March 31, 2023, more than 22% of Fund assets were represented by floating-rate securities. We don't invest based on any wager that the Fed will raise short-term interest rates - as each investment is vetted based on its individual merits (relative risk/reward) and the expected future nominal return contributions each can make to the Fund. However, we believe the Fund's exposure to floating rate investments has provided coupon income upside as the Fed has moved away from its near-decade-long zero-interest-rate policy (ZIRP).
Top Quarterly Contributors
U.S. Treasury; agency and non-agency residential mortgage-backed securities ((RMBS)); and a broad segment of asset-backed securities ((ABS)) were the main contributors to Fund performance in the quarter.
Top Quarterly Detractors
No segment detracted from Fund performance in the quarter.
Fiscal year results
Fiscal year results were aided by the Fund's CLO (both middle-market and commercial real estate), ABS, and select corporate bond investments in the retail segment. Noteworthy fiscal year detractors included non-agency mortgage-backed securities and U.S. Treasury securities.
Fund Strategy
Our approach consists primarily of investing in a diversified portfolio of high-quality bonds while maintaining an overall portfolio average effective duration of 1.0 to 3.5 years. We may invest up to 15% in fixed-income securities that are not considered investment grade (such as high-yield and convertible bonds), and we do so when we perceive the risk/reward characteristics to be favorable.
We do not, and will not, try to mimic any index as we construct our portfolio. We believe our flexible mandate is a differentiator that allows us to navigate any environment. The last few years have reinforced our conviction about the strength of our flexible mandate. We utilize a bottom-up, research-driven approach and select portfolio assets one security at a time based on our view of opportunities in the marketplace. Our fixed-income research is not dependent on, but often benefits from, the due diligence efforts our equity teammates conduct on companies and industries.
Overall, we strive to be adequately compensated for the risks assumed while seeking to maximize investment (or reinvestment) income and avoid making interest-rate bets, particularly ones that depend on interest rates going down.
Our goal is to (a) preserve capital, (b) maintain a strong liquidity position, (c) understand evolving risks and opportunities, (d) conduct consistent/thorough credit surveillance, and (e) selectively take advantage of favorable risk/reward opportunities. We remain ready to take advantage of any further valuation disparities that may develop and will strive to continue to earn your trust.
| Returns (%) |
| Total Returns |
| Average Annual Total Returns |
| Since |
| Merger |
| QTR |
| YTD |
| 1-YR |
| 3-YR |
| 5-YR |
| 10-YR |
| 20-YR |
| 30-YR |
| (12/23/1988) |
| Net Expense |
| Gross Expense |
| WEFIX Institutional Class |
| 1.97 |
| 1.97 |
| 0.98 |
| 1.92 |
| 1.87 |
| 1.56 |
| 2.99 |
| 4.00 |
| 4.62 |
| 0.48 |
| 0.62 |
| WSHNX Investor Class |
| 1.96 |
| 1.96 |
| 0.83 |
| 1.84 |
| 1.74 |
| 1.38 |
| 2.88 |
| 3.93 |
| 4.56 |
| 0.55 |
| 0.90 |
| Bloomberg U.S. Agg 1-3 YR Index |
| 1.51 |
| 1.51 |
| 0.24 |
| -0.51 |
| 1.21 |
| 0.99 |
| 2.05 |
| 3.37 |
| n/a |
| - |
| - |
This material must be preceded or accompanied by a prospectus or summary prospectus .
Data is for the quarter ending 03/31/2023. The opinions expressed are those of Weitz Investment Management and are not meant as investment advice or to predict or project the future performance of any investment product. The opinions are current through 04/20/2023, are subject to change at any time based on market and other current conditions, and no forecasts can be guaranteed. This commentary is being provided as a general source of information and is not intended as a recommendation to purchase, sell, or hold any specific security or to engage in any investment strategy. Investment decisions should always be made based on an investor's specific objectives, financial needs, risk tolerance, and time horizon.
Data quoted is past performance and current performance may be lower or higher. Past performance is no guarantee of future results. Investment return and principal value of an investment will fluctuate, and shares, when redeemed, may be worth more or less than their original cost. Please visit weitzinvestments.com for the most recent month-end performance.
Investment results reflect applicable fees and expenses and assume all distributions are reinvested but do not reflect the deduction of taxes an investor would pay on distributions or share redemptions. Net and Gross Expense Ratios are as of the Fund's most recent prospectus. Certain Funds have entered into fee waiver and/or expense reimbursement arrangements with the Investment Advisor. In these cases, the Advisor has contractually agreed to waive a portion of the Advisor's fee and reimburse certain expenses (excluding taxes, interest, brokerage costs, acquired fund fees and expenses, and extraordinary expenses) to limit the total annual fund operating expenses of the Class's average daily net assets through 07/31/2023.
The Gross Expense Ratio reflects the total annual operating expenses of the fund before any fee waivers or reimbursements. The Net Expense Ratio reflects the total annual operating expenses of the Fund after taking into account any such fee waiver and/or expense reimbursement. The net expense ratio represents what investors are ultimately charged to be invested in a mutual fund. Performance quoted for Investor Class shares before their inception (08/01/2011) is derived from the historical performance of the Institutional Class shares and has not been adjusted for the expenses of the Investor Class shares, had they, returns would have been different.
Effective 12/16/2016, the Fund revised its principal investment strategies. Since that time the Fund has generally maintained an average effective duration between one to three and a half years. Prior to that date, the Fund maintained a dollar-weighted average maturity of between two to five years. Performance prior to 12/16/2016 reflects the Fund's prior principal investment strategies and may not be indicative of future performance results.
Short Duration Income Fund's inception date is December 28, 1988. The investor class inception date is August 1, 2011. Performance for investor class shares before their inception date uses the historical performance and expenses of institutional class shares. Effective December 16, 2016, the Fund revised its principal investment strategies. Since that time the Fund has generally maintained an average effective income duration between one to 3½ years. Prior to that date, the Fund maintained a dollar-weighted average maturity of between 2 to 5 years. Performance prior to December 16, 2016, reflects the Fund's prior principal investment strategies and may not be indicative of future performance results.
Index performance is hypothetical and is shown for illustrative purposes only. You cannot invest directly in an index. The Bloomberg 1-3 Year U.S. Aggregate index is generally representative of the market for investment grade, U.S. dollar-denominated, fixed-rate taxable bonds with maturities from one to three years.
Holdings are subject to change and may not be representative of the Fund's current or future investments.
Credit ratings are assigned to underlying securities utilizing ratings from a Nationally Recognized Statistical Rating Organization (NRSRO) such as Moody's and Fitch, or other rating agencies and applying the following hierarchy: security is determined to be Investment Grade if it has been rated at least BBB- by one credit rating agency; once determined to be Investment Grade (BBB- and above) or Non-Investment Grade (BB+ and below) where multiple ratings are available, the lowest rating is assigned. Mortgage-related securities issued and guaranteed by government-sponsored agencies such as Fannie Mae and Freddie Mac are generally not rated by rating agencies. Securities that are not rated do not necessarily indicate low quality. Ratings are shown in the Fitch scale (e.g., AAA). Ratings and portfolio credit quality may change over time. The Fund itself has not been rated by a credit rating agency.
Definitions: Average effective duration provides a measure of a fund's interest-rate sensitivity. The longer a fund's duration, the more sensitive the fund is to shifts in interest rates. Average effective maturity is the weighted average of the maturities of a fund's underlying bonds. Commercial real estate collateralized loan obligations (CRE CLOs) are a type of asset-backed security backed by a pool of commercial loans. Investment Grade Bonds are those securities rated at least BBB- by one or more credit ratings agencies. Middle market refers to smaller companies, generally with earnings before interest, taxes, and amortization of generally less than $75 million. Non-Investment Grade Bonds are those securities (commonly referred to as "high yield" or "junk" bonds) rated BB+ and below by one or more credit ratings agencies. Yield to worst (YTW) is the lowest potential yield that can be received on a bond portfolio without the underlying issuers defaulting.
Consider these risks before investing: All investments involve risks, including possible loss of principal. These risks include market risks, such as political, regulatory, economic, social, and health risks (including the risks presented by the spread of infectious diseases). In addition, because the Fund may have a more concentrated portfolio than certain other mutual funds, the performance of each holding in the Fund has a greater impact on the overall portfolio, which increases risk. See the Fund's prospectus for a further discussion of risks related to the Fund.
Investors should consider carefully the investment objectives, risks, and charges, and expenses of a fund before investing. This and other important information is contained in the prospectus and summary prospectus, which may be obtained at weitzinvestments.com or from a financial advisor. Please read the prospectus carefully before investing. Weitz Securities, Inc. is the distributor of the Weitz Funds.
Editor's Note: The summary bullets for this article were chosen by Seeking Alpha editors.
For further details see:
Weitz Short Duration Income Fund Q1 2023 Commentary