BRW - XFLT And My Other Top 10 Holdings
2023-07-17 06:15:03 ET
Summary
- Writing about your own investing is like "eating your own cooking in public".
- Here are my top ten personal holdings, the largest "engines" in my own personal Income Factory.
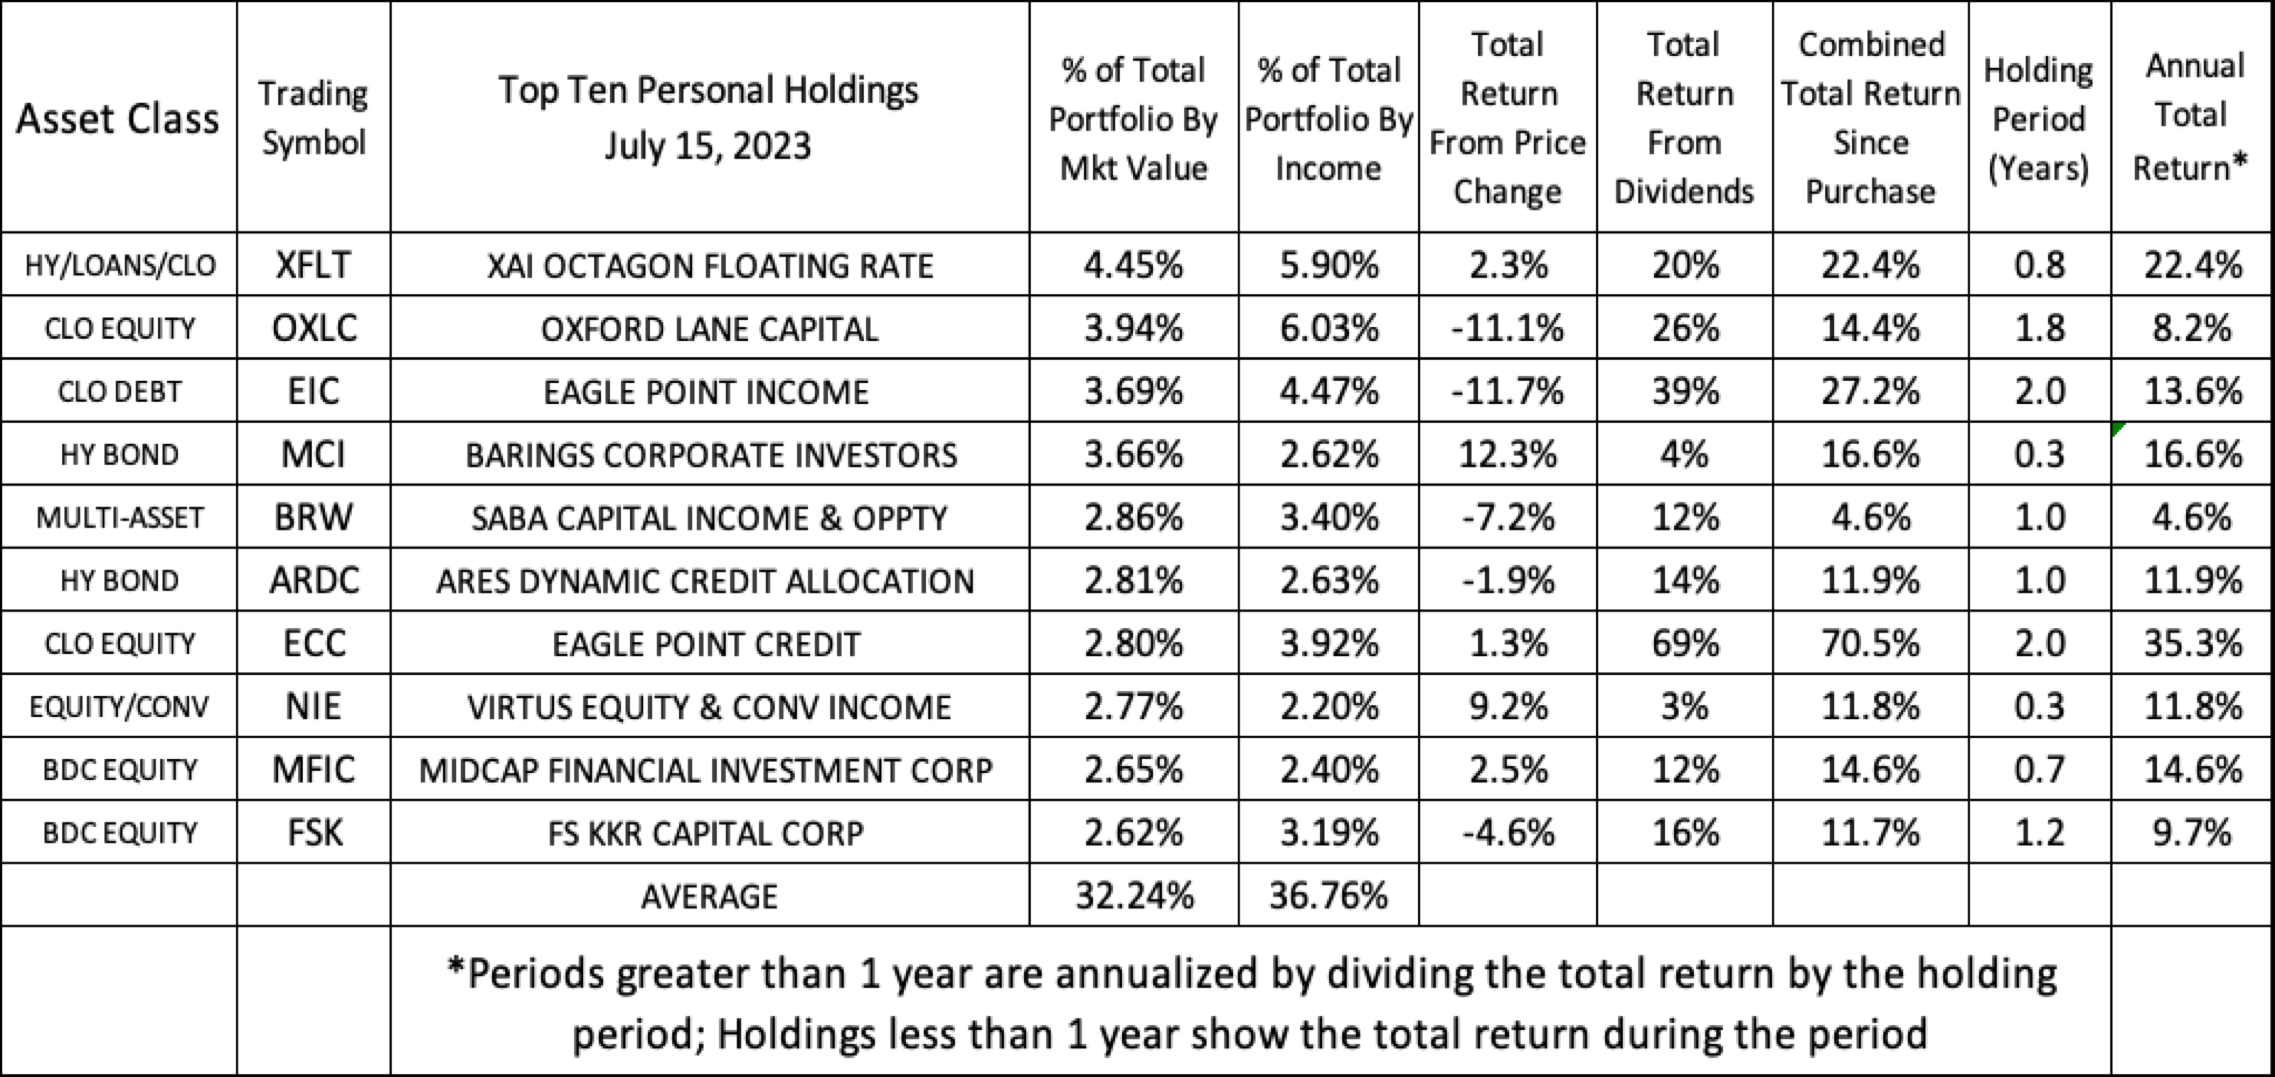
- Annual total returns for the top ten holdings range from 35% to 4%, depending on when they were acquired during the past three years.
- My year-to-date total return for the entire portfolio is about 16%, with a distribution yield of 12%; SPY's year-to-date total return is 18%, with a yield of 1.5%.
- Topping the list are XFLT, OXLC, EIC, and MCI.
[This article and an expanded and more detailed list was shared with our Inside the Income Factory® members and trial subscribers on July 7th.]
My Top 10 Personal Holdings
Many readers have expressed interest in my personal investments, and I think it is important to be as transparent as possible. I have often suggested that writing about your own investments is somewhat like "having to eat your own cooking... in public!"
So in that spirit, let me present my top ten personal investment holdings, ranked by the percentage each represents of the total market value of the portfolio. I also list, in the second column, the percentage each holding's distribution yield represents of the total cash income of the portfolio. As most readers know, the main focus of Income Factory® investing is on "creating your own growth" by reinvesting and compounding cash income, rather than worrying so much about shorter-term market price movements. So it is this second statistic, the rank by percentage of portfolio cash income, that actually is the more important one to me. The first is the rank by market value, which is certainly important. But the second statistic is the ranking by how much "output" that particular holding produces, in terms of actual cash flow generation.
Note that these ten holdings represent about one-third of the entire portfolio, by market value, with the remainder of the portfolio containing 46 holdings, with an average of the remaining holdings representing about 1.5% of the portfolio, but with a wide variation between "full positions" of 2-2.5% and smaller or "toe-in-the-water" holdings of as little as 0.5%.
As we go down the list, you will notice that most of my top ten holdings are credit investments as opposed to equity investments. This reflects my strong belief that there is no reason to take more risk than you need to in order to achieve your investing goals at any particular time. Credit investing (i.e. corporate loans, bonds, etc.), where you are merely betting on the issuer staying alive and paying its debts (even if its business stagnates and its stock goes nowhere), is a lot easier bet to win than an equity bet, where your issuer has to not only stay alive and pay its debts, but also has to grow its business, earnings and dividends in order for its equity to be worth more. So if I can make the 10% and higher yields the credit markets have been paying over the past year or so, because of all the concern about downturns, recessions and other economic unknowns, and not have to take the additional risks of owning equity, then I'm happy to do it.
I've often called this "non-heroic" investing and compared it to going to a track and being able to bet on horses to merely "finish the race," as opposed to having to pick which horses would win, place or show. It's pretty obvious which would be an easier bet to win, either at the track or in the financial markets.
I acquired all of these holdings at different times in the past three years, some at what turned out to be very auspicious moments, and others much less so. That's not surprising given the volatility we've experienced during that time. Overall, except for assets acquired in the last few months, most of the total return has been from distributions and not from market price movements. That is not surprising for a high-yield portfolio, where the goal was to emphasize cash payouts and minimize the importance of price growth.
The annualized returns range from a high in the 20-30% range for funds like Eagle Point Credit ( ECC ) and XAI Octagon Floating Rate ( XFLT ) that I bought at opportune times and have also collected the unusually high distributions, to ones like Saba Capital Income ( BRW ) and Oxford Lane Capital ( OXLC ) where the timing of my purchases was inopportune and drags down my overall total returns despite the generous distributions. I am hoping that the high discounts still prevailing in the corporate credit markets that drag down NAVs even while presenting terrific reinvestment opportunities for many of our funds, will pay off in capital gains as the assets (loans, bonds, etc.) being purchased at discounts ultimately pay off at par when they mature over the next few years.
Here are the specific holdings:
At the top of the list is XAI Octagon Floating Rate & Alternative Income, which deserves its long name because it does a lot of things. Almost half of its portfolio is senior secured corporate loans, one of the most solid asset classes in the corporate debt arena, where you are at the top of the capital structure, well secured with a record over many years of recovering about two-thirds of principal even in the relatively rare cases where the issuer defaults. Good assets to hold going into a possible economic downturn or recession. In addition, XFLT owns both equity and debt issued by Collateralized Loan Obligations ("CLOs"), which are securitized vehicles comprising senior secured loans (essentially "virtual banks"), and pay very attractive yields with a good history of holding up well during periods of market volatility.
I've been buying more of XFLT over the past year or so, with an average holding period now less than a year, so between the recent upturn and its generous, recently increasing yield (currently 15%), it's been a good performer. Its manager, Octagon, has been managing CLOs and other private credit investments for the past 25 years.
Oxford Lane Capital is a CLO equity fund that continues to pay a very generous cash distribution yield (which it just raised to 19% ). Unfortunately its price has languished recently and I honestly don't know whether that is merely due to underlying market prices that are temporarily (and probably unduly) penalizing credit assets because of the looming economic downturn/recession, or whether it represents a permanent erosion of value. So far I've made a lot more in distributions than I've lost on price, and I see the recent increase in the payout as a positive sign of management's optimism about the future, but plan to monitor this carefully.
Eagle Point Income ( EIC ) is another one where the market price action has been disappointing lately, although I attribute that mostly to a credit market that is over-compensating investors for credit risks that are probably overblown. I know personally, from time spent as a journalist, that bad news, "the sky is falling" types of articles always sell well to both editors and the reading and/or viewing public, and there has been lots of that in the financial press over the past year. Meanwhile, two-thirds of EIC's portfolio consists of CLO debt in the double-B rated category, which is a real "sweet spot" in the CLO liability structure that typically pays higher yields and has a better credit (i.e. default) record than traditional corporate debt of similar ratings. I think this is because many investors see the name "CLO debt" as opposed to garden-variety "corporate debt" and think it must be weird and exotic. So they either don't buy it or demand a higher yield in order to do so.
But even with price deterioration since buying it, EIC's generous distributions over the past few years have more than offset the price erosion, providing me with a 13% annual total return. Bottom line, I'm not worried much about EIC's assets (especially the 2/3rds in CLO debt) not paying out at par, but the market price could continue to be erratic over time. Meanwhile, knowing that insiders and institutional investors own over 50% of the fund provides me with additional comfort.
Barings Corporate Investors ( MCI ) has been one of the very top-rated high-yield bond funds for literally generations. The high yield corporate debt it owns consists mostly of secured, privately-placed transactions that it arranges directly with the private capital firms that own the issuers. MCI is one of the best, although somewhat below the radar scope, stories in the closed-end fund and private capital markets. Read more about it here. I bought most of my holding just a few months ago, so my total return so far is mostly from the recent capital gains. But the 8% yield, along with steady capital gains, have brought its long-term average total return to over 12% since its inception over 50 years ago.
Saba Capital Income & Opportunities is sort of a hedge fund in closed-end fund clothing. It's run by legendary hedge fund operator Boaz Weinstein and carries his initials as well as his personal management attention. He just took it over during the past couple years and it's still getting on its feet as well as finding the sort of opportunistic investments we are all hoping Weinstein uncovers. Meanwhile it's selling at a 9.5% discount and paying out about 12%. Other institutional investors own 42% , so we're in good company.
Ares Dynamic Credit Allocation ( ARDC ) is about as solid as it gets in the private credit arena. Up about 12% in terms of YTD total return, with a discount just under 12%, a payout of 11%, and managed by Ares, one of the best credit shops in the business. Also 37% owned by a lot of top institutional investors.
Eagle Point Credit, another CLO equity fund, although here the market price action hasn't been the drag it has been on OXLC, which means most of ECC's generous distribution (recently 16% per annum yield) is currently being fully covered by a total return of 13.7% year-to-date (i.e. 27% annualized).
Virtus Equity & Convertible Income Fund ( NIE ) has been one of the top rated hybrid funds for the past 10 years, with total return annualized at just under 11%. Up 24% so far this year, but still sells at a 9% discount while paying out a 9% yield.
MidCap Financial Investment Corporation ( MFIC ), recently added to our Inside the Income Factory's Consolidated Model Portfolio, is managed by Apollo, a top credit organization. It has earned a total return to date this year of 21% and sells at a 14% discount to its NAV. It also pays a dividend of over 11%.
Finally, FS KKR Capital Corporation ( FSK ) , which has a really solid sponsor ( KKR ), has earned 21% year-to-date and still sells at a 21% discount to NAV.
Both FSK and MFIC represent equity investments in business development companies ("BDCs"). With BDCs, we are essentially investing in the senior corporate loan market, although BDCs focus on the middle market part of that market. The risk/reward profiles of FSK and MFIC are not dissimilar to that of MCI, in that all three involve senior secured loans to middle market companies, often with the involvement of a private equity firm as the owner and sponsor of the issuer. In all three cases, we are lending to firms or in the case of MCI, a fund, managed by three high quality and experienced credit organizations: KKR, Apollo and Barings/Mass Mutual.
Besides these top ten and my other holdings in my personal portfolio, I also have two separate accounts, in which I hold "live" replicas of the two Inside the Income Factory model portfolios. One of those portfolios holds mostly credit and other high yielding assets and pays a current distribution yield of almost 11%. It is designed ideally for IRA and other tax-deferred investors, who can reinvest and compound the cash income without having to worry about how it would be taxed if held in a taxable account. The other model, the taxable portfolio, is designed to hold mostly equity funds of one sort or another that are "tax-advantaged" in that they hold assets that, while still high-yielding (the portfolio averages 8%), mostly pay distributions that are "qualified" for tax purposes or include return of capital ("ROC") of the constructive variety, that defers taxes until the asset is sold.
As always, I look forward to your comments and questions. For an inside look at how I go about assessing closed-end funds and other potential candidates for my various portfolios, check out this article: "From Slide Rules to Spreadsheets: Coping With Analytic Overload."
For further details see:
XFLT And My Other Top 10 Holdings