UTES - XLU: Collect And Protect With Hedged Investing
2023-05-12 04:05:21 ET
Summary
- There are several utility sector ETFs to choose from that vary in holding selection and weighting methodology.
- Evidence suggests there is little benefit to multi-factor and momentum ETF schemes, at least in a positive way.
- Despite relatively ordinary risk-adjusted performance compared to peers, XLU holds one major advantage.
- The defensive higher equity income nature of utilities can be collected while protecting capital using a LEAPS hedging strategy.
This article covers a range of utility industry sector ETFs available to investors and includes market cap weighted, equal weighted, multi-factor/alternative, and active strategies.
The utility industry group includes companies that operate within five main categories. Electric utilities focus on producing and distributing electricity. Gas utilities focus on natural and manufactured gas distribution. Water utilities deal with purchasing and distributing water to consumers and operating water treatment systems. A class of multi-utilities operates diverse activities in all three of those areas. Finally, you have your independent producers, energy traders, and companies that focus on renewables.
The sector is largely viewed as defensive and many invest in it for equity income. A hedged trade opportunity will be presented at the end that would allow investors to collect dividend income and protect their capital.
Cap Weighted ETFs
The Utilities Select SPDR ETF ( XLU ) is far and away the biggest fund in the sector with $16.39B in assets. It seeks to track the Utilities Select Sector Index ( IXU ) which selects 30 companies included in the S&P 500 Index using market capitalization for weighting and tilts heavily toward large-cap stocks. It accounts for concentration limits imposed by current US Internal Revenue Code rules intended to keep any single holding from exceeding 25% of the index. Concentration rules are also in place for holdings that exceed 5% of the index where the summed weight of those holdings cannot exceed 50%. While this prevents extreme concentration, the top 10 holdings still account for 60% of the index with NextEra Energy ( NEE ) topping 15% as the largest holding. XLU carries a low 0.10% expense ratio and exhibits great liquidity.
Vanguard Utilities ETF ( VPU ) is the second largest fund with $5.43B in assets, which is only 1/3rd of XLU to put that into perspective. It seeks to track the MSCI US IMI Utilities 25/50 Index that also uses market capitalization for weighting but can include stocks with any market cap, so you get a lot more mid-cap exposure over XLU. The 25/50 inclusion in the index name is a reference to the same US IRC rules outlined for XLU. It doesn't have the same S&P 500 Index inclusion rule so it more than doubles the number of holdings compared to XLU. That lowers the top 10 holdings concentration level to 53%. It is still US-centric though with NextEra Energy remaining at the top spot and matches XLU with a 0.10% expense ratio.
Fidelity MSCI Utilities ETF ( FUTY ) is a direct competitor to VPU. It tracks the same MSCI US IMI Utilities 25/50 Index. For those looking to shave a couple of basis points off the expense ratio, this is your fund barring any other considerations.
iShares U.S. Utilities ETF ( IDU ) is another US-centric, market capitalization-weighted fund choice with assets at just over $1B. It seeks to track the Russell 1000 Utilities RIC 22.5/45 Capped Index and tilts toward large-cap stocks with decent exposure to mid-cap stocks. It's a highly liquid fund, but the expense ratio is high at 0.39%. A common theme continues with NextEra Energy as the top holding.
Invesco S&P SmallCap Utilities & Communication Services ETF ( PSCU ) stands at the opposite end of the spectrum compared to XLU's size. Assets under management clock in at a paltry $20M. It also differs greatly with a focus on small-cap stocks, seeking to track the S&P SmallCap 600 Capped Utilities & Communication Services Index. The 0.29% expense ratio looks to be right-sized given there are no other real alternatives for small-cap exposure. Liquidity is average at best with median daily volume a mere $25K. A characteristic that separates this fund from others is its exposure to telecom stocks, which account for roughly 14% of its holdings. American States Water ( AWR ) is the top holding.
Equal Weighted ETFs
Invesco S&P 500 Equal Weight Utilities ETF ( RYU ) moves away from the market capitalization weighting scheme. It seeks to track the S&P 500 Equal Weight Utilities Plus Index which still tilts toward large-cap stocks, but greatly reduces concentration with the top 10 holdings accounting for 35%. That's a sizable decrease over the low to mid-50s range for market cap-weighted indexes but it comes with a higher 0.40% expense ratio.
Multi-Factor/Alternative ETFs
First Trust Utilities AlphaDEX ETF ( FXU ) is a modified equal-weight fund option that balances out large-cap exposure with a good deal of mid-cap stocks. It seeks to track the impressive-sounding StrataQuant Utilities Index that incorporates a multi-factor approach to selection and a tiered approach to weighting, so right off the bat you know it'll have a higher expense ratio and it does at 0.64%. The index attempts to factor in both growth and value components to rank prospective constituents. Growth factors include price appreciation over multiple periods, sales valuation, and sales growth over the last year. Value factors look at book value and cash flow valuations along with return on assets. Factors are combined to form ranking scores where the top 75% of eligible stocks, max 40, are included in the index. Ranks are tiered into five groups of eight, with each tier progressively receiving less weighting. This puts the top 10 holding concentration in the middle of the road at 40% when compared to industry alternatives.
Invesco DWA Utilities Momentum ETF ( PUI ) is distinctive in that it uses price momentum for holding selection and weighting. It seeks to track the Dorsey Wright Technical Leaders Utilities Index ( DWUT ) and targets 30 US stocks based on relative strength. To be eligible for inclusion, stocks have to be ranked in the top 2000 by market cap within the NASDAQ US Benchmark Index ( NQUSB ) and have a 3-month average daily volume of at least $1 million. NextEra Energy is the top holding, and the top 10 concentration stands at 40%.
Global ETFs
iShares Global Utilities ETF ( JXI ) breaks free from US-centric funds. It seeks to track the S&P Global 1200 Utilities Index Sector ( SPG1200-55 ) and is weighted by market cap with a 10% cap placed on any individual holding. Although it is global, 65% of the index is comprised of US companies and tilts heavily toward large-cap stocks like other ETFs in the space. The expense ratio is a bit high at 0.40%, but there's no alternative in the space. Even when accounting for the entire world and a 10% individual holding cap, NextEra Energy still ranks in the top spot. The individual cap does achieve a lower concentration with the top 10 holdings accounting for 43%.
Active ETFs
The Virtus Reaves Utilities ETF ( UTES ) is a small actively managed fund with assets totaling $44.62M. The expense ratio stands at 0.49%, which compares favorably for an active fund to a more complicated passive fund like FXU. Liquidity is decent but larger trades could pose challenges. Even with an active approach, NextEra Energy is the top holding and at a higher level than any other fund at 20%. This fund is highly concentrated with only 20 stocks total, so you're putting your faith in the management team's ability to pick winners and avoid losers. So far it has worked out.
High-Level Comparison
The following table outlines much of what has already been covered. It shows the size, expense ratio and number of holdings for each fund. Concentration levels and the last reported portfolio turnover are also given. This is topped off by showing the current yield.
Utility ETF Characteristics (Michael Thomas)
XLU, VPU, and FUTY are the obvious choices for those geared toward the lowest fund costs while RYU provides the least concentration risk. XLU, VPU, and JXI all offer current yields of 3%+, which is roughly twice that of the S&P 500.
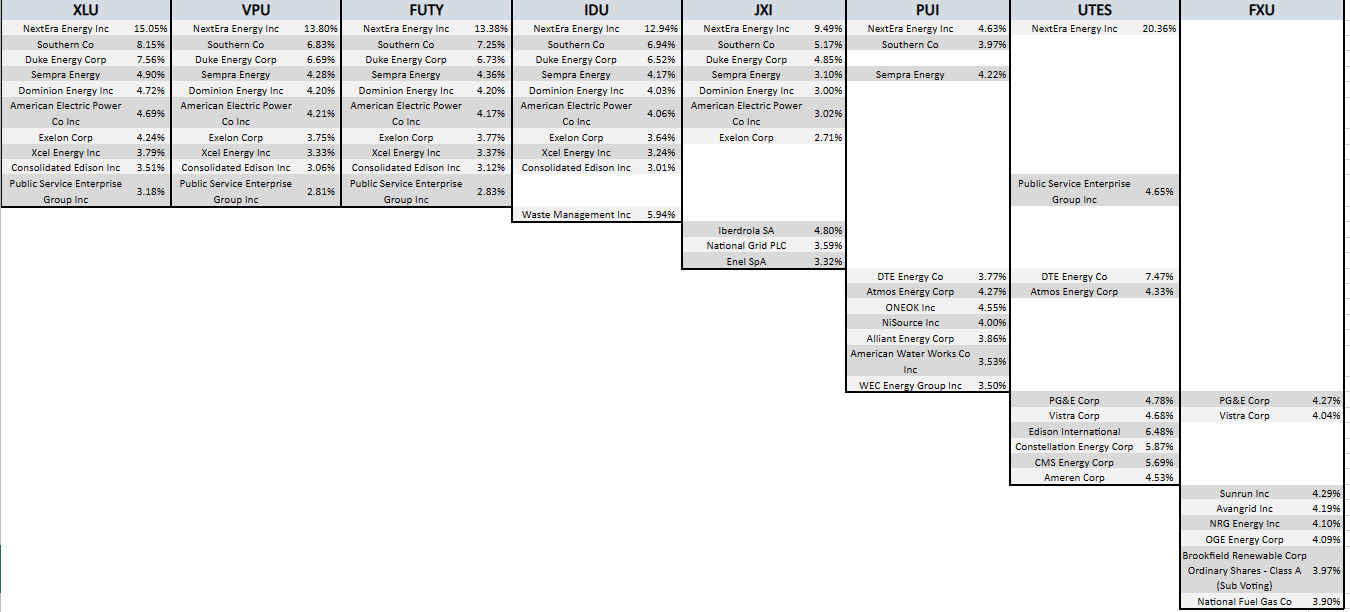
The overview for each ETF made it pretty clear that NextEra Energy was heavily represented and that is confirmed in the following chart. This chart uses XLU as an anchor and works its way through the other ETFs in order of the number of shared top 10 holdings. Each holding's weight is also included. I do not include RYU as it's equally weighted and FXU only shows eight holdings because of the unique tiering used.
Top 10 Holdings Matrix (Michael Thomas)
It's easy to see that XLU, VPU, and FUTY all share top 10 holdings and IDU shares all but two. FXU shares the least amount of holdings followed by PUI and UTES. JXI's global exposure gives it three unique holdings.
Historical Performance
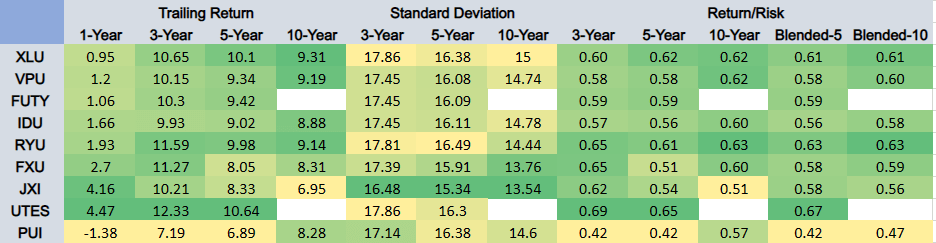
To compare our utility ETFs' historical performance, we use various timeframes in analyzing both returns and volatility. This is a pretty standard approach. The following table gives the 1, 3, 5, and 10-year trailing returns for each ETF. It also shows the 3, 5, and 10-year standard deviations for each as a measure of volatility. A return per unit of risk is then calculated for each period. Finally, timeframes are blended (averaged) to smooth things out. Blended 5-year figures average the 3 and 5-year periods. Blended 10-year figures average all periods.
Risk/Return Measurements (Morningstar, Michael Thomas)
Most of the results are in the same ballpark, as can be expected with sector-specific funds. XLU holds a slight edge over VPU. RYU has had the best risk-adjusted performance of the bunch over the long term, giving equal weighting a slight edge over market cap weighting. Interestingly, active management seems to be paying off, with UTES not only providing the highest absolute returns but also the best risk-adjusted returns over the short to medium term. The additional complexity introduced in FXU's multi-factor strategy has failed to produce any long-lasting performance gains, bringing into question its high expense ratio. PUI has shown the worst performance overall and it would appear that the momentum-based strategy isn't working. To add further injury, it comes with the second-highest expense ratio and the highest portfolio turnover of any fund on the list.
Hedged Trade Opportunity
Many of the utility sector ETFs covered here are very similar in terms of holdings and performance. However, one ETF stands apart when factoring in something we haven't touched on yet. When it comes to availability and breadth of options, XLU stands alone.
Available Options (Michael Thomas)
XLU is the only utility sector ETF that offers weeklies and LEAPS options. This allows a great deal of flexibility in skewing risk-reward profiles or generating additional income through covered call writing. In my particular case, the availability of LEAPS options holds the biggest advantage as I've detailed in prior articles .
To set up a hedged position in XLU, we need to own 100 shares first. That allows for selling a covered call that in turn pays for a bear put spread in a zero-cost hedge. The bear put spread provides downside protection with no additional capital requirement outside of owning the shares. Since shares are owned, you still collect dividends. There's still the possibility of netting small premium gains as you would normally with covered call writing but it works a little differently with this strategy, first the setup.
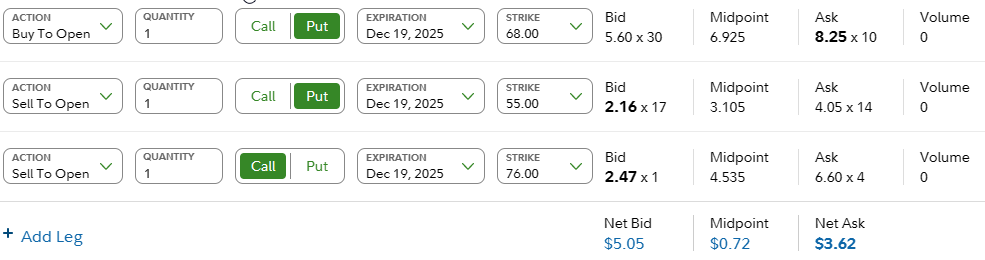
The following order is an example of setting up the position after you already own 100 shares of XLU at $68.65. It looks to sell a 76C covered call while simultaneously buying a 68P/55P put spread all at the Dec 19 2025 expiration. Note this example was produced after-market hours so spreads are much larger than they should be during market hours.
XLU LEAPS Order (Michael Thomas)
The goal is to execute the LEAPS order for a small credit. This trade provides ~23.6% downside protection through the put spread, which is our loss buffer zone from $68 to $55. Below $55 and the position starts losing money. On the upside, the maximum price appreciation is capped at 10.7%, or ~4% annualized over the next ~2.6 years. Adding in a 3% dividend yield pushes the total annualized return potential to 7%. Although variable, rolling short options and capturing net premium gains could further push the return to 7.75% annualized. This figure falls short of the average of 9.31% returns realized by XLU over the last 10 years, but it may be worth giving up 1.50% to have 20%+ downside protection in an environment unlikely to produce historically high returns. You can participate to the upside and still have positive outcomes in down years.
Real World Trade Example
To better illustrate how the LEAPS hedge works, I present a real-world example of an ongoing XLU trade I opened on 11/9/2022. I purchased 100 shares of XLU at $66.07. I then sold a 75C covered call to pay for a 66P/50P put spread for a small credit. In the following graph, the red line represents the long put that is protecting the position. The yellow line is the short put that represents the lower threshold of our loss buffer. The green line represents the price ceiling cap placed on the position by the covered call.
XLU Position Opened 11/22/22 (Michael Thomas)
I have yet to roll any short options up or down in response to changes in price or volatility as I have with other hedged positions . I have collected about $106 in dividend income in the meantime.
I chose XLU to complement the other hedged positions in my portfolio as there are a lot of higher volatility plays. My thought process was that best case I earn a decent return participating in the limited upside, while still having a high probability of earning at least bond-like returns if XLU hits a roadblock.
Takeaway
Utilities have been relatively flat over the last year or so but continue to throw off dividend income. Interest rate increases have taken a toll on the industry and future returns are likely to be muted if rates stay higher for longer. This doesn't necessarily make utilities a bad investment but it's better to have a contingency plan in place and that's where XLU holds an advantage. Having a healthy options market elevates XLU despite having ordinary performance relative to its peers. You collect your dividends and protect your capital.
For further details see:
XLU: Collect And Protect With Hedged Investing