RVT - XSHQ: Weed Out Junk From Small Cap Investing
2023-12-28 00:33:08 ET
Summary
- The S&P SmallCap 600 Index tracks the performance of US companies with market caps between $850 million and $5.2 billion.
- The S&P SmallCap 600 Quality Index is made up of the top companies from the Small Cap index screened for three criteria.
- We go over the XSHQ fund and tell you how it can help you invest better in the small cap space.
The S&P SmallCap 600 Index [Small Cap index] tracks the performance of 600 of the U.S. companies that have a market capitalization [cap] between $850 million and $5.2 billion. Typically , a market value between $250 million and $2 billion falls under the small cap umbrella, while a mid cap's market value falls between $2 billion to $10 billion. Some of this is subjective, but we can conclude that the aforementioned index straddles what is generally considered the small and mid cap universe. The market cap criteria for this index considers all outstanding shares of the company, and not just those available for general public trading ( float adjusted ). Having said that, the float adjusted market value has to be at least $425 million for the company to be part of the index. Additionally,
- At least 10% of the outstanding shares must be considered "freely tradable" ( I nvestable W eight F actor );
- The company needs to have positive earnings in the most recent quarter and cumulatively over the most recent four quarters;
- The annual dollar value traded should be at least 75% of the float adjusted market capitalization, ensuring adequate liquidity; and
- Only common equities trading on eligible U.S. exchanges and REITs are eligible for inclusion. Closed-end and exchange traded funds, and foreign companies are excluded.
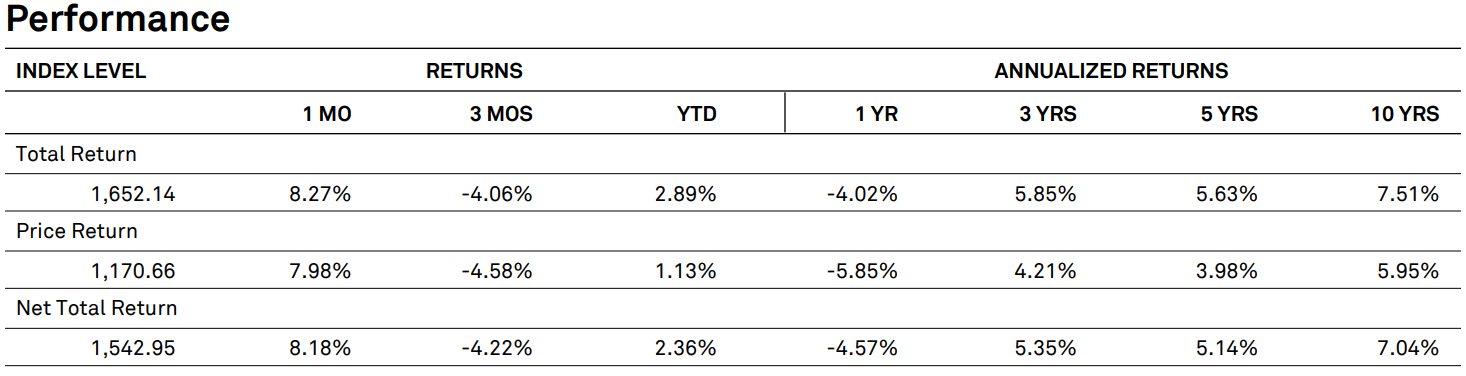
The above criteria have been paraphrased from the factsheet available on the index website . This index is rebalanced on a quarterly basis, in March, June, September and December. It was formed in December 2014 and has had positive returns in most timeframes.
The S&P SmallCap 600 Quality Index [Quality index] is made up of the around 120 of the top companies from the Small Cap index discussed above. The 600 companies from the Small Cap index are ranked based on,
- Return of equity;
- Accruals ratio and
- Financial leverage ratio.
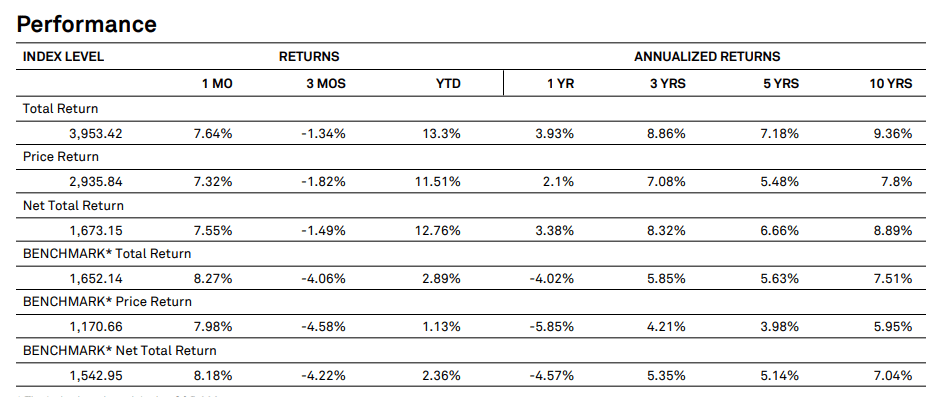
Details on each of the above computations and more can be found here . For companies originating from the financial or real estate sectors, only the first and third criteria come into play. The companies are ranked based on the average score, with the top tier (around 20% of the Small Cap index) being chosen for the Quality index. This index rebalances every June and December. Selecting the crème de la crème has worked for the Quality index and we can see that except for the month of November, it has beaten its benchmark handily over all timeframes.
The Quality Index was launched in March 2017, so the 10 year performance incudes hypothetical back tested results. For that reason, we compared the performance of the Quality index, with that of three funds that focus on small cap companies over a 5 year period (instead of 10). Invesco S&P SmallCap Quality ETF ( XSHQ ) led the trio, with the closed end fund Royce Value Trust Inc ( RVT ) coming in a close second. iShares Russell 2000 ETF ( IWM ) bought up the rear.
Speaking of RVT, we had suggested this CEF to investors looking for small cap exposure in one of our recent articles . Today however, we will talk about the leader of the above pack, and one that uses the Quality index as its benchmark.
The Fund
XSHQ is a passive ETF that pursues the performance of the Quality index. As a passive fund, it does not attempt to outperform its benchmark and just follows it as close as feasible and even rebalances at the same semi-annual intervals. The fund, unlike the index, has expenses (0.30% annually in XSHQ's case) and as a result perfect replication is not possible. While the fund reserves the right to select equities from the index using the sampling methodology, the usual course of action is to replicate the index. In order words, under normal market conditions, the ETF portfolio includes all the equities from the Quality index, on a proportionate basis. The most current data shows its portfolio comprising 121 holdings, one of which is cash.
XSHQ
The index on the other hand had 114 securities and the next rebalancing for both the fund and the index is December 31. The fund prospectus provides a few reasons for this discrepancy.
At times, the Fund may utilize one or more additional investment techniques in seeking to track the Underlying Index. Such techniques may include: (i) overweighting or underweighting a component security in the Fund’s portfolio compared to its weight in the Underlying Index, (ii) purchasing securities not contained in the Underlying Index that the Adviser believes are appropriate to substitute for certain securities in the Underlying Index, (iii) selling securities included in the Underlying Index in anticipation of their removal from the Underlying Index, or (iv) purchasing securities not included in the Underlying Index in anticipation of their addition to the Underlying Index.
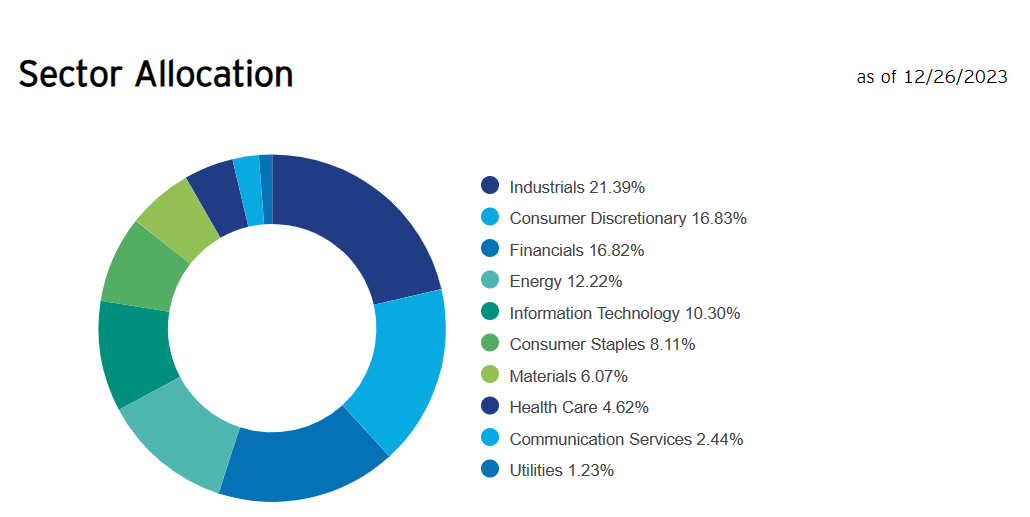
Ordinarily, XSHQ allocates at least 90% of its total assets to the index securities. In terms of sector allocations, industrials form 21.39% of the portfolio, followed by consumer discretionary and financials at around 16.8% each. Energy (12.22%) and information technology (10.30%) finish at fourth and fifth place, respectively.
Before we jumped into the details for this ETF, we spoke about its 5 year performance versus a couple of its peers, RVT and IWM. Below we show its total return on NAV during 2022, a period during which many a small cap made a trip to the micro cap land.
It was far from rosy for all three of them, but our protagonist still came out ahead by sticking with the cream of the crop. 2023 has bought about a reversal of fortunes, thankfully.
But now these are in the overbought territory and it would be foolhardy to rush in. Giving these a breather from further elevation gain, we will wait for a pullback before consideration to the small cap wonderland. On a longer term basis, this fund is a good way to weed out the junk that comes with index investing these days. And there is a lot of junk in IWM at least.
Bank Of America
While the criteria are simple, they do work and avoid the companies that are likely to drop the most in the next recession.
Please note that this is not financial advice. It may seem like it, sound like it, but surprisingly, it is not. Investors are expected to do their own due diligence and consult with a professional who knows their objectives and constraints.
For further details see:
XSHQ: Weed Out Junk From Small Cap Investing