ANDE - XSVM: Good Looking Strategy Underwhelming Performance
2023-07-25 14:58:33 ET
Summary
- Invesco S&P SmallCap Value with Momentum ETF combines 3 valuation ratios and a momentum score to pick small caps.
- It is well-diversified across sectors and holdings.
- It has not brought excess return over its parent index since 2005.
- It has lagged a number of competitors in the last 12 months.
This article series aims at evaluating ETFs (exchange-traded funds) regarding past performance and portfolio metrics. Reviews with updated data are posted when necessary.
Strategy and portfolio
Invesco S&P SmallCap Value with Momentum ETF ( XSVM ) started investing operations on 03/03/2005 and tracks the S&P 600 High Momentum Value Index. It has a portfolio of 117 stocks, a distribution yield of 1.56% and an expense ratio of 0.36%. Distributions are paid quarterly.
As described in the prospectus by Invesco , stocks in the parent index S&P 600 are given a value score based on three ratios: book-value-to-price, earnings-to-price, and sales-to-price. Then, a momentum score is given to the 240 stocks with the highest value score. It is calculated from the 12-month return excluding the most recent month. The 120 stocks with the highest momentum score are included in the S&P 600 High Momentum Value Index and weighted based on their value score. The index is reconstituted and rebalanced twice a year.
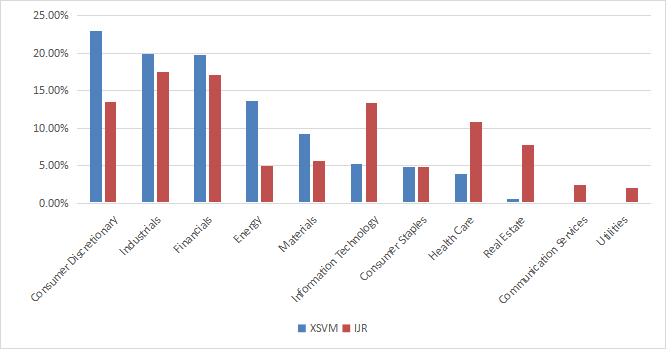
The portfolio is exclusively invested in U.S. companies. The heaviest sectors are consumer discretionary (22.9%), financials (20%) and industrials (19.8%). Other sectors are under 14%. Compared to the parent index S&P 600, represented hereafter by iShares Core S&P Small-Cap ETF ( IJR ), XSVM massively overweights consumer discretionary and energy. It underweights mostly healthcare, technology, real estate, and ignores utilities and communication services.
XSVM sector breakdown (chart: author; data: Fidelity, iShares)
Aggregate valuation ratios are much cheaper than for the parent index, as reported in next table. The difference in price/sales is especially impressive.
| XSVM |
| IJR |
| Price/Earnings TTM |
| 6.13 |
| 12.51 |
| Price/Book |
| 1.11 |
| 1.66 |
| Price/Sales |
| 0.29 |
| 0.89 |
| Price/Cash Flow |
| 4.42 |
| 8.6 |
Source: Fidelity.
The top 10 holdings represent 13.9% of assets. The next table lists their weights and valuation ratios. The largest position is below 2%, so risks related to individual companies are very low.
| Ticker |
| Name |
| Weight% |
| P/E ttm |
| P/E fwd |
| P/Sales |
| P/Book |
| P/FCF |
| Yield |
| Par Pacific Holdings, Inc. |
| 1.77 |
| 2.49 |
| 5.78 |
| 0.24 |
| 2.10 |
| 2.59 |
| 0 |
| Vital Energy, Inc. |
| 1.52 |
| 1.05 |
| 3.02 |
| 0.50 |
| 0.70 |
| 4.93 |
| 0 |
| Caleres, Inc. |
| 1.46 |
| 5.85 |
| 6.44 |
| 0.32 |
| 2.05 |
| 12.25 |
| 1.05 |
| American Axle & Manufacturing Holdings, Inc. |
| 1.39 |
| 19.62 |
| 24.34 |
| 0.19 |
| 1.74 |
| 4.86 |
| 0 |
| The Andersons, Inc. |
| 1.35 |
| 15.07 |
| 21.78 |
| 0.09 |
| 1.39 |
| 1.90 |
| 1.53 |
| Olympic Steel, Inc. |
| 1.32 |
| 9.79 |
| 16.03 |
| 0.26 |
| 1.19 |
| 3.28 |
| 0.93 |
| StoneX Group, Inc. |
| 1.30 |
| 8.72 |
| 8.78 |
| 0.03 |
| 1.50 |
| N/A |
| 0 |
| World Kinect Corp. |
| 1.29 |
| 13.13 |
| 11.49 |
| 0.02 |
| 0.73 |
| 18.46 |
| 2.41 |
| M/I Homes, Inc. |
| 1.25 |
| 5.24 |
| 7.40 |
| 0.62 |
| 1.21 |
| 7.40 |
| 0 |
| CVR Energy, Inc. |
| 1.24 |
| 6.23 |
| 8.49 |
| 0.33 |
| 5.22 |
| 23.63 |
| 5.71 |
Ratios: Portfolio123.
Historical performance
Since 4/1/2005, XSVM has slightly underperformed IJR. However, the difference in annualized return is not significant (39 bps). It is also a little bit riskier regarding drawdown and volatility (standard deviation of monthly returns).
| Total Return |
| Annual.Return |
| Drawdown |
| Sharpe ratio |
| Volatility |
| XSVM |
| 363.35% |
| 8.73% |
| -62.57% |
| 0.43 |
| 22.28% |
| IJR |
| 396.29% |
| 9.14% |
| -58.15% |
| 0.49 |
| 19.68% |
Data calculated with Portfolio123.
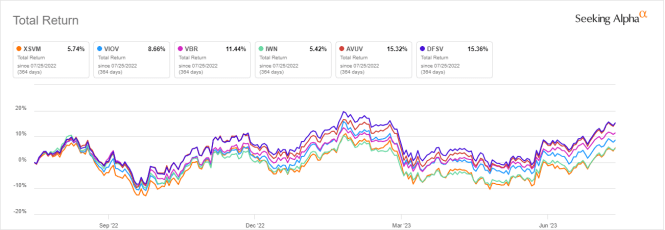
The next chart compares the 12-month total returns of XSVM and five other small cap value funds:
- Vanguard S&P SmallCap 600 Value ETF ( VIOV ). reviewed here ,
- Vanguard Small Cap Value ETF ( VBR ), reviewed here ,
- iShares Russell 2000 Value ETF ( IWN ), reviewed here ,
- Avantis U.S. Small Cap Value ETF ( AVUV ), reviewed here ,
- Dimensional US Small Cap Value ETF ( DFSV ).
The two actively managed ETFs, AVUV and DFSV, are leading the pack. XSVM is second to last, almost on par with IWN.
Compari son with my Dashboard List model
The Dashboard List is a list of 80 stocks in the S&P 1500 index, updated every month based on a simple quantitative methodology. All stocks in the Dashboard List are cheaper than their respective industry median in Price/Earnings, Price/Sales and Price/Free Cash Flow. After this filter, the 10 companies with the highest Return on Equity in every sector are kept in the list. Some sectors are grouped together: energy with materials, communication with technology. Real estate is excluded because these valuation metrics don't work well in this sector. I have been updating the Dashboard List every month on Seeking Alpha since December 2015, first in free-access articles, then in Quantitative Risk & Value.
The next table compares XSVM performance since 4/1/2005 with the Dashboard List model, with a tweak: the list is reconstituted once a year to make it comparable with a passive index.
| Total Return |
| Annual.Return |
| Drawdown |
| Sharpe ratio |
| Volatility |
| XSVM |
| 363.35% |
| 8.73% |
| -62.57% |
| 0.43 |
| 22.28% |
| Dashboard List |
| 566.57% |
| 10.91% |
| -55.88% |
| 0.58 |
| 18.76% |
Past performance is not a guarantee of future returns. Data Source: Portfolio123.
The Dashboard List outperforms XSVM by 2.2% in annualized return and shows a lower risk measured in drawdown and volatility. However, ETF performance is real and the model simulation is hypothetical.
Price to Book: a risky concept of value
I like the idea of mixing various ratios to rank value stocks. However, I think most value indexes doing so have two weaknesses, and XSVM is no exception. The first one is to classify all stocks on the same criteria. It means the valuation ratios are considered comparable across sectors. Obviously, they are not: my monthly dashboard here shows how valuation and quality metrics may vary across sectors.
The second weakness comes from the price/book ratio (P/B), which adds some risk in the strategy. Historical data show that a large group of companies with low P/B has a higher volatility and deeper drawdowns than a same-size group with low price/earnings, price/sales or price/free cash flow. The next table shows the return and risk metrics of the cheapest quarter of the S&P 500 (i.e.125 stocks) measured in price/book, price/earnings, price/sales and price/free cash flow. The sets are reconstituted annually between 1/1/2000 and 1/1/2023 with elements in equal weight.
| Annual.Return |
| Drawdown |
| Sharpe ratio |
| Volatility |
| Cheapest quarter in P/B |
| 8.54% |
| -81.55% |
| 0.35 |
| 37.06% |
| Cheapest quarter in P/E |
| 10.71% |
| -73.62% |
| 0.48 |
| 25.01% |
| Cheapest quarter in P/S |
| 12.82% |
| -76.16% |
| 0.47 |
| 34.83% |
| Cheapest quarter in P/FCF |
| 15.32% |
| -74.77% |
| 0.61 |
| 27.03% |
Data calculated with Portfolio123.
This explains why I use P/FCF and not P/B in the Dashboard List model.
Takeaway
Invesco S&P SmallCap Value with Momentum ETF implements a strategy combining 3 valuation ratios and a momentum score. The fund is well-diversified across sectors and holdings. Valuation is attractive, but performance is underwhelming. The fund has slightly underperformed its parent index S&P 600 since 2005, and it has been lagging most of its peers in the last 12 months. It may be an interesting instrument for swing trading or tactical allocation, but it has failed at bringing excess return or risk reduction relative to its parent index in the long run. Like most value ETFs, it has two shortcomings: ranking stocks regardless of their industries, and relying too much on the price/book ratio.
For further details see:
XSVM: Good Looking Strategy, Underwhelming Performance