YYY - YYY: Too Many Factors Working Against This Income ETF
2024-01-09 01:32:57 ET
Summary
- Amplify High Income ETF warrants a sell rating due to declining share price, high expense ratio, and negative dividend growth rate.
- YYY consists of 79% bonds and 21% stocks, with holdings in U.S.-based closed-end funds.
- An alternative fixed-income fund, JPMorgan Equity Premium Income ETF, is preferred over YYY due to more favorable characteristics.
Investment Thesis
Amplify High Income ETF ( YYY ) warrants a sell rating due to multiple negative factors working against the fund. While YYY offers a high dividend yield as part of its income strategy, the ETF has seen a consistent decline in its share price. Additionally, YYY's very high expense ratio and negative dividend growth rate are also undesirable for income investors. Finally, the ETF has several holdings that have red flags indicating further trouble for the fund looking ahead. As an alternative, I prefer JEPI over YYY as a more favorable fixed-income fund.
Fund Overview and Compared ETFs
YYY is an ETF that seeks to provide monthly income by purchasing closed-end funds, or CEFs, below net asset value. The fund consists of 79% bonds (predominantly multisector bond funds), and 21% stocks. The CEFs that YYY includes are U.S.-based with a minimum of $500M in market capitalization. With an inception in 2013, the fund has 44 holdings and $407.8M in AUM. Other income-focused ETFs used for comparison purposes are JPMorgan Equity Premium Income ETF ( JEPI ), Invesco CEF Income Composite ETF ( PCEF ), and First Trust Income Opportunity ETF ( FCEF ).
YYY has multiple similarities to PCEF and FCEF. PCEF uses closed-end funds , similarly to YYY, to provide an investor with income. The ETF is predominantly made up of option income (41.98%) and high yield bonds (26.09%). FCEF is another peer ETF that seeks to provide current income with a secondary goal of also achieving a favorable total return. The fund utilizes closed-end investment companies and ETFs. It consists predominantly of equity CEFs (59.51%) and taxable, fixed income CEFs (28.52%).
JEPI, as opposed to YYY, PCEF, and FCEF does not use CEFs. With its inception in 2020, JEPI is heaviest on information technology and financial holdings. It also produces income through ELNs , or equity-linked notes. These are listed in its holdings as "SPX" followed by a number. ELNs combine the benefits of a zero-coupon bond and a call option. Effectively, the principal value is protected, and it is linked to the value of the equity. Therefore, if the equity appreciates, the ELN value also goes up. If the value declines, at least the principal value can be recovered. This has resulted in JEPI's consistent income and popularity over the past couple of years.
Performance, Expense Ratio, and Dividend Yield
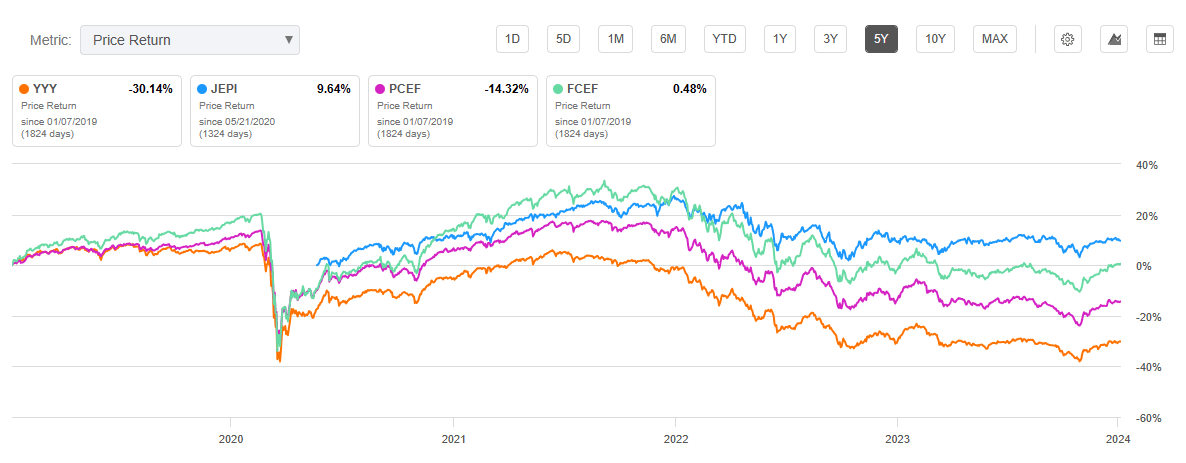
YYY has an annualized 10-year CAGR of 2.64%. This is lower than PCEF's 10-year CAGR of 5.41%, FCEF's 5-year CAGR of 7.03%, and JEPI's 3-year CAGR of 8.83%. By comparison, all these funds have a lower CAGR than the S&P 500 index's 10-year CAGR of 12.03%. In addition to a poor share price return, the expense ratio for YYY stands at a staggering 2.72%. While this is dramatically higher than JEPI's 0.35% expense ratio, it is on par with the other closed-end investment ETFs: PCEF (3.08% expense ratio) and FCEF (3.29% expense ratio).
5 Year Total Price Return: YYY and Compared Income ETFs (Seeking Alpha)
A high dividend yield is the primary attractive factor for income-focused ETFs. The dividend yield for YYY is at an enticing 12.28%. However, this high yield is one of the few advantages for the fund as we will continue to discuss in this article. Despite a yield over 12%, the dividend benefit has reduced slightly as YYY has a 3-year dividend CAGR of -2.63%. In contrast, JEPI's yield has generally been increasing with a 3-year CAGR of 12.66%.
Expense Ratio, AUM, and Dividend Yield Comparison
| YYY |
| JEPI |
| PCEF |
| FCEF |
| Expense Ratio |
| 2.72% |
| 0.35% |
| 3.08% |
| 3.29% |
| AUM |
| $408.70M |
| $30.53B |
| $715.33M |
| $27.79M |
| Dividend Yield TTM |
| 12.28% |
| 8.44% |
| 9.83% |
| 7.17% |
| Dividend Growth 3 YR CAGR |
| -2.63% |
| 12.66% |
| 1.52% |
| 7.77% |
Source: Seeking Alpha, 7 Jan 24
YYY Holdings and Its Competitive Advantage
The holdings for YYY are significantly different to compared ETFs. As discussed, JEPI has predominantly information technology and financial sector holdings, in addition to equity-linked notes. In contrast, YYY, like PCEF and FCEF, includes high-yielding bond funds.
Top 10 Holdings for YYY and others
| YYY - 44 holdings |
| JEPI - 131 holdings |
| PCEF - 111 holdings |
| FCEF |
| OXLC - 3.78% |
| MSFT - 1.62% |
| EXG - 3.95% |
| ETG - 3.94% |
| ECC - 3.72% |
| AMZN - 1.60% |
| JPC - 3.72% |
| THQ - 3.58% |
| PDI - 3.50% |
| PGR - 1.58% |
| BIGZ - 2.83% |
| ARDC - 3.54% |
| VVR - 3.34% |
| TT - 1.58% |
| BMEZ - 2.79% |
| VRIG - 3.45% |
| PDO - 3.23% |
| INTU - 1.54% |
| ECAT - 2.72% |
| BIL - 3.45% |
| PAXS - 3.20% |
| MA - 1.51% |
| ETY - 2.70% |
| HTD - 3.36% |
| JPC - 3.11% |
| ABBV - 1.48% |
| BDJ - 2.41% |
| ASGI - 3.24% |
| WDI - 3.07% |
| V - 1.46% |
| BSTZ - 2.35% |
| EVT - 3.24% |
| EVV - 3.06% |
| ACN - 1.46% |
| BXMX - 2.16% |
| ETO - 3.21% |
| GHY - 3.05% |
| ADBE - 1.42% |
| NFJ - 2.09% |
| HQH - 3.14% |
Source: Multiple, compiled by author on 7 Jan 24
All ETFs investors know that an ETF's future returns are tied to the performance of its individual holdings. YYY is no exception and has multiple holdings that present red flags for me. The first is YYY's top holding Oxford Lane Capital ( OXLC ). The second concerning holding is the PIMCO Dynamic Income Fund ( PDI ). Finally, Nuveen Preferred & Income Opportunities Fund ( JPC ) has warning signs. Each of these are further discussed below.
OXLC - Significant Share Price Decline and High Expense Ratio
The first difference is OXLC. YYY is the only compared ETF that has OXLC within its top 10 holdings. It is the heaviest holding for YYY at 3.78% weight. OXLC is a taxable bond with a 12.45% expense ratio. The fund utilizes somewhat riskier assets including collateralized loan obligations. While it offers an 18.97% forward dividend yield, OXLC has a 10-year total price return of -71.04%. For reference, the S&P 500 Index saw a total return of 154.9% for the same period. Due to its strong decline in share price as well as its high expense ratio, this holding represents the first red flag for YYY overall.
PDI - High Dividend Payout Ratio
The second difference is PDI. This is another U.S.-based closed-end management investment company. PDI is YYY's #3 holding with a weight of 3.50%. PDI has a 5-year total return of -36.26% and a forward dividend yield of 14.33%. While not as high as OXLC, PDI's expense ratio is 2.18%. Most alarming, as of June 2023, the fund has a dividend payout ratio of 394%. While a high dividend payout ratio is necessary for a high dividend yield for income seekers, a payout ratio this high raises concerns about its sustainability.
JPC - Declining Dividend Growth and Capital Depreciation
The third difference is JPC. This is another top 10 holding for YYY with a weight of 3.11%. JPC has seen a 10-year total return of -24.17% and a forward dividend yield of 8.33%. Despite this strong dividend yield, JPC has a 5-year dividend growth rate of -6.39%. As with PDI, a declining dividend yield usually also results in a reduced share price. This has been seen with JPC and I suspect the trend will continue looking forward.
Valuation and Risks to Investors
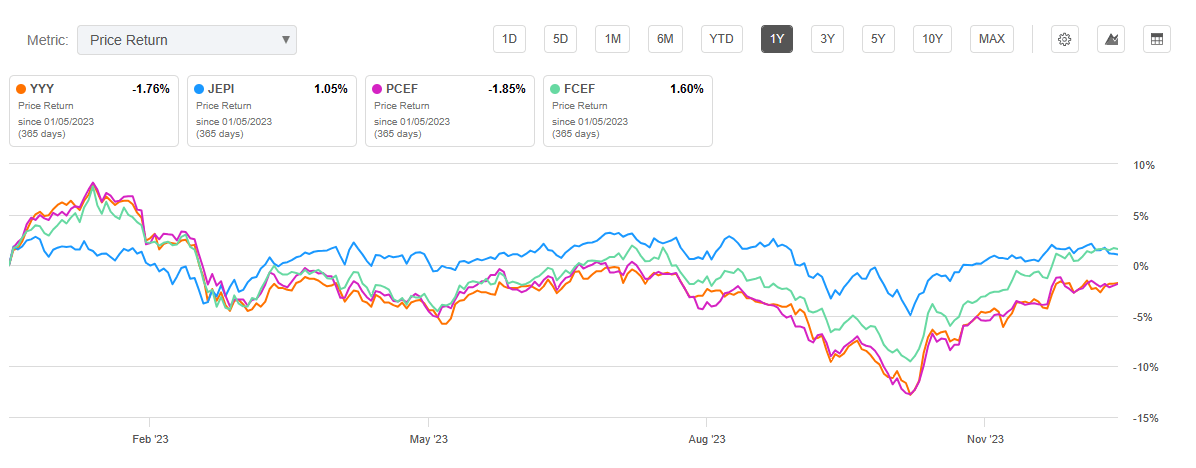
YYY has a current price of $11.73 at the time of writing this article. This falls roughly in the middle of the fund's 52-week price range of $10.37 to $12.92 and below its all-time high of $24.52 seen back in July 2014. The fund has progressively been decreasing in price since 2014. Over the past year, this has been no different with YYY seeing a -1.76% price return. Comparatively, JEPI has seen a positive return in addition to its increasing dividend yield and lower expense ratio.
One Year Price Return: YYY and Compared Income ETFs (Seeking Alpha)
The primary risk factor for YYY, as well as compared peer ETFs, is a reduction in dividend yield. This is not only a negative sign for income-seeking investors but typically results in a decline in share price. Because of the red flags of multiple of YYY's holdings, I expect its dividend yield to decline in the coming year. Such a dividend reduction will result in a reduced share price presenting a dual problem for YYY's investors.
Because of their structure, including the incorporation of bonds, income ETFs examined all have a reduced correlation to "the market" overall. This is indicated in their beta values which are less than 1.0. For example, FCEF has a beta value of 0.84 compared to the Russell 3000 Index. YYY also has a beta value of 0.82. JEPI, with its inclusion of equity-linked notes, has the lowest beta value of 0.8 compared to the S&P 500 index.
Concluding Summary
YYY is an income fund that has multiple red flags driving a sell rating for me. While it currently has a high dividend yield, it has several holdings that will likely weigh down the fund looking forward. This may result in a cut to the overall dividend yield for YYY, and subsequently its share price. Historically, YYY has been an underperformer with a high expense ratio in comparison to its peers. For income-seeking ETFs, I prefer JPMorgan's JEPI which has more stable holdings, a significantly lower expense ratio, and has even demonstrated a history of increasing share price.
For further details see:
YYY: Too Many Factors Working Against This Income ETF