TEAF - ZTR: Analyzing What Happened Yesterday Down ~10%
- ZTR is a multi-asset closed end fund that follows a 60/40 equity - fixed income allocation.
- The CEF was down almost 10% yesterday on the back of calm equities and bond markets.
- Our analysis goes through all the factors that could have been responsible for this move and provides a "house view" based on the results.
- This article covers CEFs from our suite of products - we focus on CEFs, yield-generating options strategies, and macro portfolio allocation, targeting overall yearly portfolio returns of 9%+.
Thesis
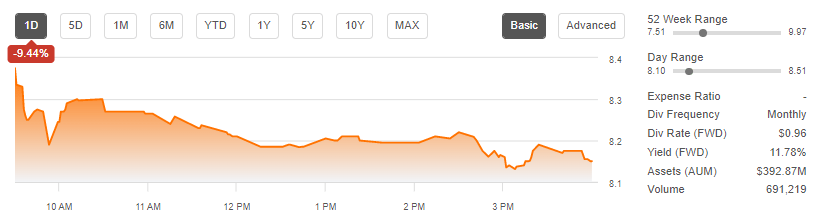
Virtus Total Return Fund Inc. ( ZTR ) is a multi-asset closed-end fund ("CEF") that follows a 60/40 equity - fixed income allocation. The Fund's investment objective is capital appreciation, with current income as a secondary objective. ZTR was down almost 10% yesterday on the back of a generally flat market:
Investors who look at 60/40 CEFs usually expect a dampened overall volatility, with these types of moves seen for the year, not the day! So, what happened?
Firstly, if we look at the volume yesterday, we notice it was 691k versus an average volume of only 123k for this name in the past year. So a volume 5.6x the normal one. Did the indices move a lot? Let us have a look:
Index Move (Seeking Alpha)
Not the equities markets. All of the major indices are fairly flat. The bond markets were well-behaved as well, with the yield curve down approximately 5-6 bps across tenor points. So, nothing in the general market can explain any of the ZTR moves. Maybe a name in the ZTR portfolio that had a high concentration collapsed yesterday. Let us have a look:
A graph of the ZTR NAV shows a steady, upward sloping performance. So nothing here, the fund was fairly flat on the day from a daily assets pricing perspective. So what else can we look at? Given it is a CEF structure, the last thing we can check to understand what happened is the premium to NAV:
Finally, we have something! When graphing the premium to NAV for ZTR, we can see a total collapse yesterday. An unfathomable move from an 8% premium to a -3.44% discount.
If we take a look at a 1-year look-back period in order to assess yesterday's move, we get the following:
Max move: 3.3%
Min move: -5.52%
The biggest drop for this fund in the past year occurred on June 13, 2022, when the CEF dropped -5.52% on the back of the general market risk-off environment. We can see from the above graph that the premium to NAV also dropped on that day, but nothing as dramatic as 9%! If we look at the general market, on June 13 the S&P 500 dropped more than -3%, so in that context, the ZTR move is warranted. Yesterday's move is not.
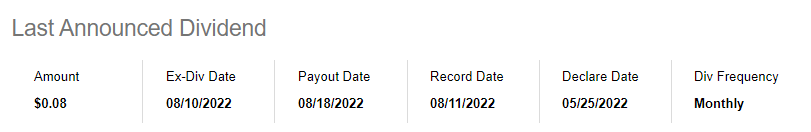
One last analytic we are going to quickly visit is the effect of the "ex-date" - i.e., many CEFs with high yields tend to see a NAV/market price decrease equivalent to the paid cash on the ex-date:
We can see from the above, courtesy of Seeking Alpha, that the Ex-div date is tomorrow, August 10, not yesterday, August 8.
So, what happened then?
Given all the analysis above, everything points to institutional investors' flow and a large position liquidation. The fund NAV was flat, but the traded volume was 5x higher than normal. That is the beauty of the CEF structure versus an exchange-traded fund ("ETF"). An ETF actually buys and sells assets throughout the day to match and redeem shares, hence there is very little basis between the NAV and market price of the vehicle. On the other hand, on the CEF side, unless the manager chooses to redeem shares or liquidate the vehicle, the shares can trade at any market price versus the underlying assets.
This is what we saw yesterday - what we presume is an institutional investor who chose to liquidate and moved the market significantly. Why would anybody do that, you would ask. You would be surprised how the financial industry sometimes works - just ask Citi, which is currently being sued by Loomis over a similar type of issue - late-day selling in size of a handful of names that moved the market.
What should an investor do? Well, let us have a look at the premium/discount to NAV in the past year:
We can see that the fund has traded flat to NAV or at premiums to NAV. To us, this is a great opportunity to take advantage of a market dislocation caused by what we presume is institutional investor flow to get the fund at a deep discount to NAV. We believe we might still see weakness in the overall market in the next few months, but ZTR will revert to trading at a slight premium to NAV, so there is a 4%-5% to be made here. A long-term buy-and-hold retail investor should buy here.
Holdings
The fund has an Equity and a Fixed Income allocation that follow roughly the 60/40 rule. On the Equity side, the fund shapes up as follows:
Equity Allocation (Fund Fact Sheet)
Very similarly to the DNP fund, the manager allocates a very high percentage of the equity allocation to the "Utilities" sub-sector. In terms of individual names, the top holdings of the fund currently shape up as follows:
Top Holdings (Fund Fact Sheet)
On the Fixed Income side, the fund has a very balanced mixed allocation:
Sector Split (Fund Fact Sheet)
We can see that the mix contains fairly balanced allocations to High Yield, Investment Grade, Floating Bank Loans, Non-agency RMBS and Treasuries. The main risk factors here are rates and high yield spreads.
The fund runs an overall balanced, one can even say conservative portfolio. The leverage ratio for the fund is 28%, so nothing excessive for the CEF space.
Conclusion
ZTR is a 60/40 equities/fixed income closed end fund. The vehicle does not expose extreme volatility, exhibiting a max move down of only -5.52% in the past year when yesterday is excluded. That max move of -5.52% occurred on the back of a significant overall market sell-off while yesterday's market saw all indices fairly flat on the day. Our analysis points to an abnormal volume yesterday (more than 5x the norm) that moved the fund from a rough 8% premium to NAV to a discount to NAV. We can see that in the past year, the CEF has usually traded flat to a premium to NAV. We feel yesterday's move caused by institutional flows represents a good entry point at a good discount to NAV for this fund.
For further details see:
ZTR: Analyzing What Happened Yesterday, Down ~10%