VTI - 'Higher For Longer'? Don't Trust The Fed
2023-10-21 09:00:00 ET
Summary
- The Fed is projecting "higher for longer" interest rates.
- We think that they are simply managing expectations.
- We explain why we think that interest rates are likely to return lower.
Co-produced by Austin Rogers.
Federal Reserve officials are out in force, giving public statements and speeches that bolster the Fed's narrative of "higher for longer" interest rates.
Here are some recent examples:
- Michelle Bowman (voting member of the FOMC): “Inflation is still too high, and I expect it will likely be appropriate for the Committee to raise rates further and hold them at a restrictive level for some time to return inflation to our 2 percent goal in a timely way."
- Susan Collins (President of Federal Reserve Bank of Boston): “I expect rates may have to stay higher, and for longer, than previous projections had suggested, and further tightening is certainly not off the table. Policymakers will stay the course to achieve the Fed’s mandate.”
- Mary Daly (President of the Federal Reserve Bank of San Francisco): “We will not be satisfied that we are where we need to be until we're confident that (inflation is) on the path back to price stability."
In other words, despite evidence that a recession is still likely coming , the consumer is weakening, and inflation has already been tamed, the Fed remains gung ho about rate hikes and may do another one this year. According to Fed officials, investors should not expect the Federal Funds Rate ("FFR") to begin coming down anytime soon. And even when rates eventually do start coming down, it will be a gradual, multi-year process.
At least, that's what the Fed is saying.
But how reliable is what the Fed says it is going to do in the future?
Answer: Not very.
Over the years, the Fed has proven itself to be something of an unreliable narrator. This refers to the literary concept where the narrator (typically omniscient and objective in storytelling) intentionally withholds vital information or manipulates the reader/audience to believe something that isn't true.
You have to understand that the Fed's "forward guidance" (what they say or suggest they are going to do in the future) is one of the tools they use to influence or manipulate market actors.
To quote an article by our macro analyst Austin Rogers:
The market and consumers react to what the Fed says they are going to do, and then the Fed has less work to do with, well, actual monetary policy like adjusting interest rates.
The funny thing is that the market usually falls for it. I'm reminded of an adult doing a silly, simple magic trick for a little kid over and over again. The kid is stunned by it every time, as if each iteration was the first time they'd seen it.
But don't take it from us. This has been explained by Fed officials themselves.
To quote former Fed Chairman Ben Bernanke (emphasis added):
When I was at the Federal Reserve, I occasionally observed that monetary policy is 98 percent talk and only two percent action . The ability to shape market expectations of future policy through public statements is one of the most powerful tools the Fed has.
Expounding on this, here's Bernanke from a 2013 speech :
The public’s expectations about future monetary policy actions matter today because those expectations have important effects on current financial conditions, which in turn affect output, employment, and inflation over time. For example, because investors can choose freely between holding a longer-term security or rolling over a sequence of short-term securities, longer-term interest rates today are closely linked to market participants’ expectations of how short-term rates will evolve. If monetary policymakers are expected to keep short-term interest rates low, then current longer-term interest rates are likely to be low as well, all else being equal. In short, for monetary policy, expectations matter. Indeed, expectations matter so much that a central bank may be able to help make policy more effective by working to shape those expectations.
It seems likely to us that the Fed's hawkish "higher for longer" narrative is mostly a use of forward guidance -- an attempt to cool consumer spending and cause long-term interest rates to rise. This is in service to the Fed's mandate to sustainably return inflation to 2%.
Below, we will demonstrate how poor the Fed is at predicting its own future policy actions and how rarely its forward guidance is actually borne out.
Historical Accuracy of the Dot Plot
It's crucial to remember that, as pointed out five years ago by Sean Hanlon in Forbes , "the Fed's crystal ball is a little hazy."
Writes Hanlon:
Fed-watchers wait anxiously for the dot plot charts to be issued each quarter. We tend to think of the Fed as being omnipotent and omniscient. But how all-knowing are they actually? How good are they at predicting the future path for the rates they control and set? Not very good at all it seems.
This can be demonstrated perhaps best by comparing the Fed's "dot plot" (future projections of the level of the Fed Funds Rate given by each voting member of the FOMC) to the actual course of the FFR over time.
There is the rather obvious case where the Fed dot plot showed the policy rate staying flat or going higher in 2020 from 2019 levels. We all know how that turned out.
But of course, the Fed did not predict the black swan event of COVID-19. No one did. Thus, we will overlook the sharp 180 the Fed did in dropping the overnight rate to zero in 2020 as an outlier.
The problem is that 2020 was not an outlier in terms of the inaccuracy of the FOMC dot plot. Here's a helpful chart showing the dot plot average projections against the actual Fed Funds Rate over the last decade or so.
Bloomberg, Federal Reserve
From 2014 through 2019, the Fed consistently projected in their dot plots that the FFR would rise much faster than it actually did.
In 2022, the Fed insisted that inflation was transitory and manageable (largely because they were looking at lagging data) and were therefore slow to respond to current inflation with rate hikes. For a long while from late 2021 through most of 2022, their dot plots showed only a gradual rise in the FFR over the course of a few years.
And then, once inflation finally showed up in the CPI and PCE data (again, because of the lag in shelter inflation), the Fed actually hiked rates much faster than they previously said they would.
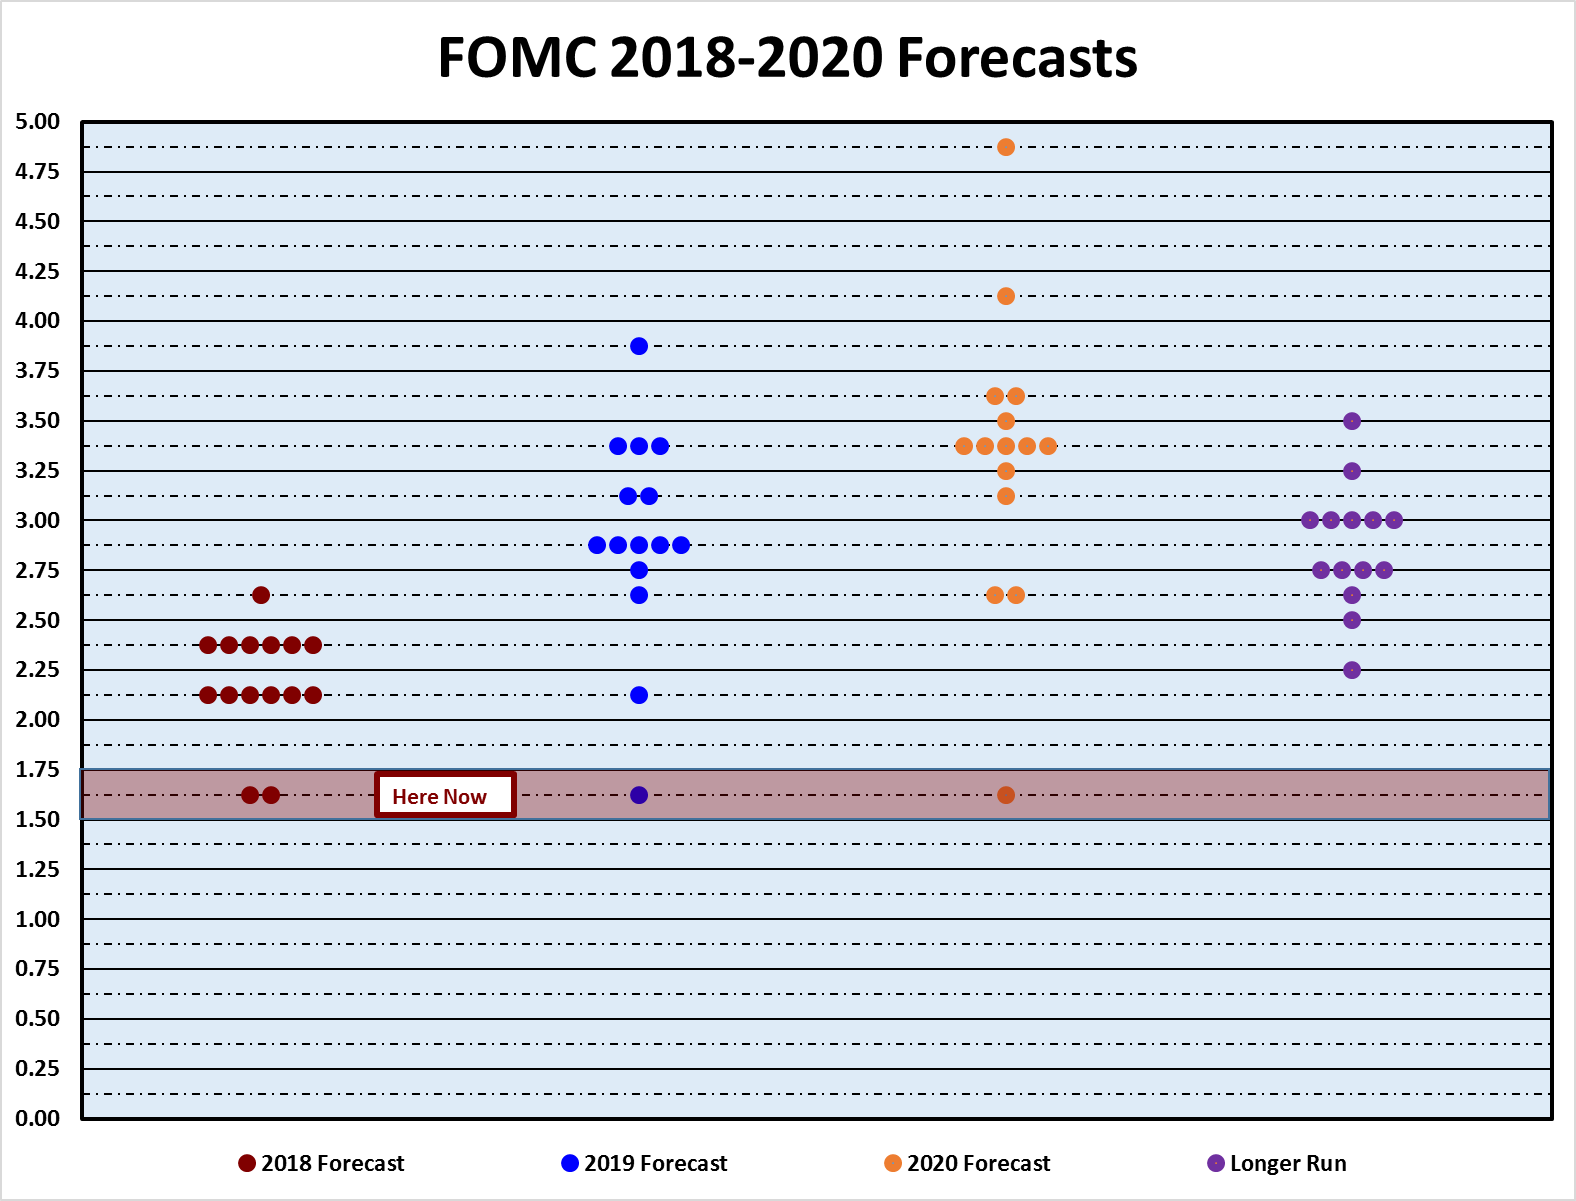
Today, Fed officials are repeating the hawkish "higher for longer" narrative over and over again, and the dot plot shows the average projected FFR coming down only slightly to the low 5% area in 2024.
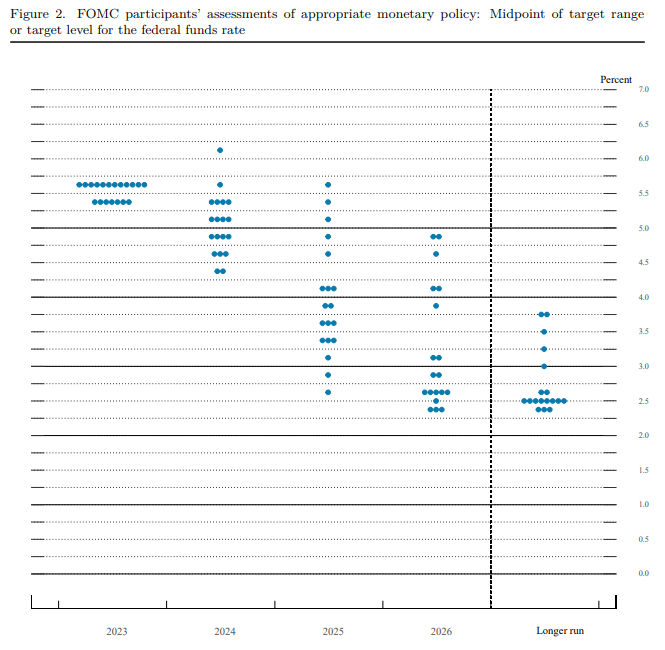
The dot plot then shows the FFR gradually declining to about 3.5% in 2025, the high 2% territory in 2026, and settling at the long-term target rate of 2.5% thereafter.
But has there ever been a period in modern history when the FFR has slowly and gradually come back down to the Fed's long-term target rate?
No.
Has there ever been a period in modern history in which a sharp rise in the FFR did not lead to a recession?
No.
Has there ever been a recession in modern history that did not at least temporarily result in a sharp drop in the FFR?
No.
See for yourself:
YCHARTS
Even in the secular inflation decades from the 1960s to the early 1980s, sharp increases in the FFR led to recessions, which then led to sharp drops in the FFR.
The only long periods of time during which the FFR has remained stable has been once they hit the "zero lower bound."
Always remember the famous line from Sir John Templeton: "The most dangerous words in investing are, 'This time it's different.'"
Yes, the once-in-a-century COVID-19 pandemic was different and unique. But so was the Great Recession / Financial Crisis of 2008-2009. So also was the tech bubble and ensuing recession of 2000-2001. So also was the savings & loan crisis of the 1980s and early 1990s. So also was the oil embargo and stagflation of the 1970s.
Every time, the specific circumstances are different. But the results in terms of the pattern of interest rates are not different.
The Fed has quite a long history of confidently projecting their future rate decisions out several years. And they have a long history of ultimately proving their own stated plans wrong.
2-Year Treasury Yield: Most Accurate Predictor of Fed Rate Movements
The bond market ( LQD ) has a better record of predicting future Fed rate movements. Specifically, the 2-year Treasury (US2Y) interest rate does a very good job of forecasting Fed rate changes over the next 6 months or so.
For example, the 2-year Treasury yield began rising about 6 months before the Fed began hiking in early 2022.
YCHARTS
Admittedly, the 2-year doesn't have a perfect track record. In the Spring of this year, the 2-year dipped, indicating that the bond market expected the Fed to pause rate hikes indefinitely. And the Fed did pause... for one meeting. The 2-year jumped back up as it became clear that the Fed was going to do at least one more hike.
Today, the 2-year climbed to its highest level since the 2000s, but it still remains below the FFR.
Historically, this inversion of the 2-year yield and FFR is another recession indicator, like the inverted 10-year / 2-year Treasury yield curve.
YCHARTS
For as long as the 2-year Treasury rate stays above the FFR during rate-hiking cycles, the bond market is predicting that the Fed will hike further. But when the FFR rises above the 2-year yield, the bond market is signaling that Fed rate hikes will pause soon and go lower in the near future.
Today's situation in which the 2-year is rising but remains below the FFR isn't totally unprecedented. Before the 2008 recession, the 2-year was rangebound for a little while and saw a few spikes even as it remained below the FFR.
In fact, in mid-2007, the decline in the 2-year Treasury yield barely front-ran the beginning of FFR cuts at all.
YCHARTS
The bottom line here is that while Fed officials are confidently asserting "higher for longer," the bond market disagrees. The 2-year Treasury yield indicates that rate cuts will begin soon.
And as we saw above, in virtually every case throughout modern history, once the Fed begins cutting the FFR, the drop is sharp and steep, not slow and gradual.
Bottom Line
The Fed appears to be using forward guidance as a monetary policy tool right now. The intended effect is to alter the market's expectations so that consumers pull back on spending, long-term interest rates rise, and, ultimately, inflation sustainably falls to the Fed's 2% long-term target.
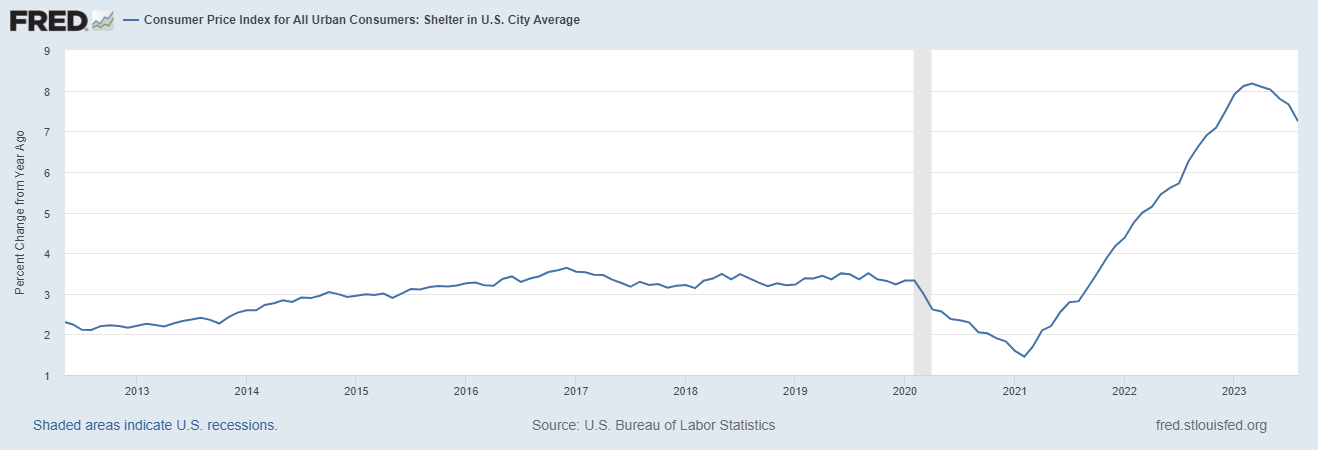
But as we have explained previously, the shelter component of core inflation metrics (which exclude food and energy) makes up about 40% of the index and lags real-time changes in home prices by about 12 months.
To give you an example, in August, shelter CPI still showed a YoY gain of 7.25%, compared to Apartment List's YoY change in rent rates of -1.2% and the National Association of Realtors' YoY change in home prices of 0.7%.
YoY CPI - Shelter Inflation:
As each month's data reflects the changes in housing costs the year prior, it will continue to show lower and lower readings each month, exerting downward pressure on the headline and (especially) core inflation metrics.
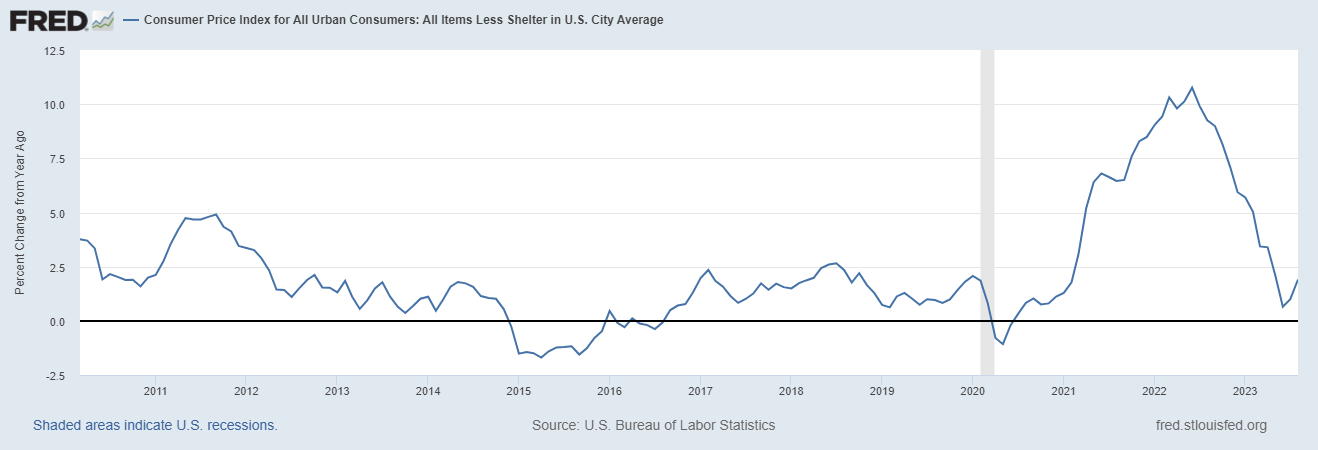
What is the headline CPI inflation rate if you exclude shelter? As of August 2023, it's 1.9%.
YoY CPI - Ex-Shelter:
Sure, this inflation measurement has rebounded off of its June 2023 low of 0.7%, but that is almost entirely due to rising oil prices. The Fed's preferred inflation metric of core PCE excludes the volatile oil price.
Inflation has already been tamed. Now it's just a matter of time before the data proves it.
We believe the two charts above will prove to be far more prescient about the future path of the FFR than anything Fed officials are saying right now.
We also believe interest rates across the curve will fall much sooner, faster, and further than the market currently thinks.
We think that the market, like the kid amazed by a silly magic trick for the 15th time in a row, is buying the Fed's "higher for longer" narrative hook, line, and sinker. As a result, the market is doing exactly what the Fed's forward guidance tool is intended to do. This is especially true for rate-sensitive sectors like REITs ( VNQ ) and Utilities ( XLU ), which now offer exceptional opportunities.
Could we be wrong? Yes, of course. We are only human, after all.
But given the Fed's extreme unreliability in predicting their own future policy actions, we are far more comfortable trusting what we see in the data than what we are hearing from Fed officials.
For further details see:
'Higher For Longer'? Don't Trust The Fed