MDYV - 'Magnificent 7' 2023 Q3 Earnings Preview: Lifting S&P 500 To Positive Earnings Growth
2023-10-17 22:25:00 ET
Summary
- In this note, we look at the Mag-7 group in more detail and preview growth expectations heading into the quarter.
- Mag-7 earnings for Q3 are forecasted at $72.3 billion (+35.9% y/y, +5.2% q/q) while revenue is forecasted at $364.5 billion (+11.3% y/y, +4.4% q/q).
- This compares to S&P 500 aggregate earnings (combining actuals and estimates) of $468.8 billion (+2.2% y/y, +3.7% q/q) and revenue of $3,767.0 billion (+1.0% y/y, +1.6% q/q).
By Tajinder Dhillon
Last week, we published our S&P 500 2023 Q3 Earnings Preview ( S&P 500 2023 Q3 Earnings Preview: Earnings Expectation Rise Heading into Earnings Season , October 11, 2023) and highlighted that the ‘Magnificent-7’ reached a new all-time high market-cap weight within the S&P 500.
In this note, we look at the Mag-7 group in more detail and preview growth expectations heading into the quarter. Tesla Inc. ( TSLA ) will be the first to report earnings later this week (Oct 18), followed by Microsoft Corp. ( MSFT ) (Oct 24), Alphabet Inc. ( GOOG ) ( GOOGL ) (Oct 24), Meta Platforms Inc. ( META ) (Oct 25), Amazon Inc. ( AMZN ) (Oct 26), Apple Inc. ( AAPL ) (Nov 2), and Nvidia Corp. ( NVDA ) (Nov 21).
Part 1 – Earnings and Revenue Growth
Using data from the October 13 th publication of the S&P 500 Earnings Scorecard, Mag-7 earnings for Q3 are forecasted at $72.3 billion (+35.9% y/y, +5.2% q/q) while revenue is forecasted at $364.5 billion (+11.3% y/y, +4.4% q/q).
This compares to S&P 500 aggregate earnings (combining actuals and estimates) of $468.8 billion (+2.2% y/y, +3.7% q/q) and revenue of $3,767.0 billion (+1.0% y/y, +1.6% q/q).
Tesla Inc. is the only company in the Mag-7 expected to post a negative y/y earnings growth rate in Q3 (-29.5%) while Nvidia Corp. is expected to post the largest y/y growth (477.1%), followed by Meta Platforms (120.3%), Amazon Inc. (108.0%), Alphabet Inc. (36.5%), Microsoft Corp. (12.9%), and Apple Inc. (7.7%).
Exhibit 1 highlights the aggregate earnings growth rate for Mag-7 vs. the overall index. The Mag-7 group is expected to far exceed the overall index growth rate in Q3 (+35.9% y/y vs. +2.2% y/y). When excluding the Mag-7, the S&P 500 Q3 earnings growth rate declines from +2.2% y/y to -2.3% y/y as shown in the grey bar.
Exhibit 1: Mag-7 Earnings Growth Rate
Based on analyst expectations, the outperformance from the Mag-7 group is expected to continue for the following seven quarters. Looking at full-year growth, Mag-7 earnings are expected to grow 32.9% in 2023 and 19.7% the following year compared to 2.2% and 12.1% for the S&P 500 over the same period.
We see a similar picture when looking at revenue growth as shown in Exbibit 2. The Mag-7 group is expected to grow revenue by 11.3% y/y compared to 1.0% for the overall index.
When excluding Mag-7, the growth rate declines to 0.0%. Like earnings, the Mag-7 group is expected to outperform the overall index for the next seven quarters based on analyst estimates.
Exhibit 2: Mag-7 Revenue Growth Rate
Part 2 – Mag-7: A StarMine Perspective
We turn to LSEG Workspace to see the StarMine model scores for the Mag-7 group. StarMine offers quantitative models and analytics across factors such as value, momentum, ownership, quality, and credit risk models designed to detect bankruptcy or default risk.
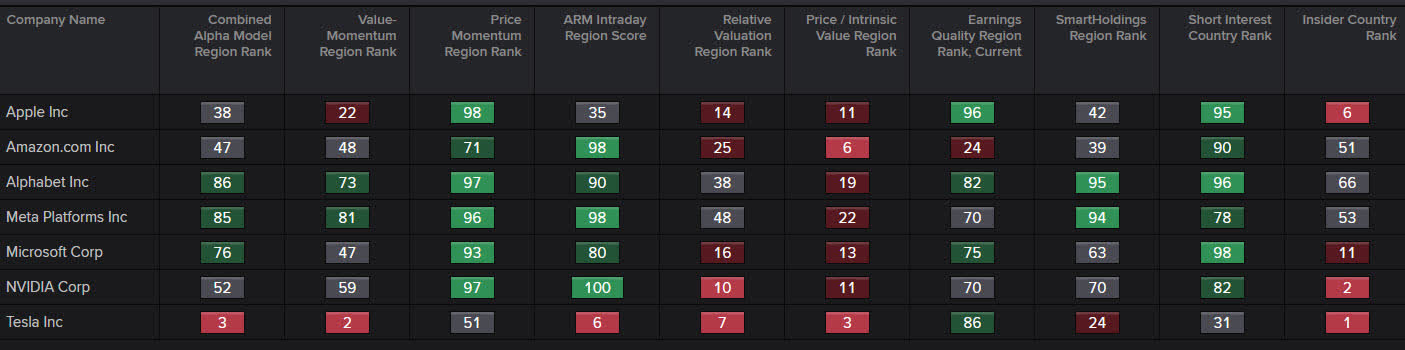
As shown in Exhibit 3, the Mag-7 group has had strong price momentum as every constituent except for Tesla Inc. has a model score (1-100 regional percentile ranking) above 70, which is considered a bullish signal.
As written in a prior note in May ( Large-Cap U.S. Equities Showing Narrow Breadth in Year-to-Date Performance , May 31, 2023), the Mag-7 group has been responsible for the majority of price gains in the overall index year-to-date.
As of October 13, the Mag-7 group has contributed 12.5 percentage points to the overall index return of 12.9 percent. If we were to exclude the Mag-7, the year-to-date return in the S&P 500 would fall from 12.9% to 0.4%.
Exhibit 3: StarMine Model Scores
Source: LSEG Workspace
With such a sharp rise in stock prices, these companies have a low value score (i.e. considered expensive) as defined by the Relative Value ((RV)) and Intrinsic Value ((IV)) model.
RV compares a company to its regional, sector, and industry peers using six fundamental ratios, while IV uses a dividend-discount model to determine the intrinsic value of a company.
The aggregate forward four-quarter P/E ratio for the Mag-7 group is 28.6x compared to an index P/E of 18.2x. This represents a premium of 56.6%. When excluding the Mag-7, the forward P/E declines from 18.2x to 15.9x.
The aggregate forward four-quarter P/S ratio for the Mag-7 group is 5.9x compared to an index P/S of 2.1x. This represents a premium of 282.0%. When excluding the Mag-7, the forward P/S declines from 2.1x to 1.6x.
Using LSEG Datastream, we can summarize the price vs. valuation relationship in a single powerful graph (Exhibit 4). Using the scatter plot, we display every constituent in the index where the X-axis shows year-to-date performance, and the Y-axis shows the forward P/E ratio.
Constituents are color-coded by sector with a special call-out for the Mag-7 group. We note a ‘C’ shape where the Mag-7 leads the pack from a price appreciation perspective.
Interestingly, Nvidia has a forward P/E that is lower than others in the Mag-7 (Tesla, Amazon) and in-line with others (Apple, Amazon), even though it is the top performer from a price perspective.
Exhibit 4: S&P 500 Price vs. Forward P/E
Aside from using fundamental ratios, we can also use the Intrinsic Value model to gauge market expectations for earnings growth and try to better understand how much of the current and future news is reflected in the current stock price.
Using Nvidia Corp. as an example in Exhibit 5, we turn to the ‘Market-Implied’ growth rate and solve backwards – it sets the last closing price as “fair value” then solves for the growth rate required over the next five years to justify that price.
The market has priced in a forward five-year compound annualized growth rate in earnings of 56.9%, which is far greater than the industry average of 7.9% and above the StarMine Projection of 42.8% (StarMine will adjust estimates for an ‘optimism bias’ in addition to the accuracy of analysts).
We can compare the forward growth projections to the trailing five-year growth table, which shows Nvidia Corp. has underperformed the peer median (8.6% CAGR vs. 26.4%). We can see that the hopes and optimism around artificial intelligence has turbocharged growth expectations for Nvidia over the next five years.
Exhibit 5: StarMine IV Model for Nvidia Corp.
Source: LSEG Workspace
Even with such high growth expectations, analysts have been largely bullish with the Mag-7 group as shown by the Analyst Revision Model ((ARM)) score in Exhibit 2.
Five of the seven companies have an ARM score above 80 with Nvidia Corp. having a score of 100. Tesla has the lowest score (6). Over the last 90 days, Alphabet Inc. has seen the largest positive rate of change in the ARM score (35) followed by Amazon Inc (17).
Apple Inc. and Microsoft Inc. have seen the largest negative rate of change, with both companies seeing their ARM score decline by 11 points.
Value-Momentum (Val-Mo) combines our two Momentum and two Value models into a multi-factor score. Meta Platforms has the highest Val-Mo score (81) followed by Alphabet Inc. (73). Finally, the Combined Alpha Model ((CAM)) combines all alpha-generating models into a single score using an optimal, static, linear combination.
Part 3 – Net Profit Margin Expectations
Based on analyst estimates, Nvidia Corp. is expected to have the largest net profit margin this quarter at 51.4%, followed by Microsoft Corp. (36.2%), Meta Platforms Inc. (27.7%), Apple Inc. (24.3%), Alphabet Inc. (24.0%), Tesla Inc. (9.7%), and Amazon Inc. (4.2%).
At an aggregate level, the Mag-7 group is expected to post a Q3 net profit margin of 19.8% as shown in Exhibit 6. This compares to an index profit margin of 12.4%. When excluding the Mag-7 group, the S&P 500 net profit margin falls from 12.4% to 11.7%.
On a full-year basis, the Mag-7 net profit margin is expected to rise by 120 basis points in 2024 in comparison to an 80 basis point rise in the overall index.
Exhibit 6: Net Profit Margin
Conclusion
Although the Mag-7 have been largely contributing towards the year-to-date performance in the S&P 500, it can be justified based on earnings and revenue growth.
According to analyst estimates, the Mag-7 group is expected to significantly outperform the broader index for the next several quarters on a year-over-year basis. Furthermore, the group is highly profitable as shown by the net profit margin ratio.
Editor's Note: The summary bullets for this article were chosen by Seeking Alpha editors.
For further details see:
'Magnificent 7' 2023 Q3 Earnings Preview: Lifting S&P 500 To Positive Earnings Growth