RC - 1 Fat Yielder To Buy And 1 To Dump
2023-08-01 17:40:48 ET
Summary
- We’re picking one share with a big discount to book value and a reasonable dividend payout ratio relative to book value.
- The market may be misreading this dividend payout as plenty of sites are reporting a different value. Seeking Alpha is accurate.
- On the other hand, one of the darlings in the sector is far less attractive.
Get ready for charts, images, and tables because they're better than words. The ratings and outlooks we highlight here come after Scott Kennedy’s weekly updates in the REIT Forum. Your continued feedback is greatly appreciated, so please leave a comment with suggestions.
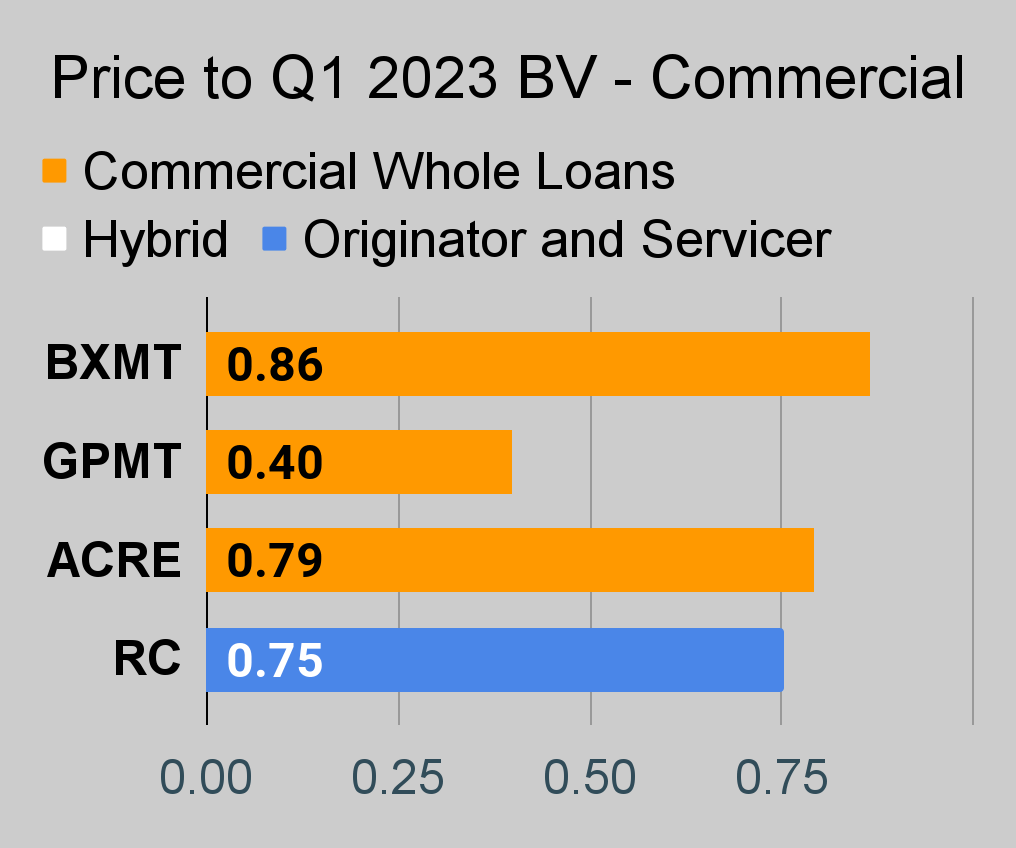
I’ll start with the one to buy. Ready Capital ( RC ) put together a respectable rally, but shares still look like a bargain. They trade around 76% of our estimate for book value. That’s pretty low by historical measures. They still pay a respectable dividend. It’s not “safe,” but none in this sector are. You should be wary of anyone who claims otherwise.
Many people incorrectly believe RC has a low dividend yield. That could be factoring into the unusually low share price. Since RC had an acquisition in Q2 2023, they split their dividend into two payouts. It was the same as the prior quarter but split in two. Many sources inaccurately use only one of those two dividends to establish the reported yield. That may be reducing the demand for RC from investors (or index funds) who don’t know better. The error is pretty widespread.
First, allow me to demonstrate that I’m right about the current dividend rate:
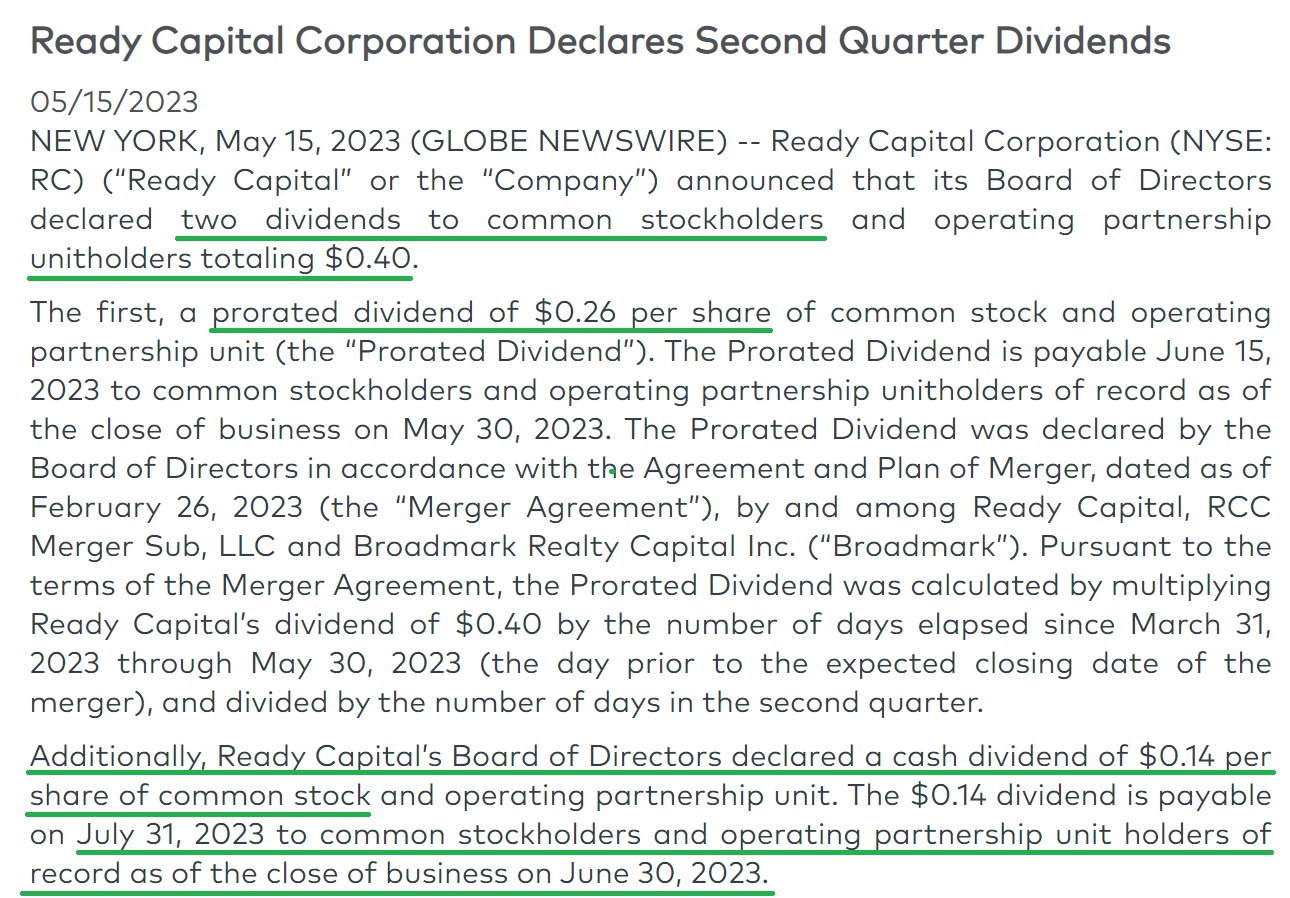
That announcement makes it pretty clear. The Q2 2023 dividend was $.40, split between $.26 and $.14. It’s possible that the REIT might change the dividend in Q3 2023, but that’s not known presently. It's always a risk, but if I don’t mention it specifically twice, someone will claim it wasn’t mentioned.
But is it really a common error? Would investors really be getting the wrong information?
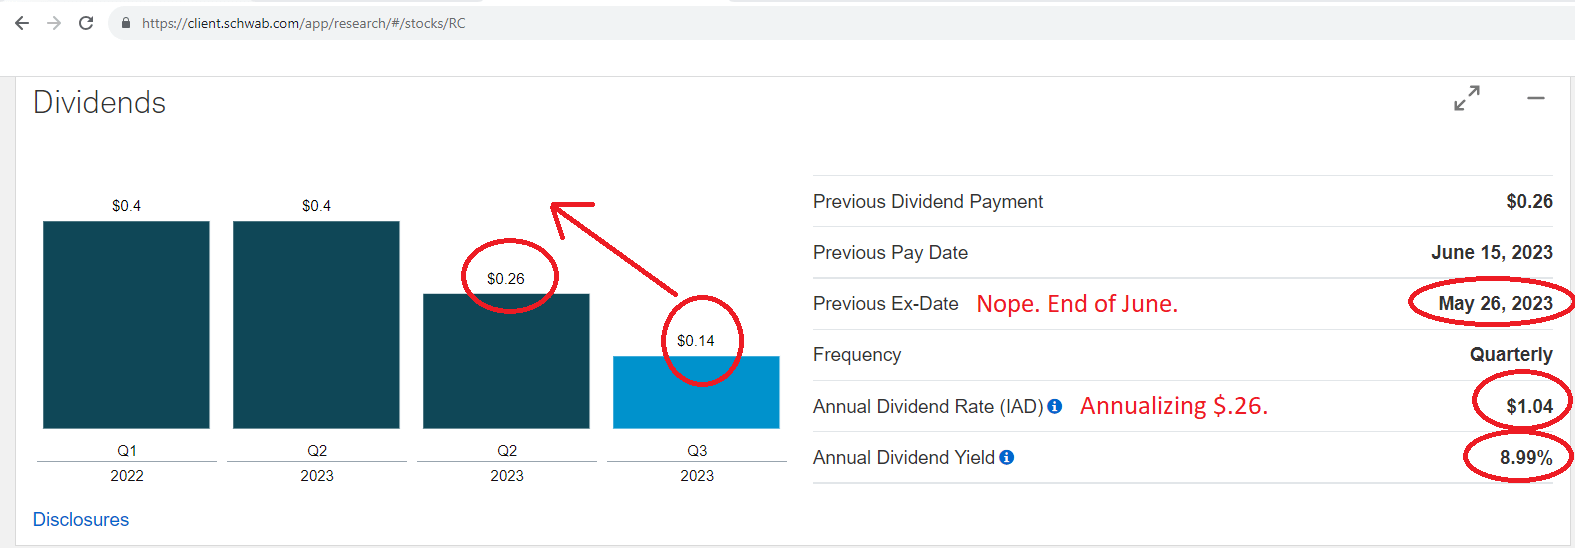
Was Schwab ( SCHW ) the only one?
What does Fidelity say?
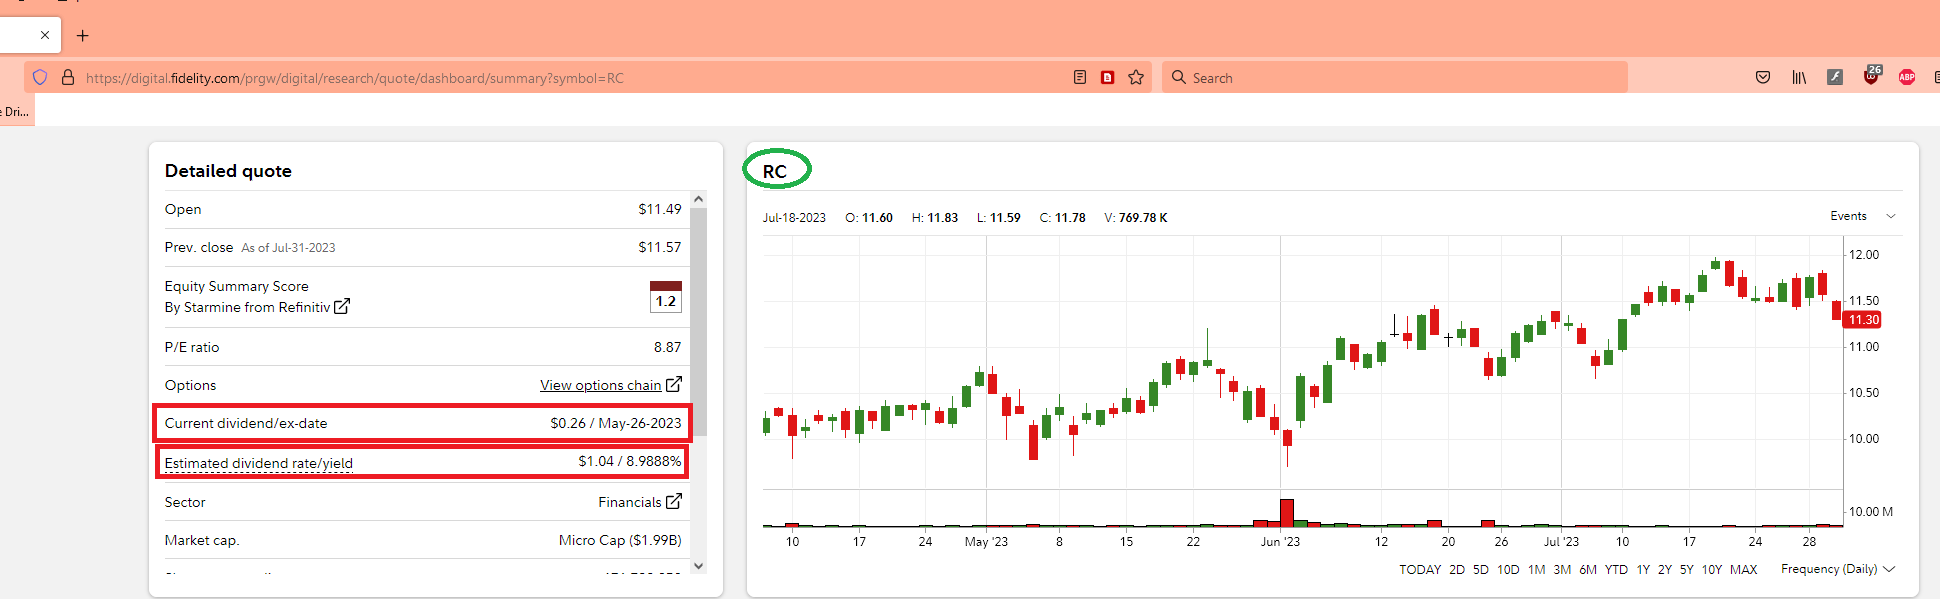
Fidelity promotes that wrong data also. At this point, I think it’s fair to say this problem is common enough that it might impact valuation.
There's one source that's getting it right:
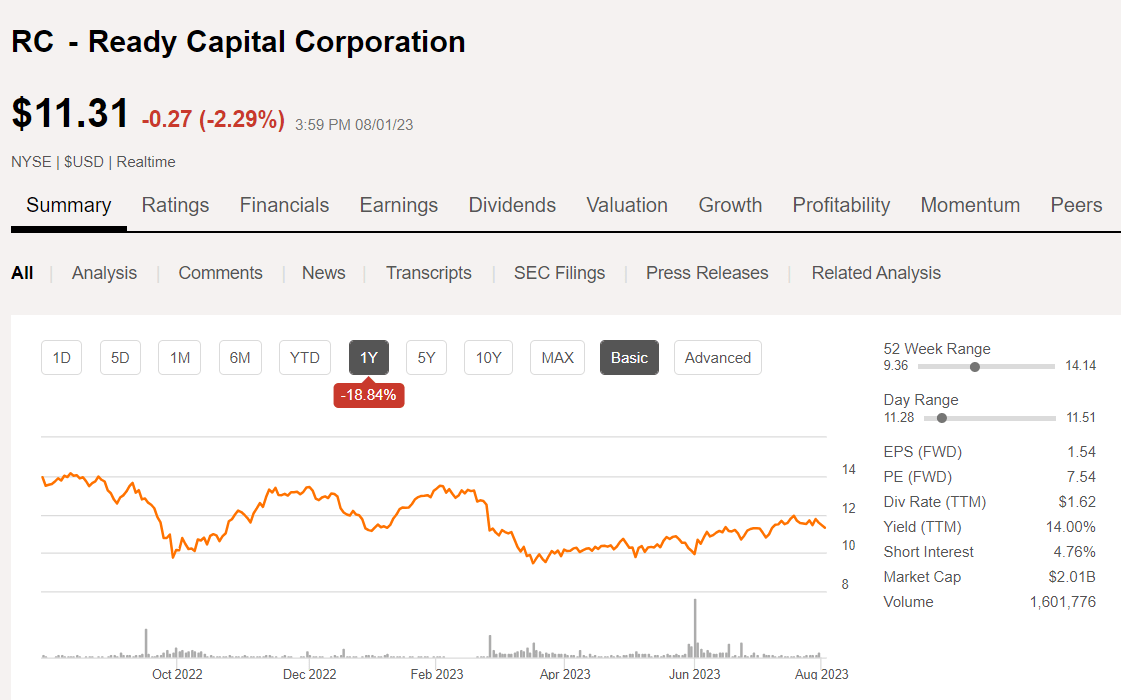
The dividend yield shown above is based on the prior close, so it used a modestly higher price to reach 14%. That’s the right dividend information. Seeking Alpha’s dividend data is much better than most because they have manual data checks rather than relying exclusively on imported data.
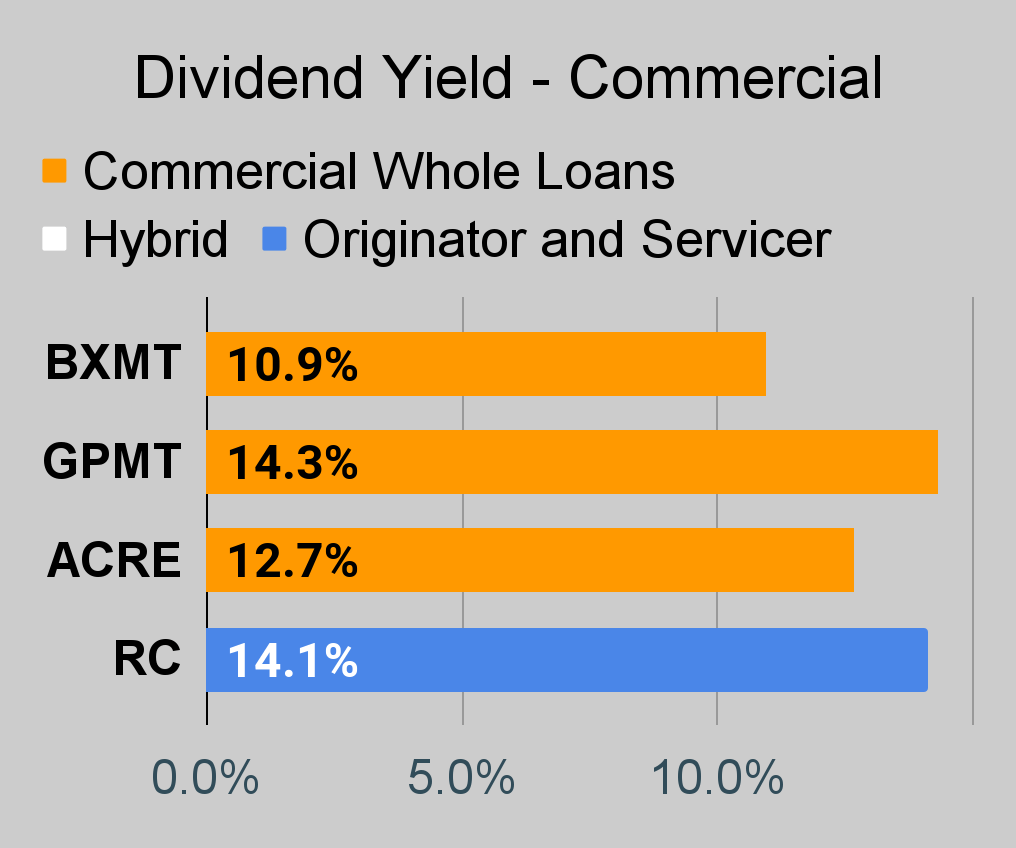
Currently, RC’s dividend yield is 14.1% (using the share price). Even if an investor expects it to be reduced, predicting $.26 would be quite extreme. The $1.40 dividend is about a 10.8% dividend yield on book value (our estimate for current book value). That’s not extreme. For comparison, the next REIT is paying out 15.3% on book value.
Bad Investment
How about the stock that looks too expensive?
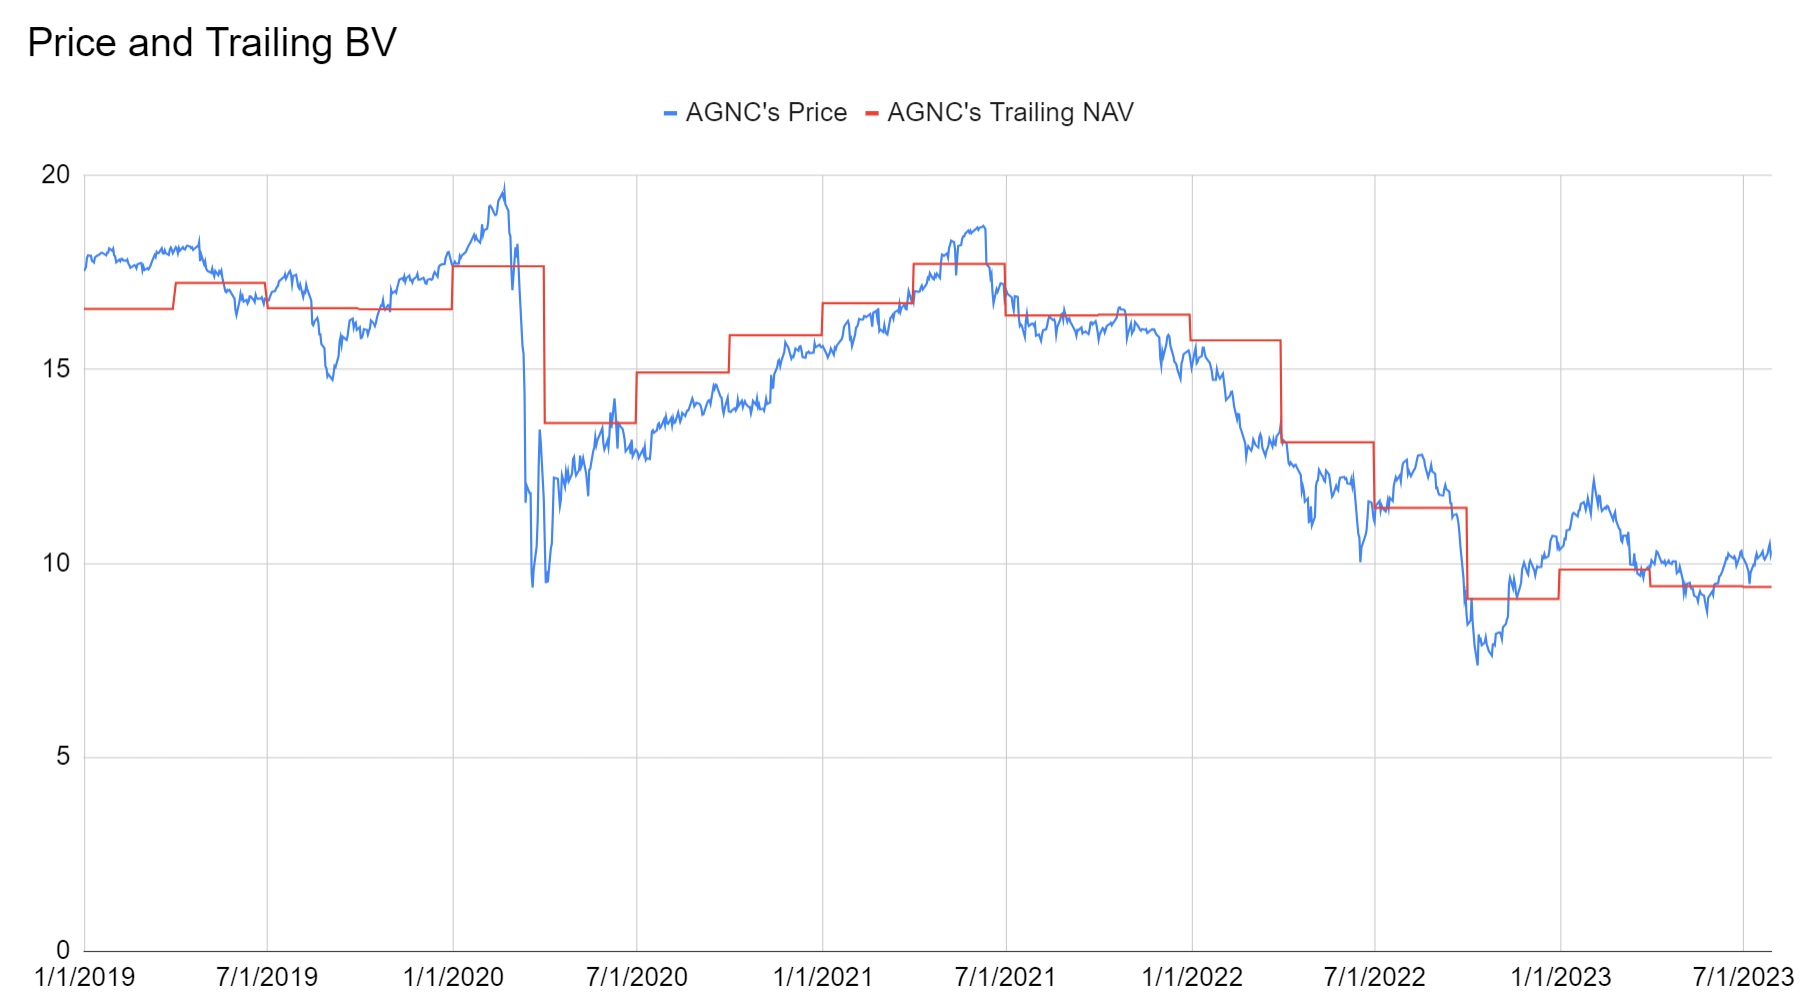
Congratulations AGNC Investment Corp. ( AGNC ). It’s you, again! This would be a great time for AGNC to do a secondary offering or really push for their ATM (at the market) program to pump out more shares. They’ve got a premium valuation. This has happened before, but it’s not all that common:
Sorry, that’s not a long enough period for perspective. Let me zoom out a bit:
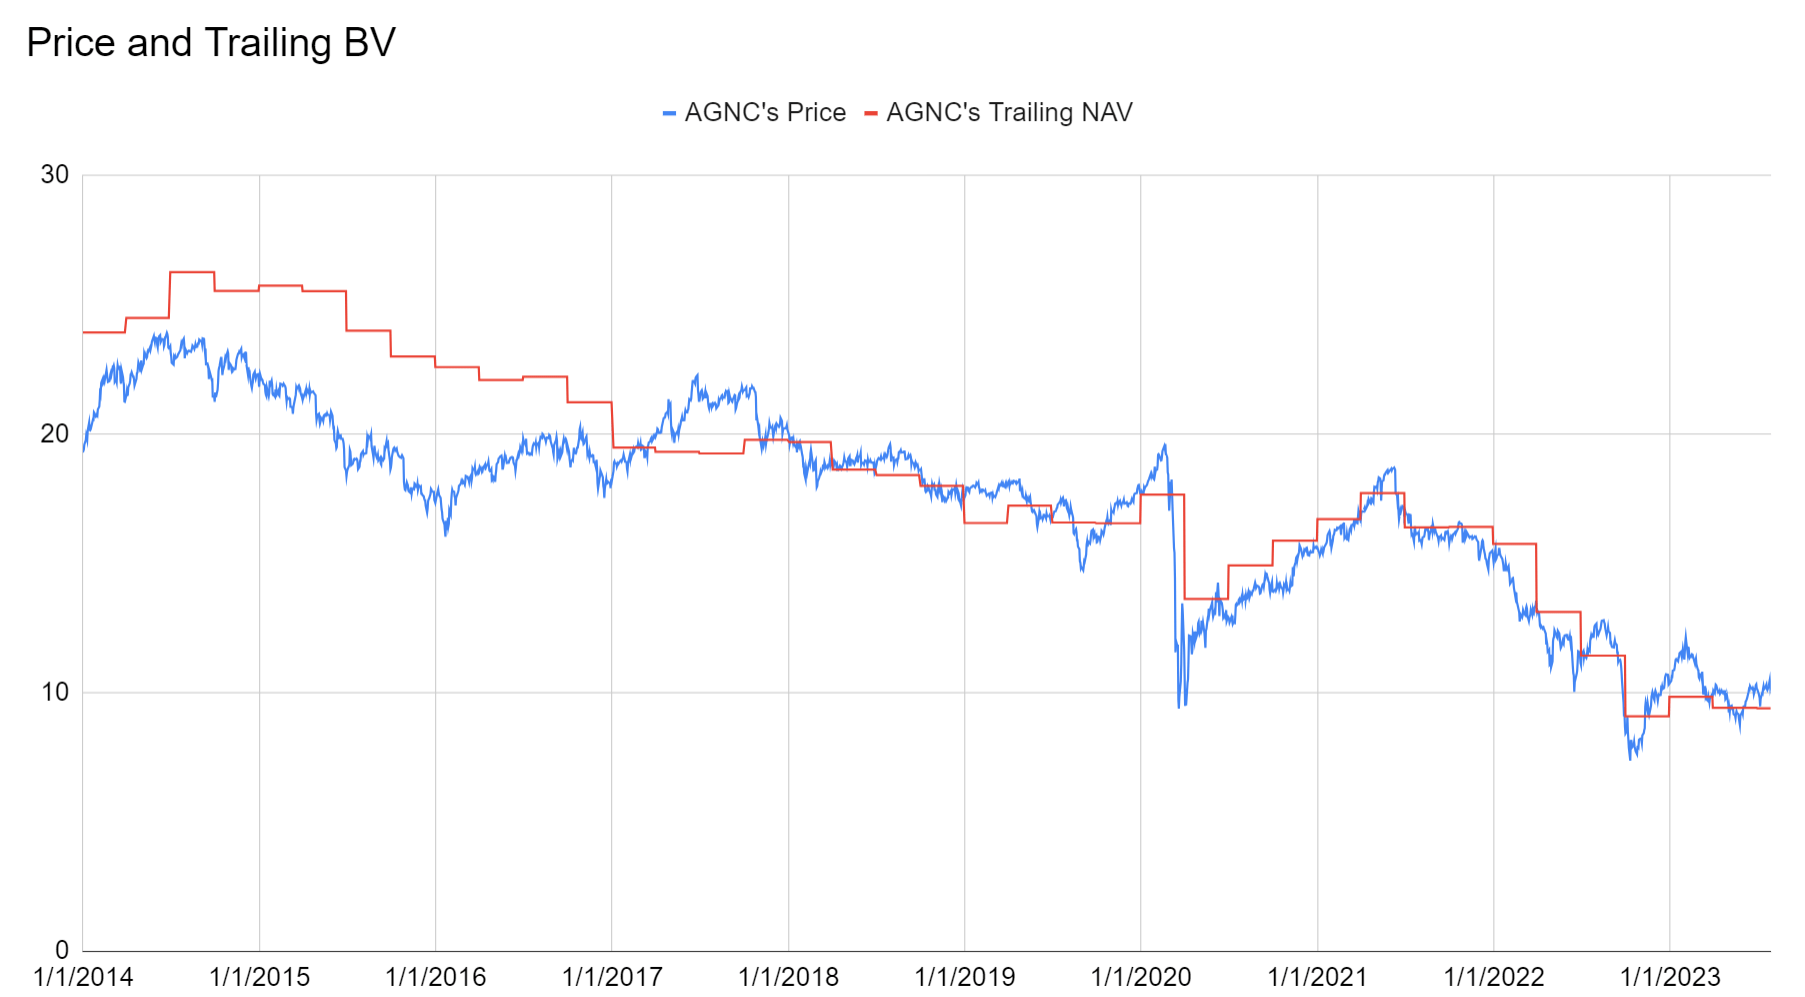
Premiums like this happened on occasion. They were not good buying opportunities.
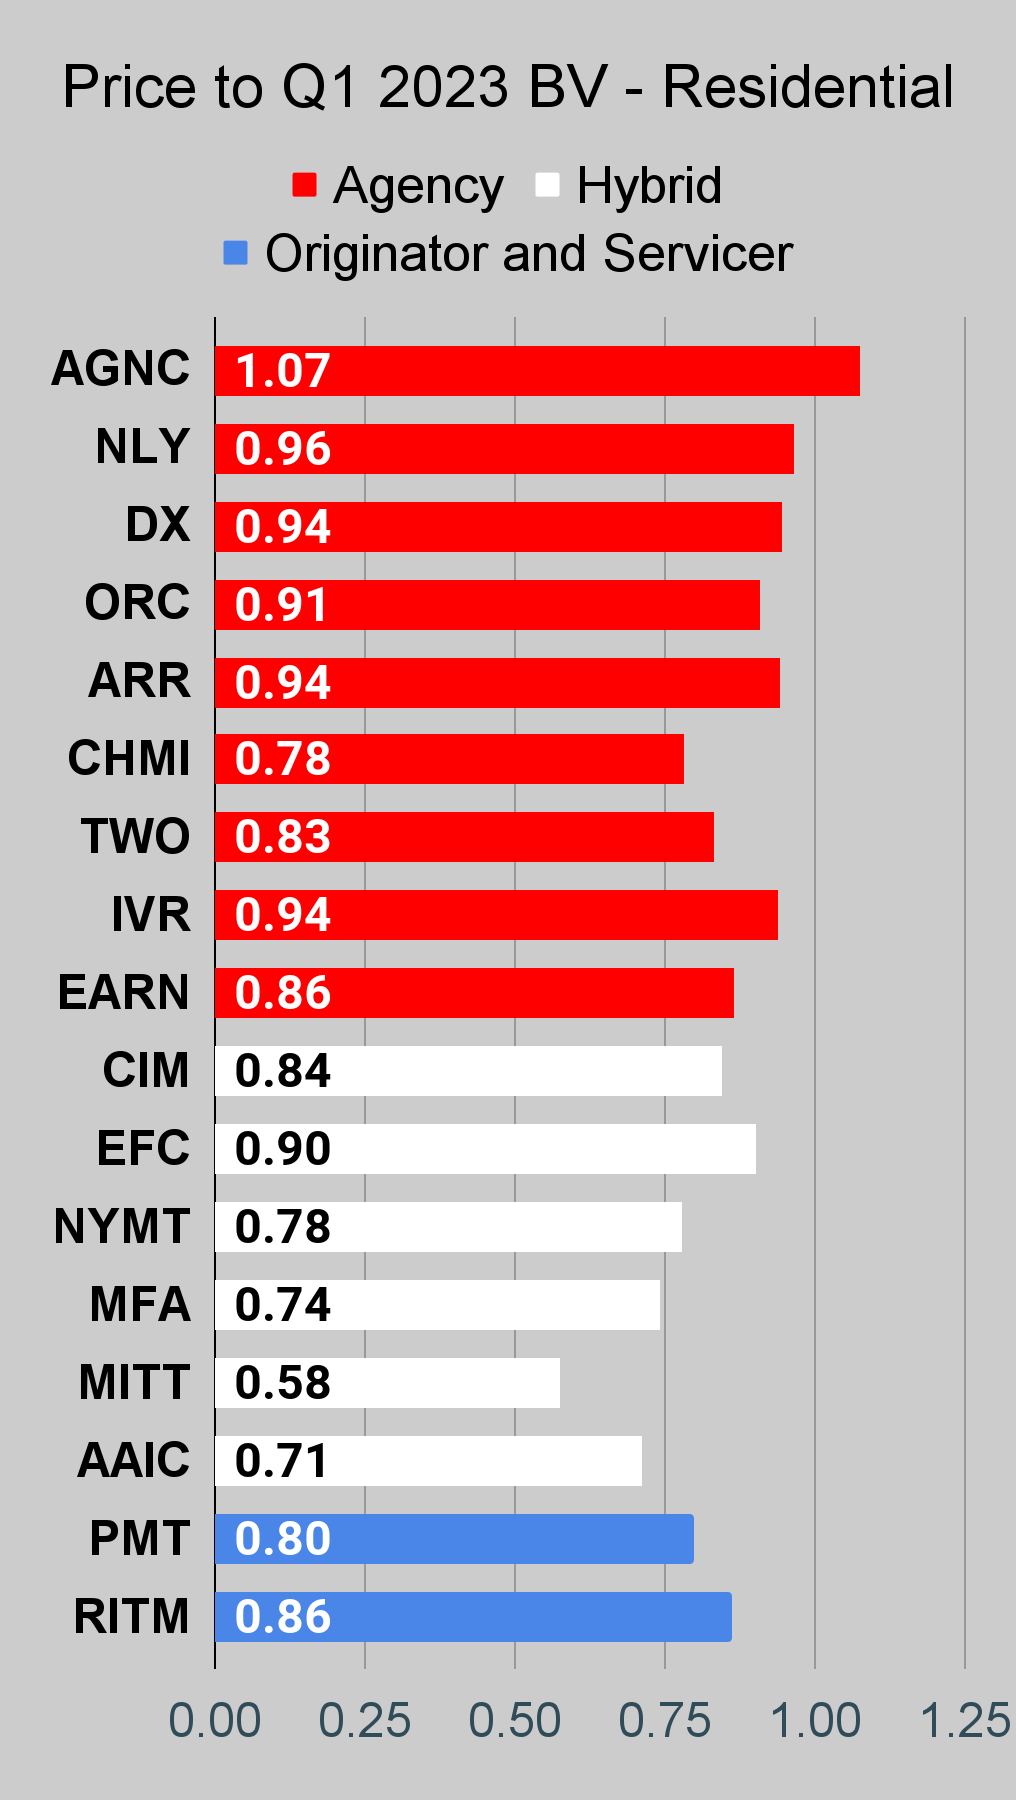
By our estimate for current tangible book value per share ($9.40 as of 7/28/2023), AGNC trades at a price-to-current-estimated-book ratio 1.08. That’s too high. This next chart creates the ratio between share price and trailing tangible book value per share.
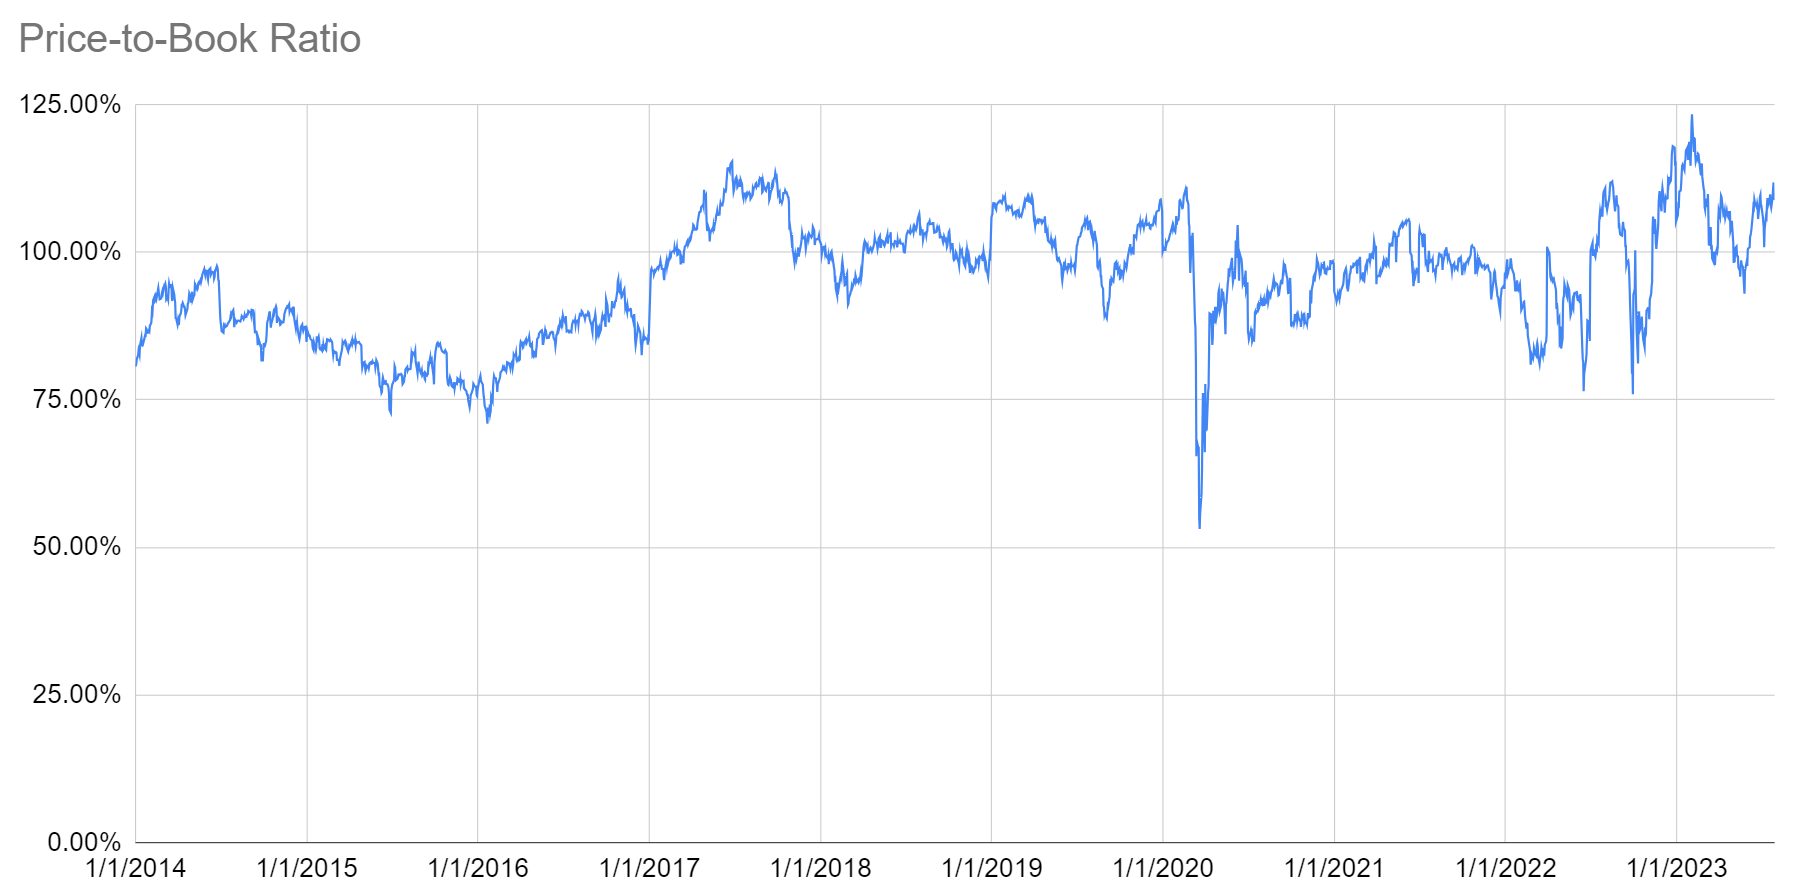
Note: Tangible book value and net asset value are being used interchangeably here. For AGNC, they should be.
Why is AGNC trading at a premium? I’d guess it’s because of their super strong earnings! Bottom right corner shows you how the earnings held up pretty well despite rising rates. That was fueled by an extremely strong net interest spread (bottom left). That was achieved by a dramatic increase in the average yield on assets (top left). Of course, you can’t just raise the yield on fixed-rate mortgages, so you should probably be wondering how the yield could rise that much. Then you’ve got the remarkably low cost of funds (top right). How do you get such a low cost of funds in this environment? Limit most of your borrowing to amounts covered (or more than covered) by your existing hedge portfolio:
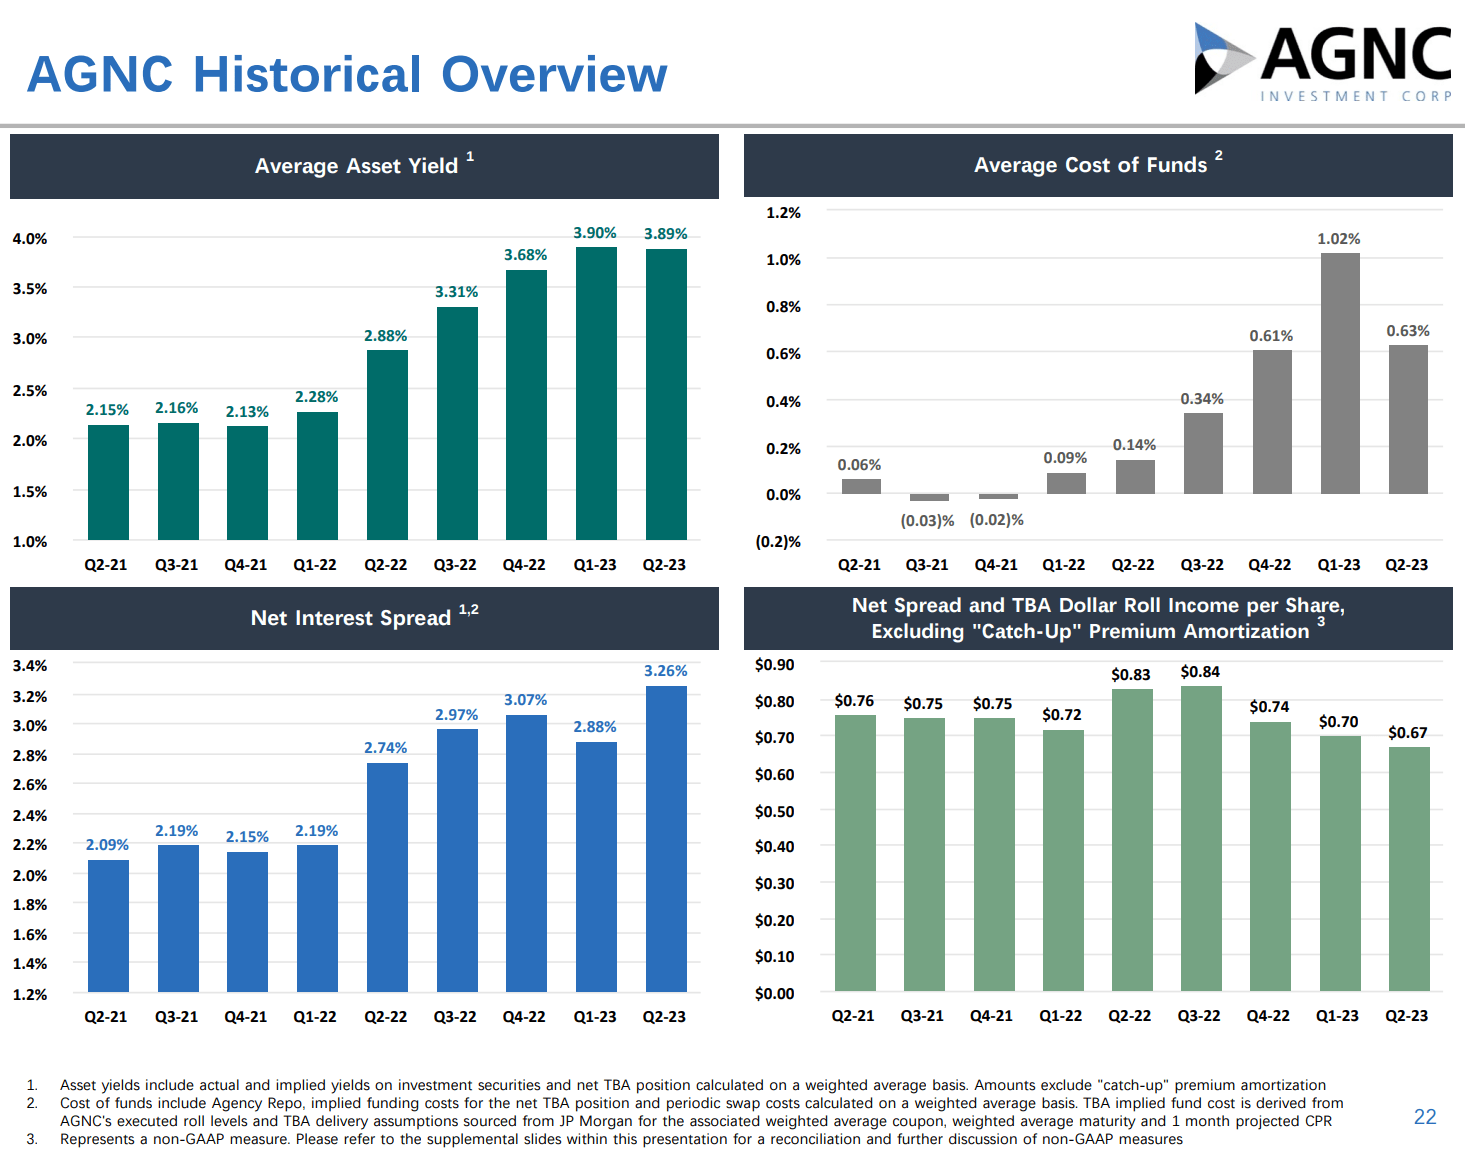
Eventually hedges run off and the cost of funds would rip higher, but who am I to rain on this parade?
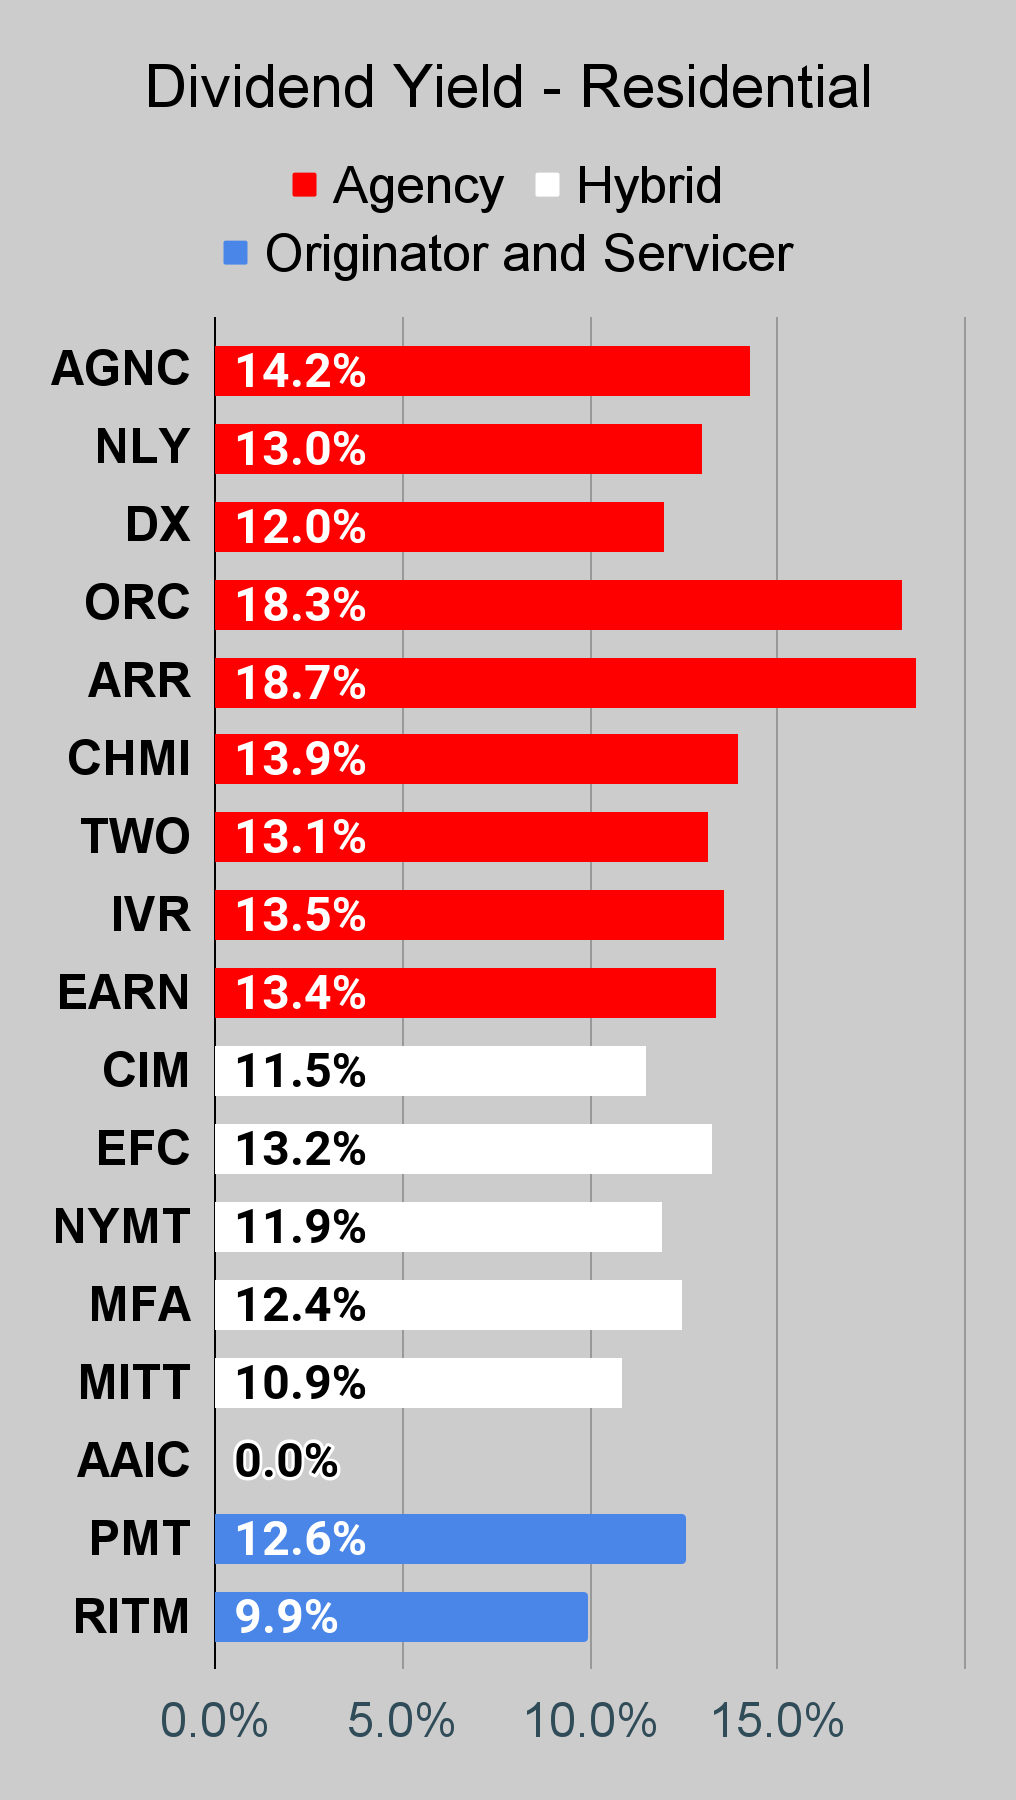
Of course, these strong earnings make the dividend look much safer even though it represents 15.3% on tangible book value. You may want to be a bit curious about that seeing as Annaly Capital Management ( NLY ) is paying out 12.4% on book value, Dynex Capital ( DX ) is paying out 11.1% on book value, Two Harbors ( TWO ) is paying out 11.1% on book value, and Cherry Hill Mortgage ( CHMI ) is paying out 11.5% on book value.
There are only a handful of mortgage REITs paying out much more than about 11.5% on book value. As a reminder, RC was paying out about 10.8% on book value.
Stock Table
We will close out the rest of the article with the tables and charts we provide for readers to help them track the sector for both common shares and preferred shares.
We’re including a quick table for the common shares that will be shown in our tables:
| Type of REIT or BDC |
| Residential Agency |
| Residential Hybrid |
| Residential Originator and Servicer |
| Commercial |
| BDC |
If you’re looking for a stock and I haven’t mentioned it yet, you’ll still find it in the charts below. The charts contain comparisons based on price-to-book value, dividend yields, and earnings yield. You won’t find these tables anywhere else.
For mortgage REITs, please look at the charts for AGNC, NLY, DX, ORC, ARR, CHMI, TWO, IVR, EARN, CIM, EFC, NYMT, MFA, MITT, AAIC, PMT, RITM, BXMT, GPMT, WMC, and RC.
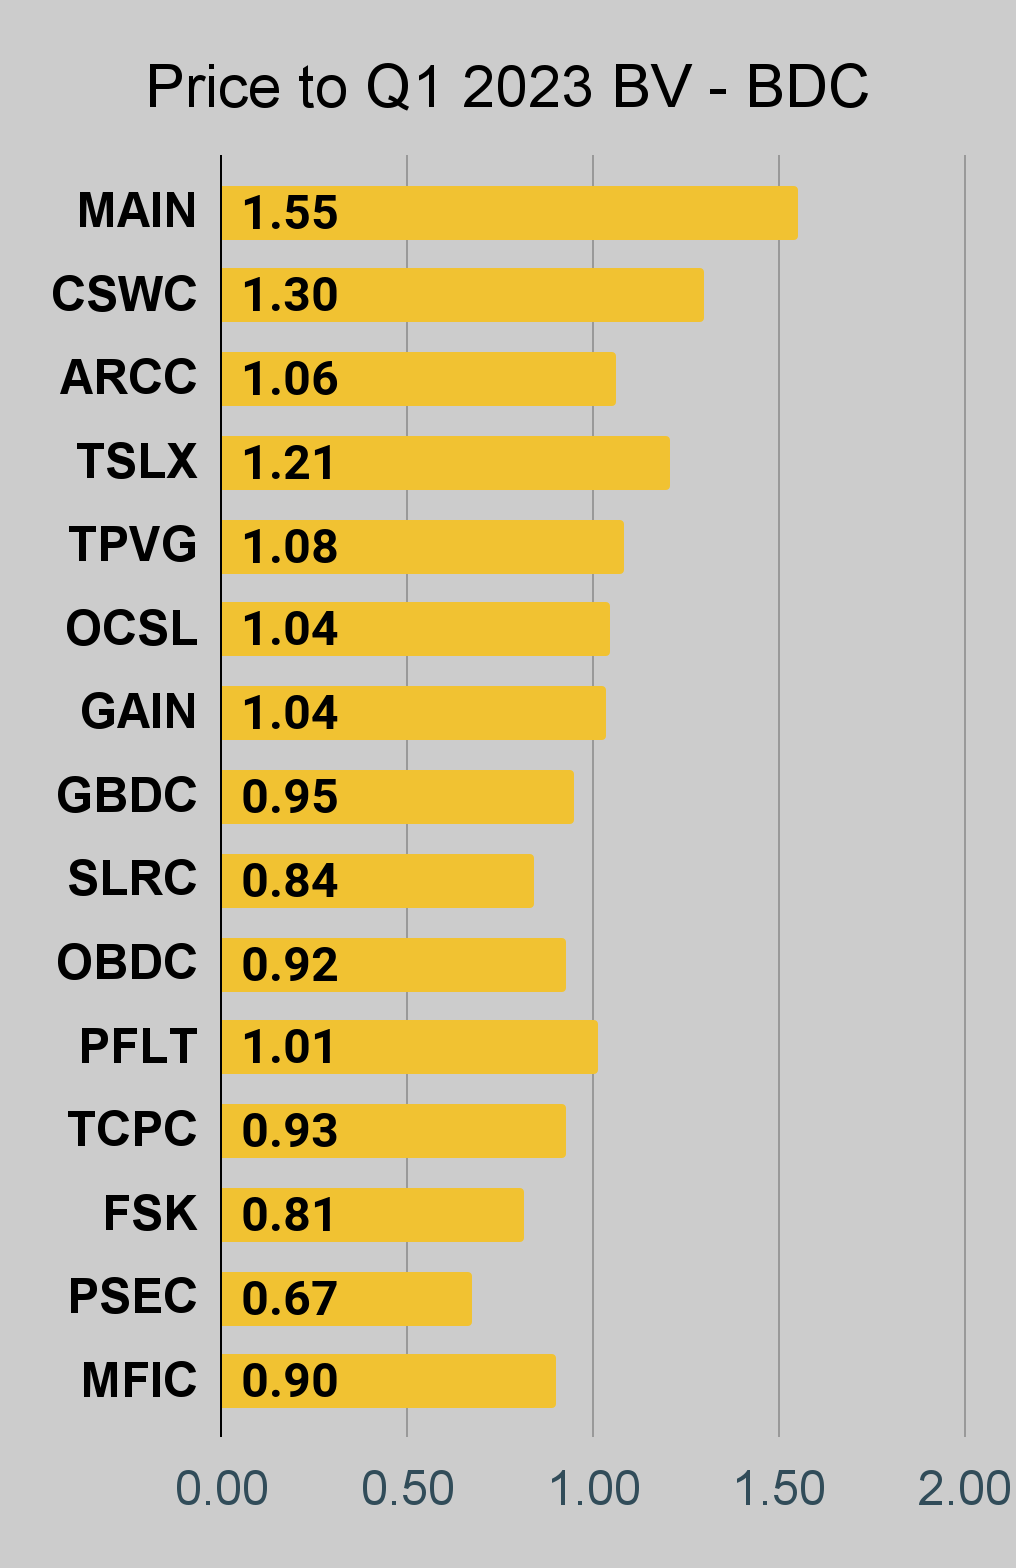
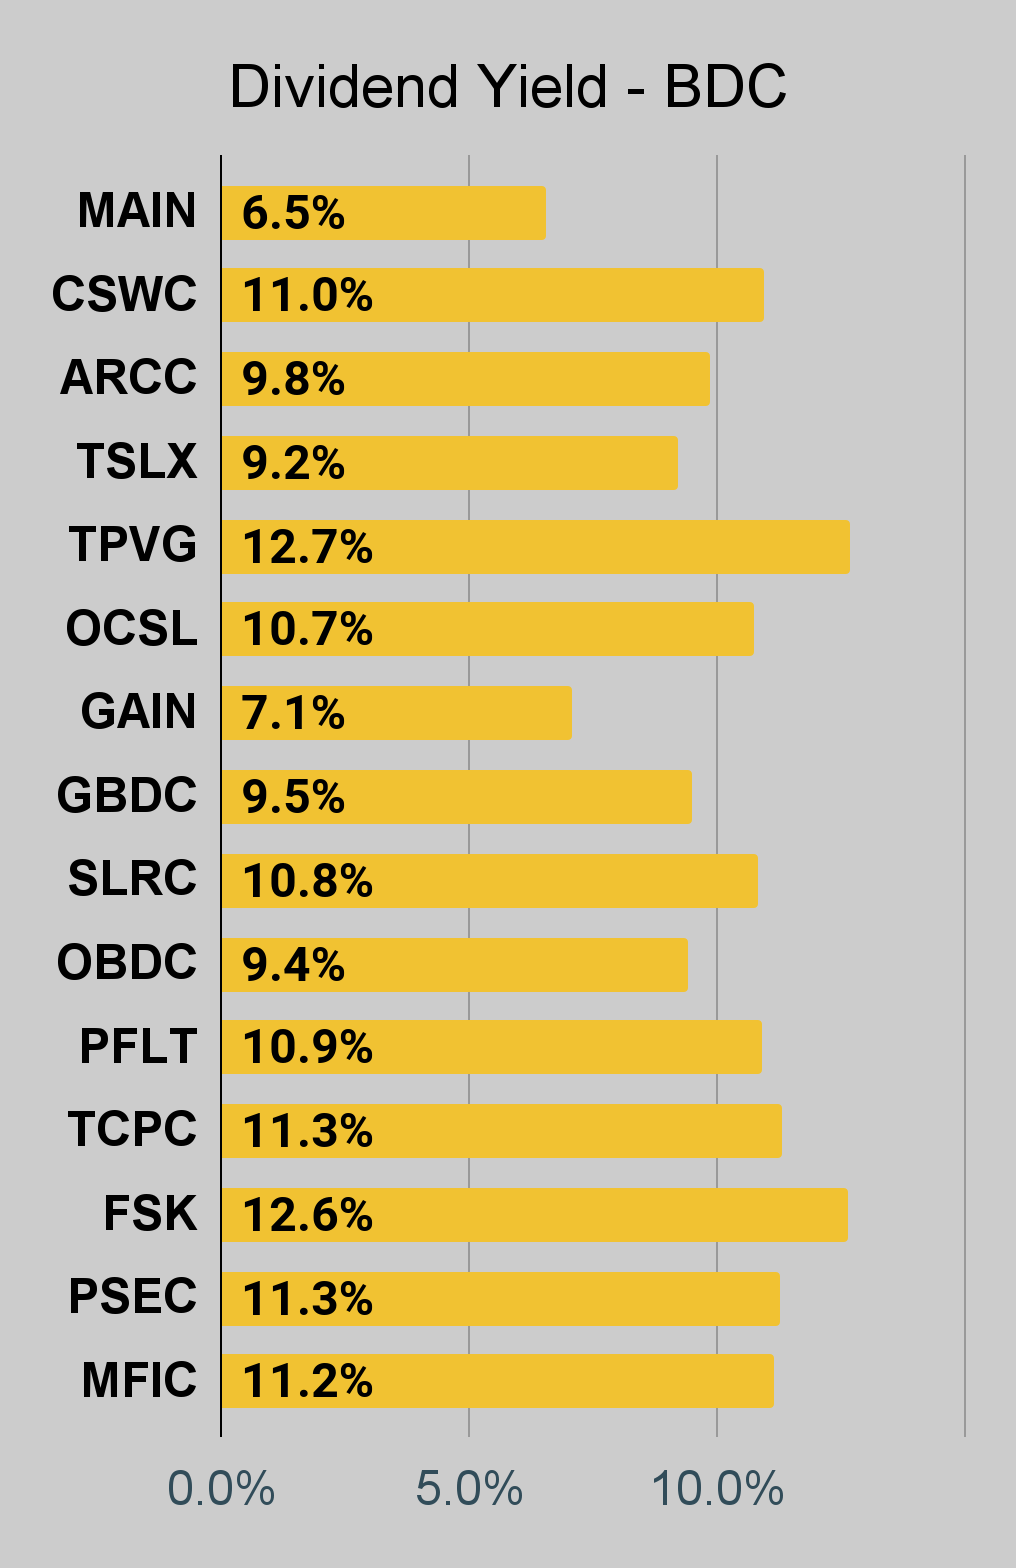
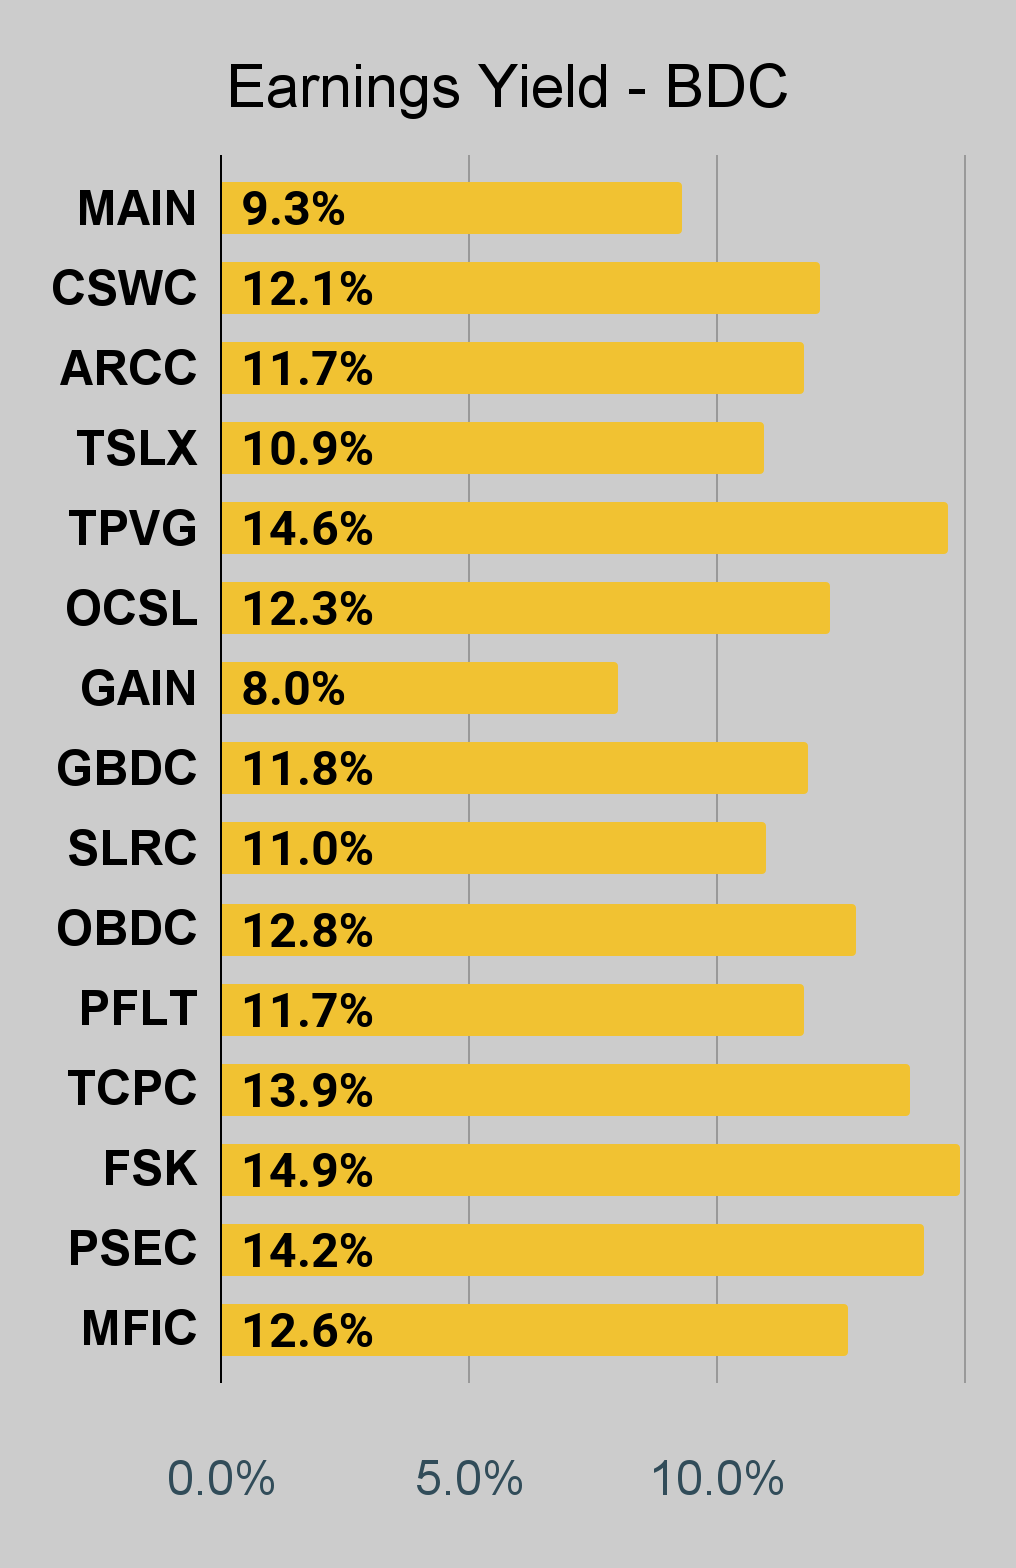
For BDCs, please look at the charts for MAIN, CSWC, ARCC, TSLX, TPVG, OCSL, GAIN, GBDC, SLRC, ORCC, PFLT, TCPC, FSK, PSEC, and MFIC.
This series is the easiest place to find charts providing up-to-date comparisons across the sector.
Residential Mortgage REIT Charts
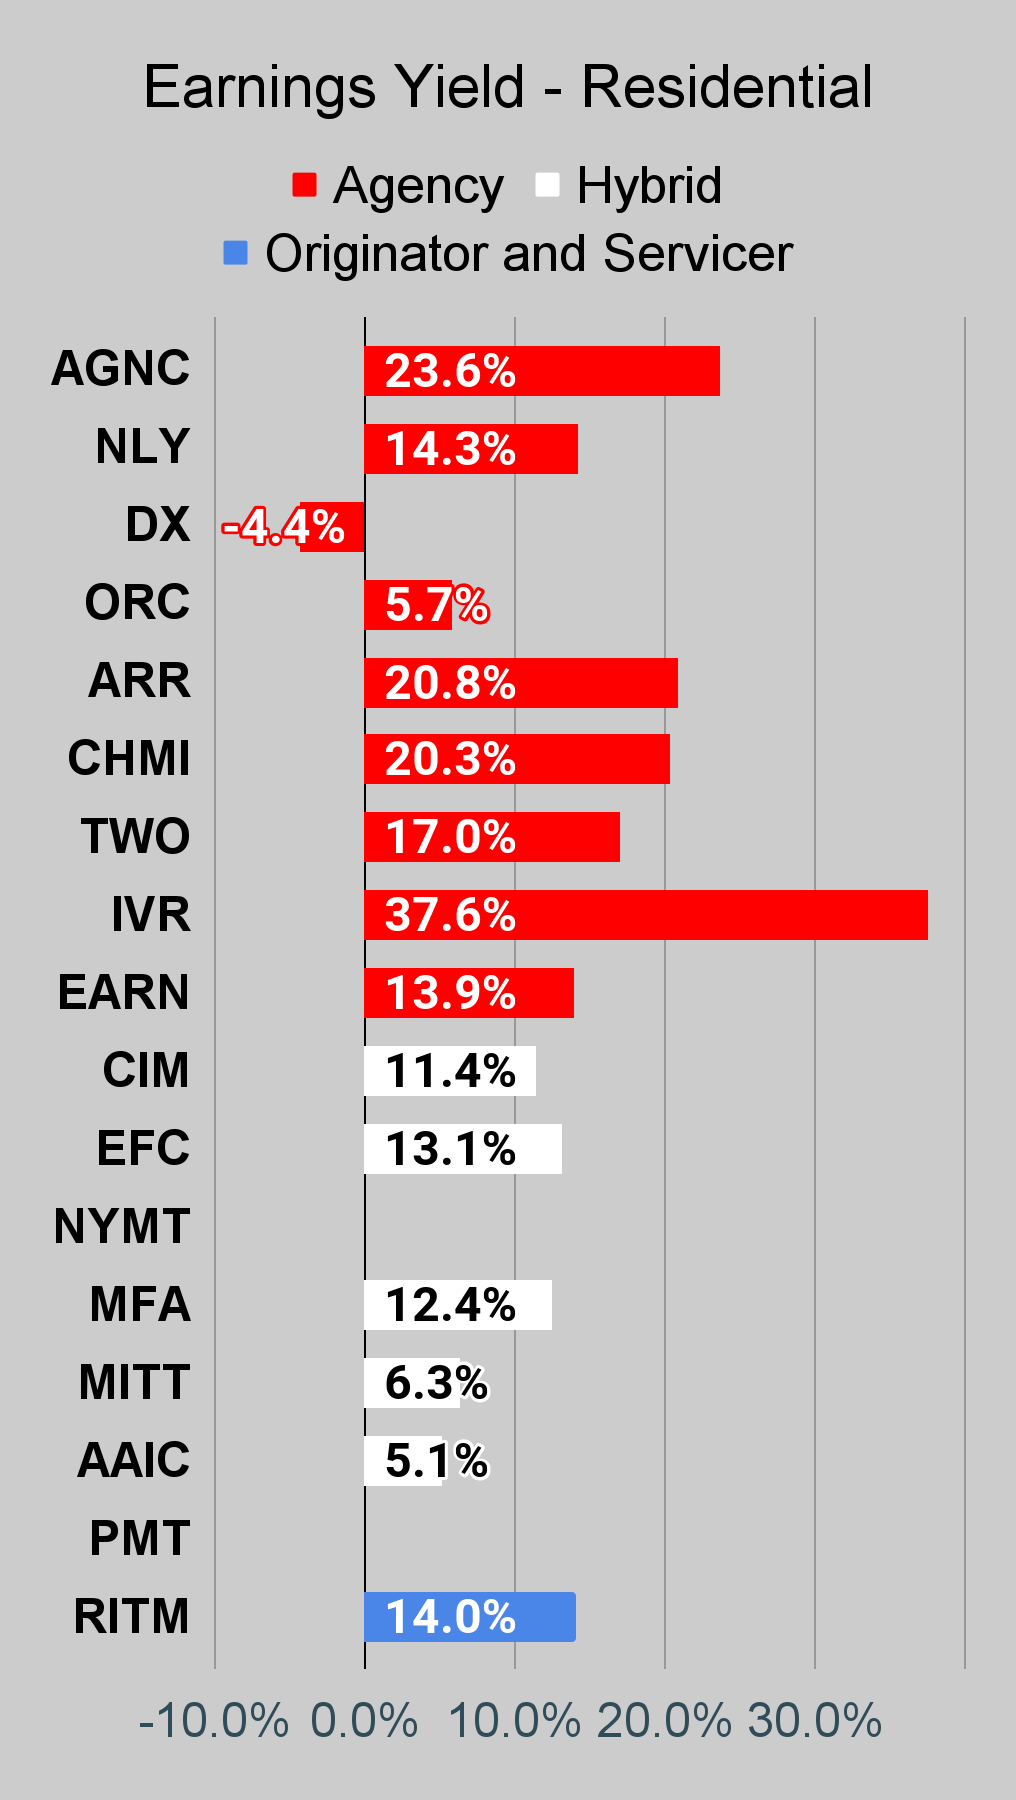
Note: The chart for our public articles uses the book value per share from the latest earnings release. Current estimated book value per share is used in reaching our targets and trading decisions. It's available in our service, but those estimates are not included in the charts below. PMT and NYMT are not showing an earnings yield metric as neither REIT provides a quarterly “Core EPS” metric. Presently, a few other REITs also have no consensus estimate.
Second Note: Due to the way historical amortized cost and hedging is factored into the earnings metrics, it's possible for two mortgage REITs with similar portfolios to post materially different metrics for earnings. I would be very cautious about putting much emphasis on the consensus analyst estimate (which is used to determine the earnings yield). In particular, throughout late 2022 the earnings metric became less comparable for many REITs.
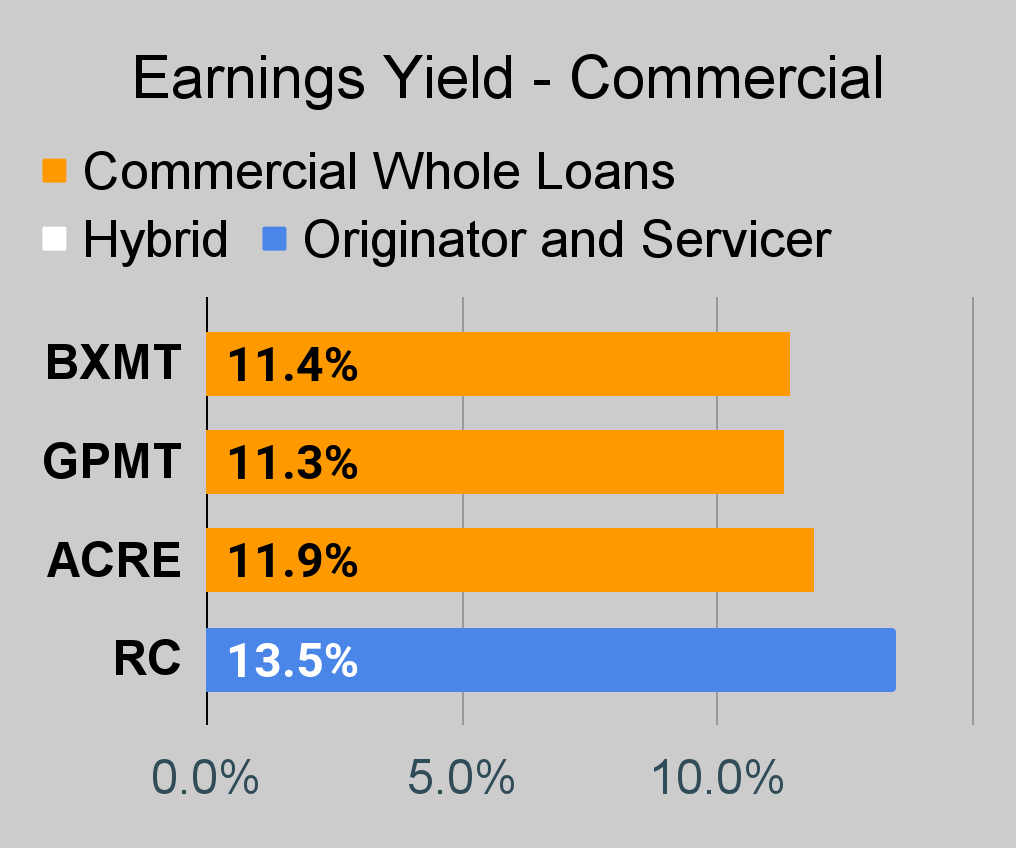
Commercial Mortgage REIT Charts
BDC Charts
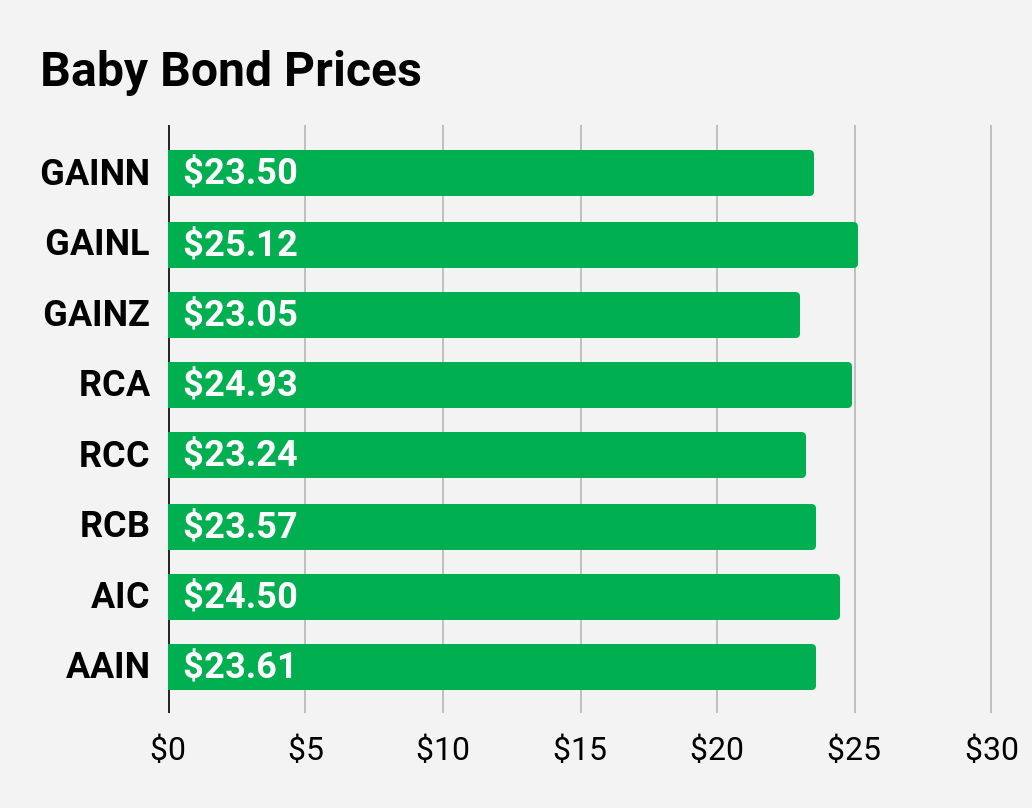
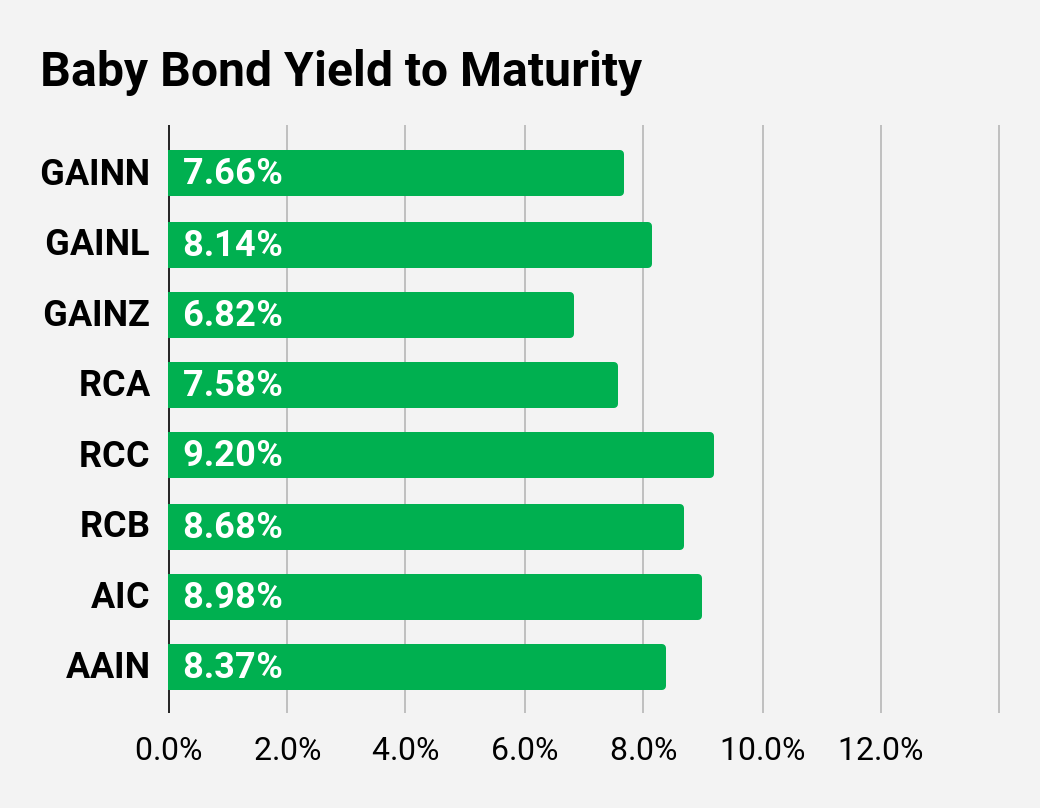
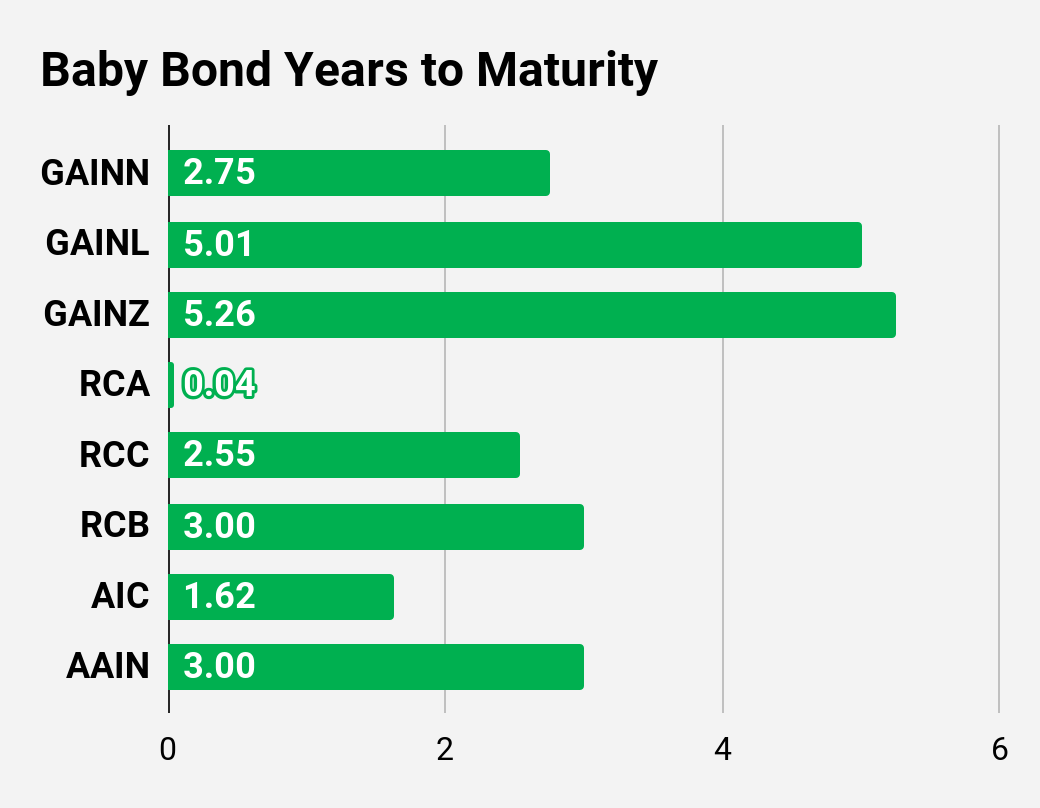
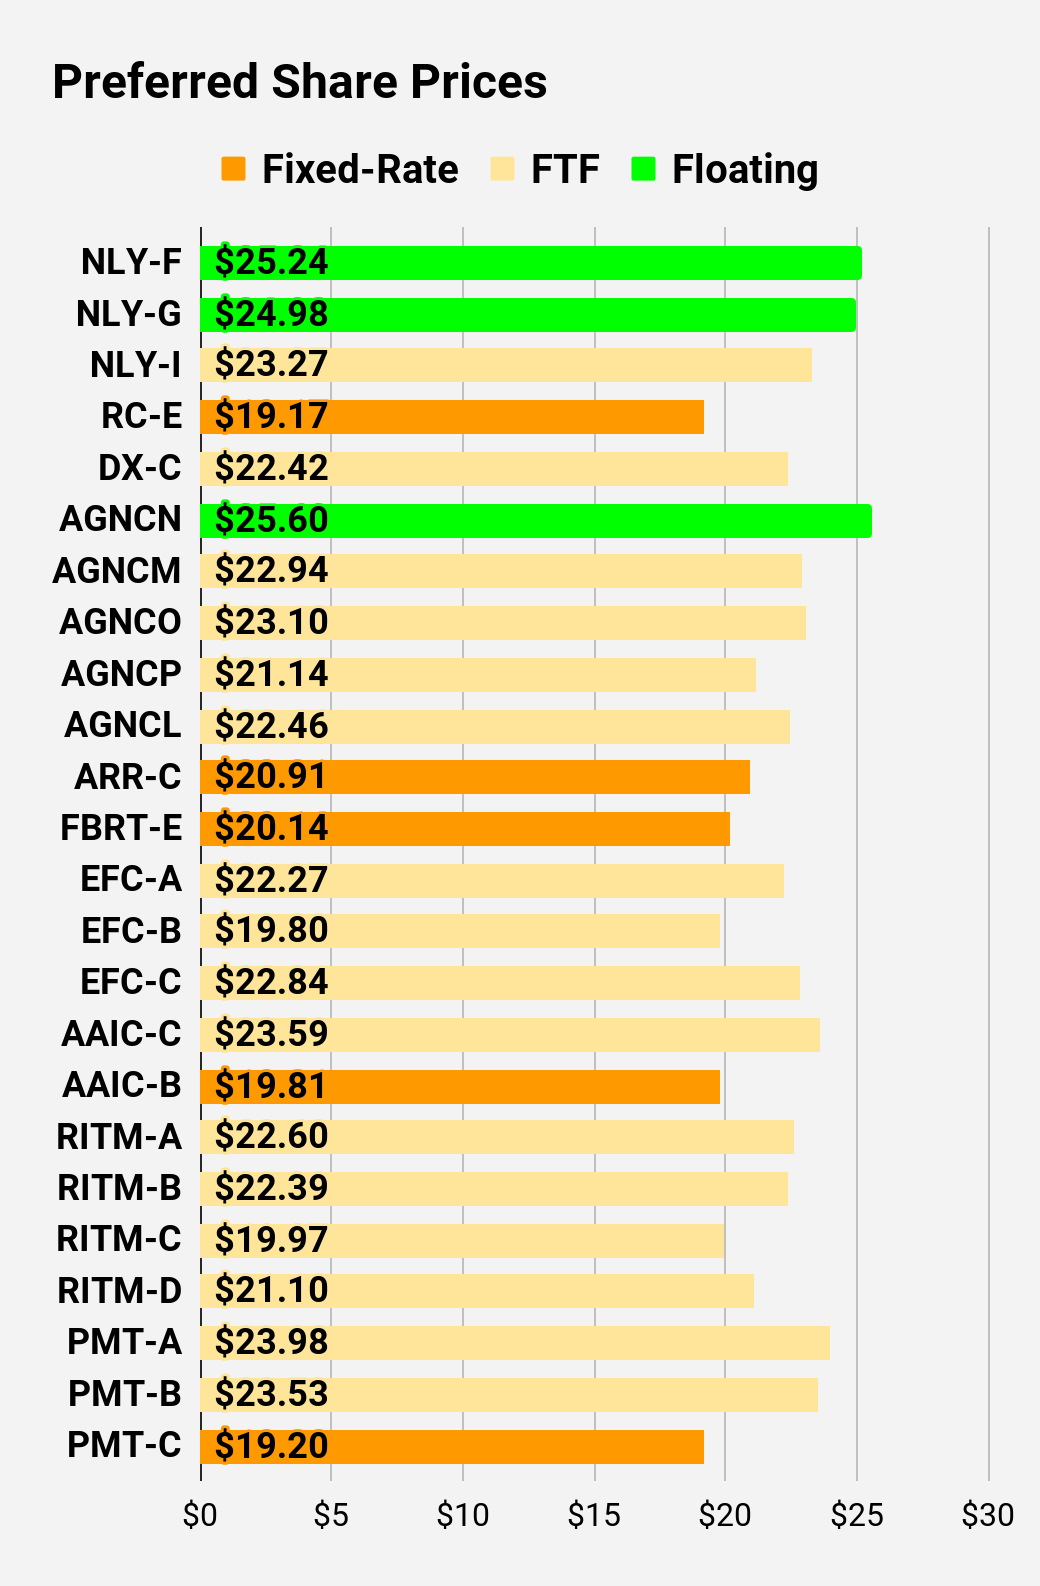
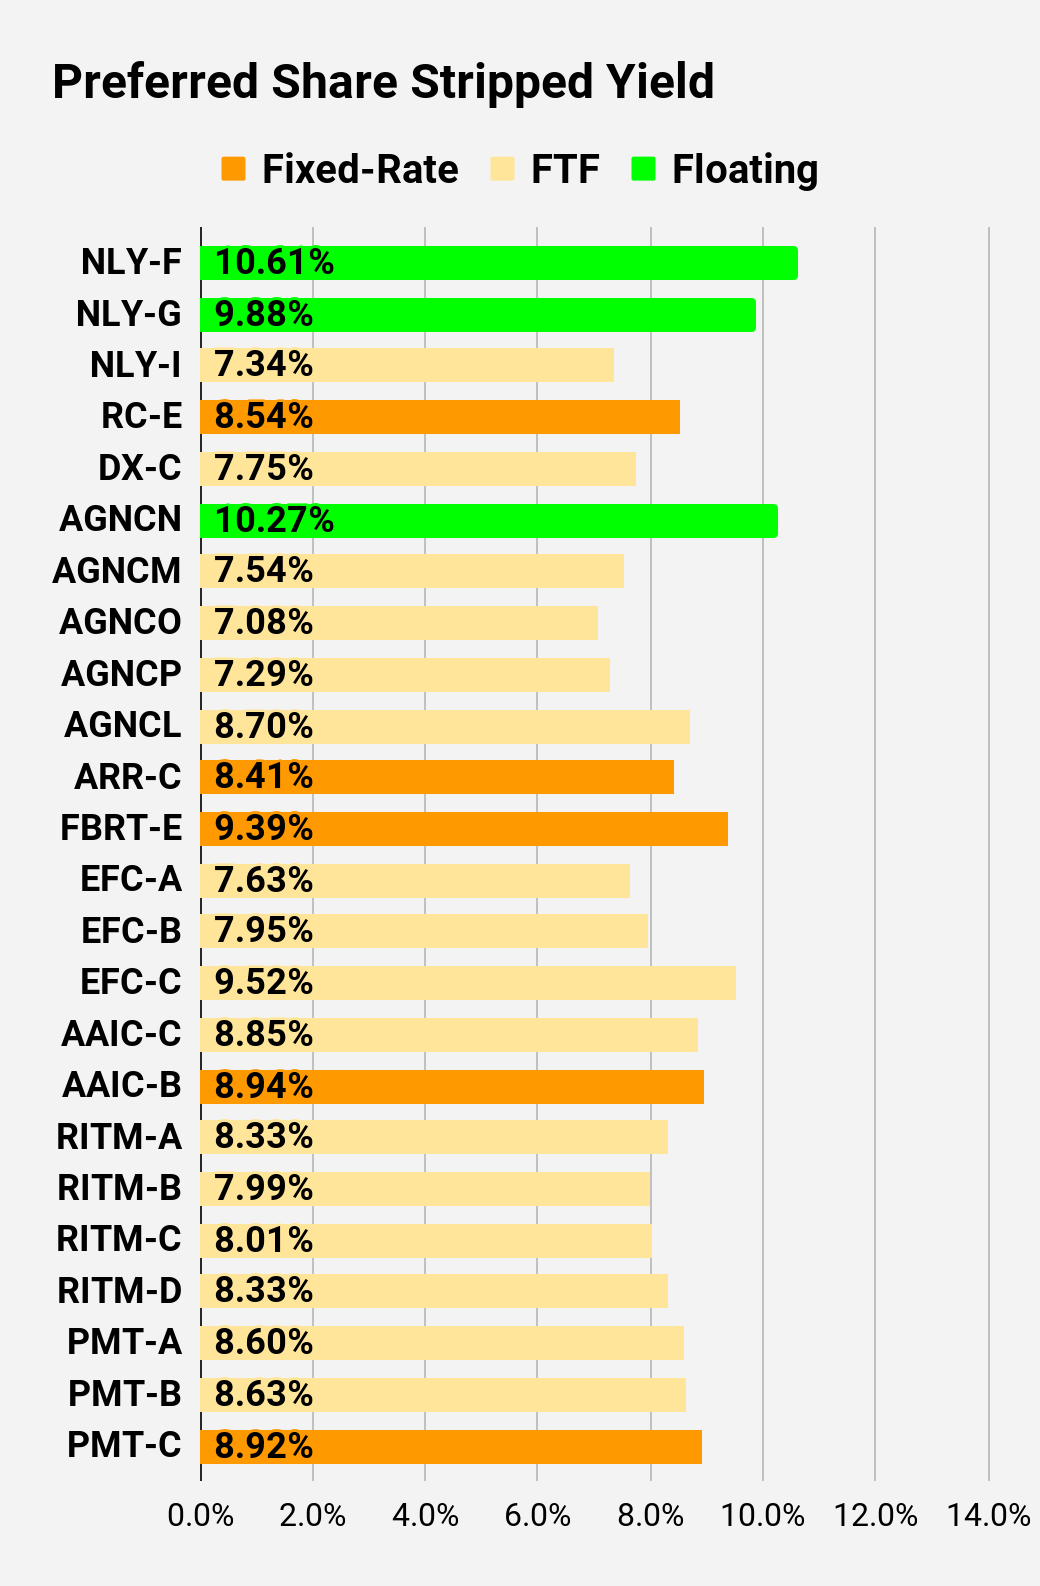
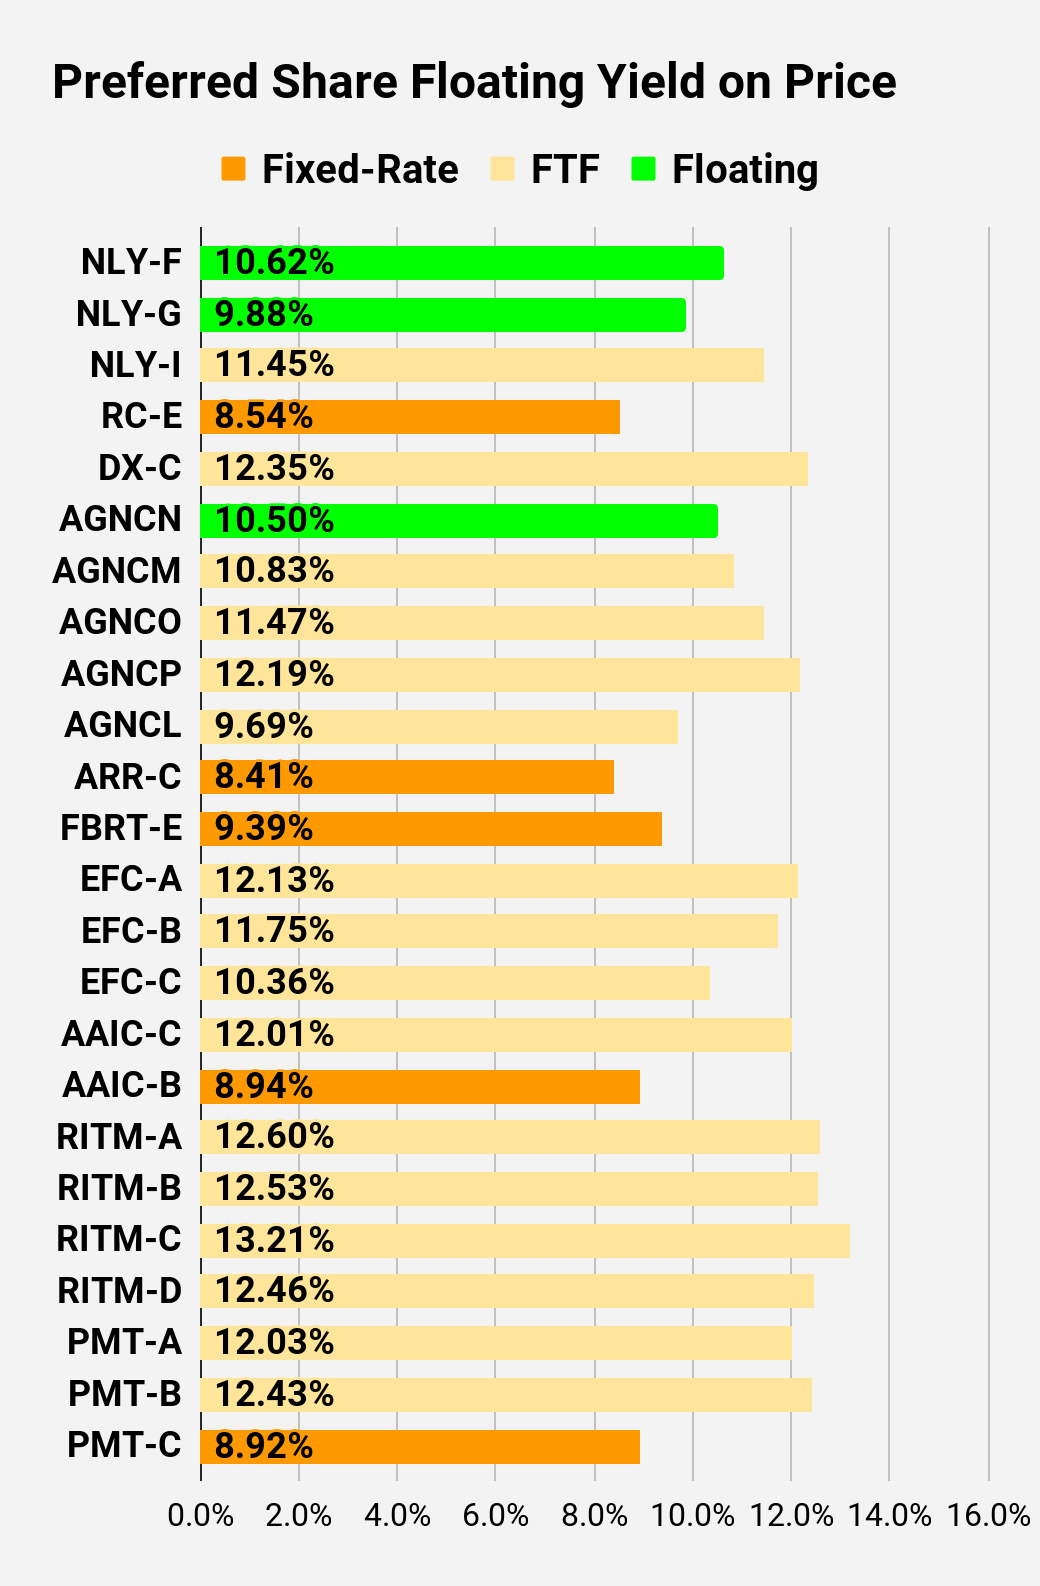
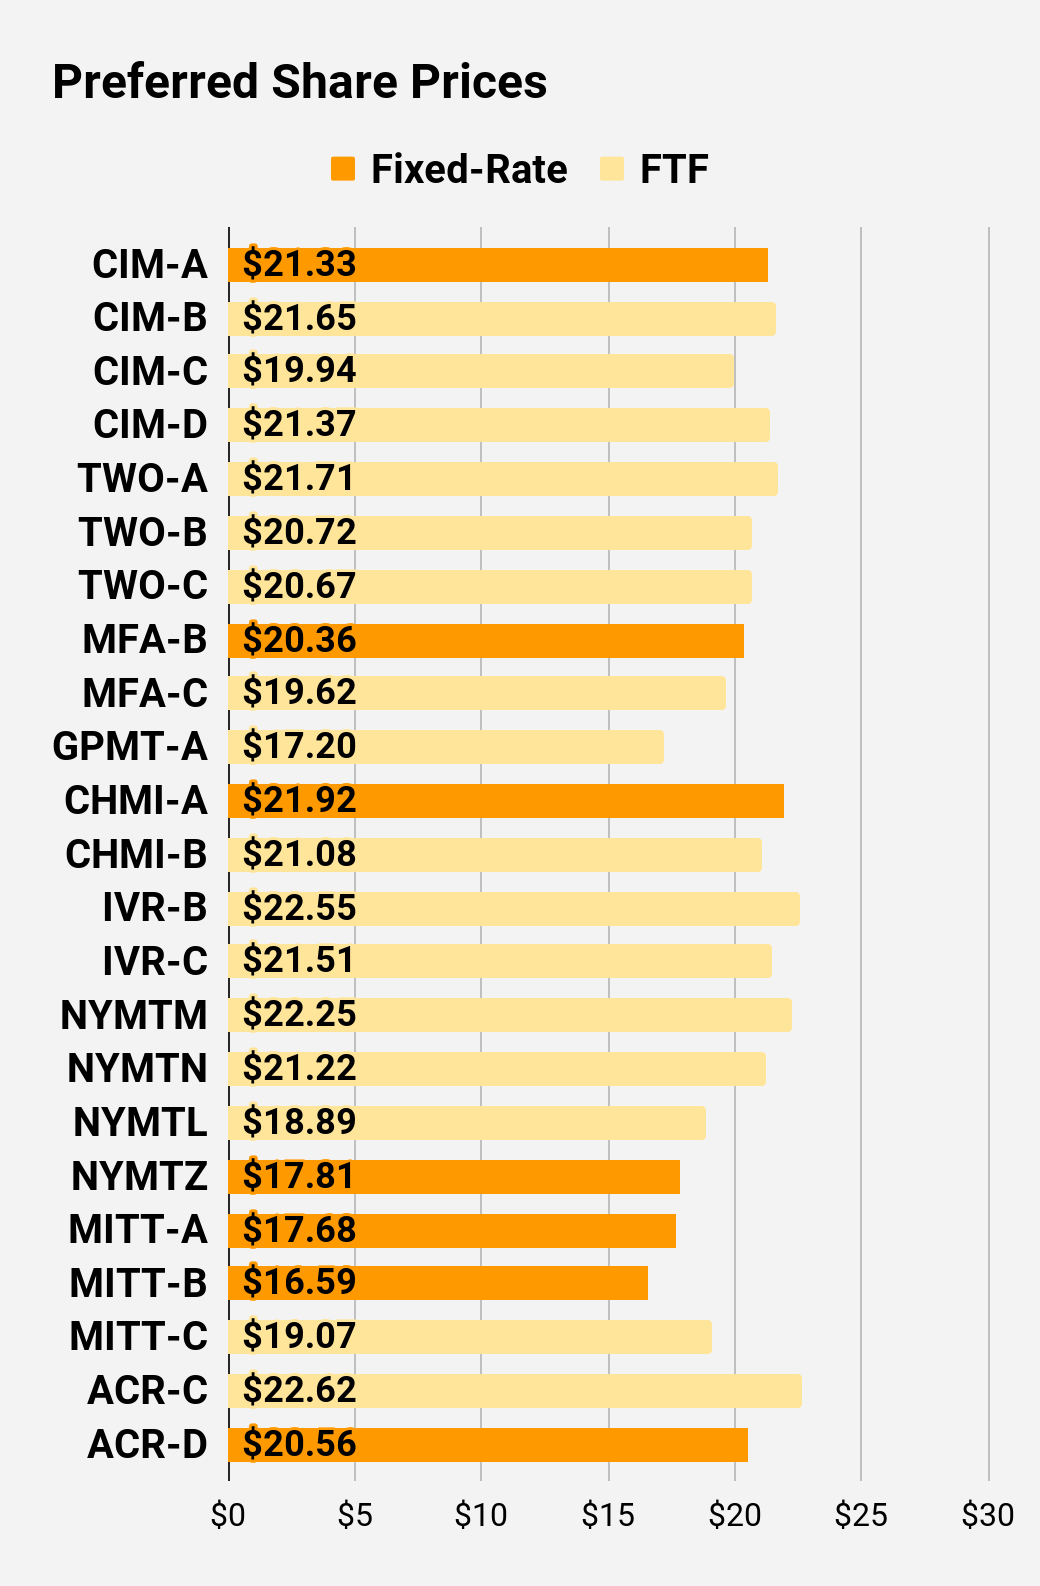
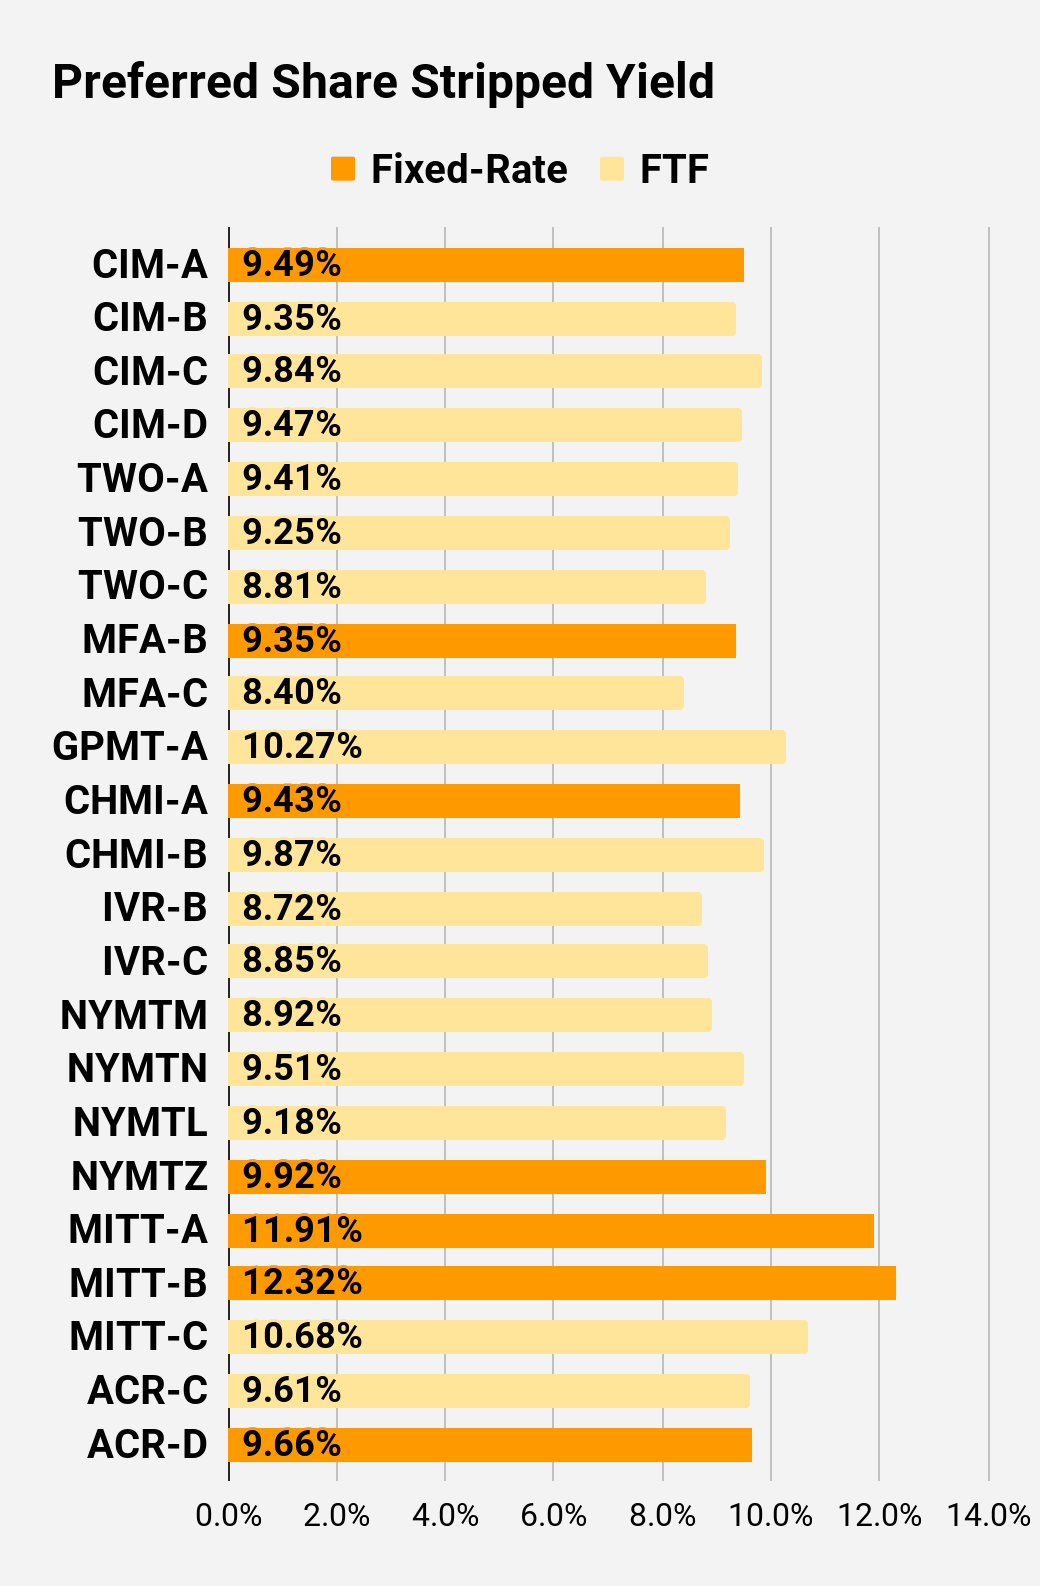
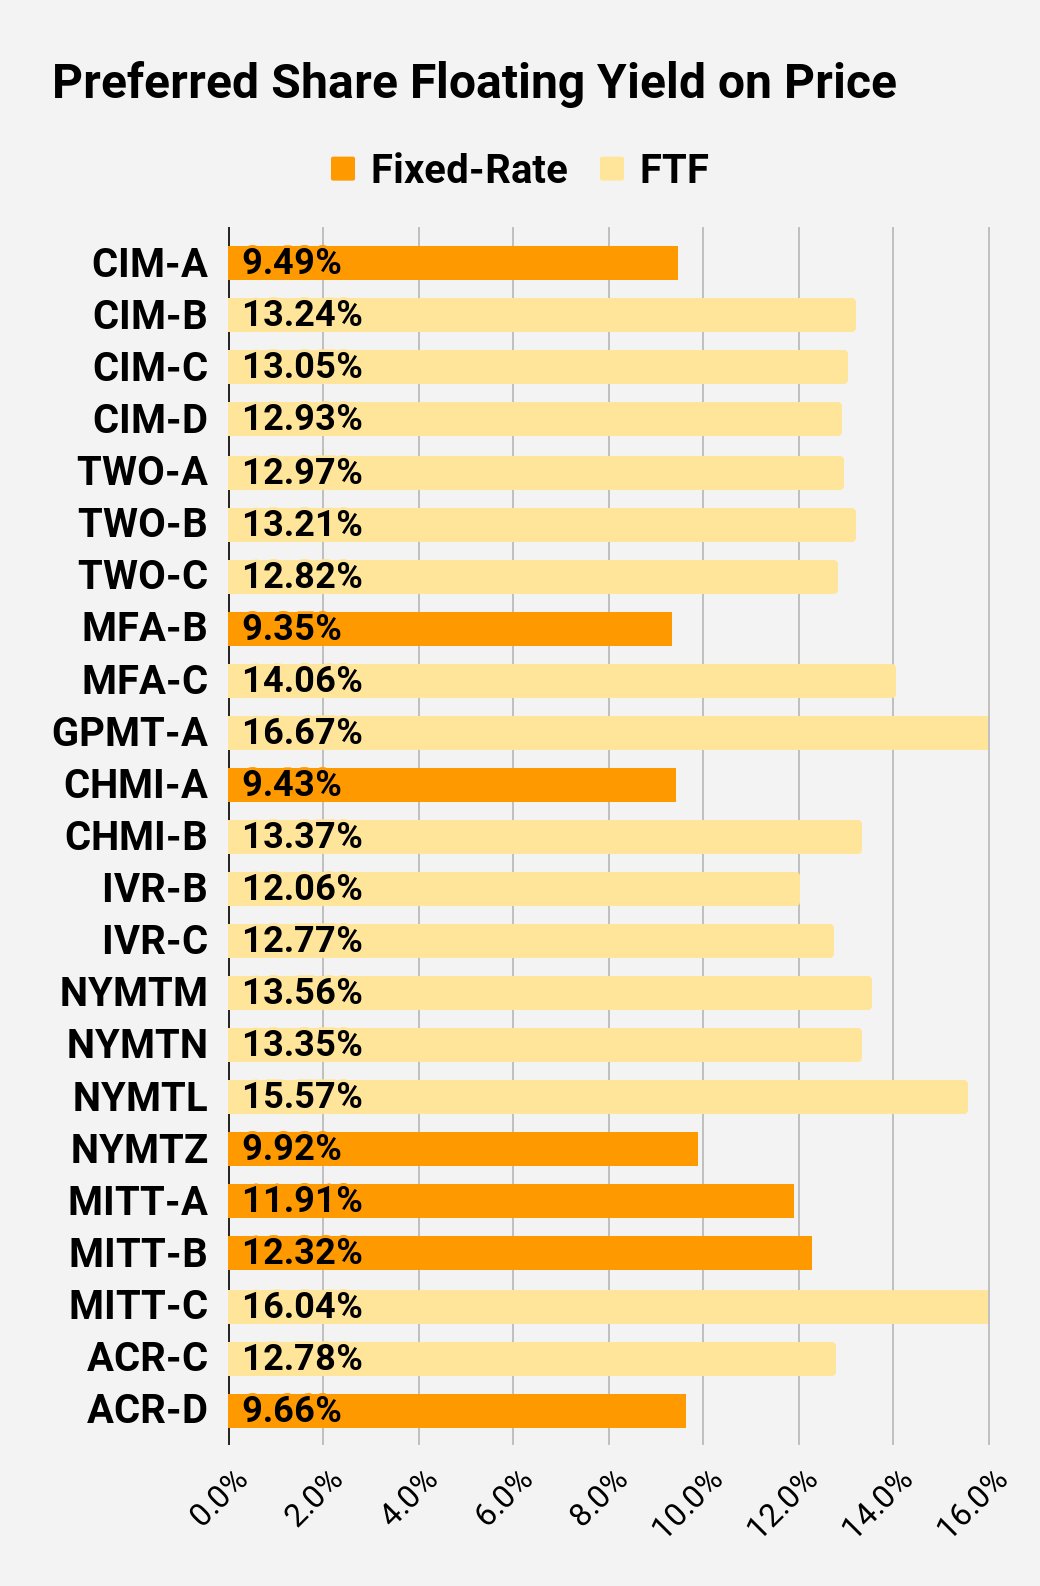
Preferred Share and Baby Bond Charts
I changed the coloring a bit. We needed to adjust to include that the first fixed-to-floating shares have transitioned over to floating rates. When a share already is floating, the stripped yield may be different from the “Floating Yield on Price” due to changes in interest rates. For instance, NLY-F already has a floating rate. However, the rate is only reset once per three months. The stripped yield is calculated using the upcoming projected dividend payment and the “Floating Yield on Price” is based on where the dividend would be if the rate reset today. In my opinion, for these shares the “Floating Yield on Price” is clearly the more important metric.
Preferred Share Data
Beyond the charts, we’re also providing our readers with access to several other metrics for the preferred shares.
After testing out a series on preferred shares, we decided to try merging it into the series on common shares. After all, we're still talking about positions in mortgage REITs. We don’t have any desire to cover preferred shares without cumulative dividends, so any preferred shares you see in our column will have cumulative dividends. You can verify that by using Quantum Online. We’ve included the links in the table below.
To better organize the table, we needed to abbreviate column names as follows:
- Price = Recent Share Price - Shown in Charts
- BoF = Bond or FTF (Fixed-to-Floating)
- S-Yield = Stripped Yield - Shown in Charts
- Coupon = Initial Fixed-Rate Coupon
- FYoP = Floating Yield on Price - Shown in Charts
- NCD = Next Call Date (the soonest shares could be called)
- Note: For all FTF issues, the floating rate would start on NCD.
- WCC = Worst Cash to Call (lowest net cash return possible from a call)
- QO Link = Link to Quantum Online Page
| Ticker |
| Price |
| BoF |
| S-Yield |
| Coupon |
| FYoP |
| NCD |
| WCC |
| QO Link |
| P-Link |
| $23.50 |
| Bond |
| 7.66% |
| 5.00% |
| 7.66% |
| 8/31/2023 |
| $1.61 |
| $25.12 |
| Bond |
| 8.14% |
| 8.00% |
| 8.14% |
| 8/1/2025 |
| $3.89 |
| $23.05 |
| Bond |
| 6.82% |
| 4.75% |
| 6.82% |
| 11/1/2023 |
| $2.25 |
| $24.93 |
| Bond |
| 7.58% |
| 7.00% |
| 7.58% |
| 8/15/2023 |
| $0.05 |
| $23.24 |
| Bond |
| 9.20% |
| 5.75% |
| 9.20% |
| 8/31/2023 |
| $1.88 |
| $23.57 |
| Bond |
| 8.68% |
| 6.20% |
| 8.68% |
| 8/31/2023 |
| $1.56 |
| $24.50 |
| Bond |
| 8.98% |
| 6.75% |
| 8.98% |
| 8/31/2023 |
| $0.84 |
| $23.61 |
| Bond |
| 8.37% |
| 6.00% |
| 8.37% |
| 8/31/2023 |
| $1.51 |
Second batch:
| Ticker |
| Price |
| BoF |
| S-Yield |
| Coupon |
| FYoP |
| NCD |
| WCC |
| QO Link |
| P-Link |
| $25.24 |
| Floating |
| 10.61% |
| 10.52% |
| 10.62% |
| 8/31/2023 |
| $0.21 |
| $24.98 |
| Floating |
| 9.88% |
| 9.70% |
| 9.88% |
| 8/31/2023 |
| $0.43 |
| $23.27 |
| FTF |
| 7.34% |
| 6.75% |
| 11.45% |
| 6/30/2024 |
| $3.42 |
| $19.17 |
| 8.54% |
| 6.50% |
| 8.54% |
| 6/10/2026 |
| $10.49 |
| $22.42 |
| FTF |
| 7.75% |
| 6.90% |
| 12.35% |
| 4/15/2025 |
| $5.60 |
| $25.60 |
| Floating |
| 10.27% |
| 10.42% |
| 10.50% |
| 8/31/2023 |
| -$0.26 |
| $22.94 |
| FTF |
| 7.54% |
| 6.88% |
| 10.83% |
| 4/15/2024 |
| $3.36 |
| $23.10 |
| FTF |
| 7.08% |
| 6.50% |
| 11.47% |
| 10/15/2024 |
| $3.94 |
| $21.14 |
| FTF |
| 7.29% |
| 6.13% |
| 12.19% |
| 4/15/2025 |
| $6.55 |
| $22.46 |
| FTF |
| 8.70% |
| 7.75% |
| 9.69% |
| 10/15/2027 |
| $10.79 |
| $20.91 |
| 8.41% |
| 7.00% |
| 8.41% |
| 1/28/2025 |
| $6.73 |
| $20.14 |
| 9.39% |
| 7.50% |
| 9.39% |
| 8/31/2023 |
| $5.10 |
| $22.27 |
| FTF |
| 7.63% |
| 6.75% |
| 12.13% |
| 10/30/2024 |
| $4.85 |
| $19.80 |
| FTF |
| 7.95% |
| 6.25% |
| 11.75% |
| 1/30/2027 |
| $10.68 |
| $22.84 |
| FTF |
| 9.52% |
| 8.63% |
| 10.36% |
| 4/30/2028 |
| $12.42 |
| $23.59 |
| FTF |
| 8.85% |
| 8.25% |
| 12.01% |
| 3/30/2024 |
| $2.88 |
| $19.81 |
| 8.94% |
| 7.00% |
| 8.94% |
| 8/31/2023 |
| $5.42 |
| $22.60 |
| FTF |
| 8.33% |
| 7.50% |
| 12.60% |
| 8/15/2024 |
| $4.29 |
| $22.39 |
| FTF |
| 7.99% |
| 7.13% |
| 12.53% |
| 08/15/2024 |
| $4.41 |
| $19.97 |
| FTF |
| 8.01% |
| 6.38% |
| 13.21% |
| 02/15/2025 |
| $7.44 |
| $21.10 |
| FTF |
| 8.33% |
| 7.00% |
| 12.46% |
| 11/15/2026 |
| $9.60 |
| $23.98 |
| FTF |
| 8.60% |
| 8.13% |
| 12.03% |
| 3/15/2024 |
| $2.55 |
| $23.53 |
| FTF |
| 8.63% |
| 8.00% |
| 12.43% |
| 6/15/2024 |
| $3.48 |
| $19.20 |
| 8.92% |
| 6.75% |
| 8.92% |
| 8/24/2026 |
| $11.19 |
Third batch:
| Ticker |
| Price |
| BoF |
| S-Yield |
| Coupon |
| FYoP |
| NCD |
| WCC |
| QO Link |
| P-Link |
| $21.33 |
| 9.49% |
| 8.00% |
| 9.49% |
| 8/31/2023 |
| $4.01 |
| $21.65 |
| FTF |
| 9.35% |
| 8.00% |
| 13.24% |
| 3/30/2024 |
| $4.85 |
| $19.94 |
| FTF |
| 9.84% |
| 7.75% |
| 13.05% |
| 9/30/2025 |
| $9.43 |
| $21.37 |
| FTF |
| 9.47% |
| 8.00% |
| 12.93% |
| 3/30/2024 |
| $5.13 |
| $21.71 |
| FTF |
| 9.41% |
| 8.13% |
| 12.97% |
| 4/27/2027 |
| $10.91 |
| $20.72 |
| FTF |
| 9.25% |
| 7.63% |
| 13.21% |
| 7/27/2027 |
| $11.91 |
| $20.67 |
| FTF |
| 8.81% |
| 7.25% |
| 12.82% |
| 1/27/2025 |
| $7.06 |
| $20.36 |
| 9.35% |
| 7.50% |
| 9.35% |
| 8/31/2023 |
| $4.96 |
| $19.62 |
| FTF |
| 8.40% |
| 6.50% |
| 14.06% |
| 3/31/2025 |
| $8.23 |
| $17.20 |
| FTF |
| 10.27% |
| 7.00% |
| 16.67% |
| 11/30/2026 |
| $13.70 |
| $21.92 |
| 9.43% |
| 8.20% |
| 9.43% |
| 8/31/2023 |
| $3.27 |
| $21.08 |
| FTF |
| 9.87% |
| 8.25% |
| 13.37% |
| 4/15/2024 |
| $5.40 |
| $22.55 |
| FTF |
| 8.72% |
| 7.75% |
| 12.06% |
| 12/27/2024 |
| $5.38 |
| $21.51 |
| FTF |
| 8.85% |
| 7.50% |
| 12.77% |
| 9/27/2027 |
| $11.49 |
| $22.25 |
| FTF |
| 8.92% |
| 7.88% |
| 13.56% |
| 1/15/2025 |
| $5.71 |
| $21.22 |
| FTF |
| 9.51% |
| 8.00% |
| 13.35% |
| 10/15/2027 |
| $12.29 |
| $18.89 |
| FTF |
| 9.18% |
| 6.88% |
| 15.57% |
| 10/15/2026 |
| $11.70 |
| $17.81 |
| 9.92% |
| 7.00% |
| 9.92% |
| 1/15/2027 |
| $13.32 |
| $17.68 |
| 11.91% |
| 8.25% |
| 11.91% |
| 8/31/2023 |
| $7.71 |
| $16.59 |
| 12.32% |
| 8.00% |
| 12.32% |
| 8/31/2023 |
| $8.79 |
| $19.07 |
| FTF |
| 10.68% |
| 8.00% |
| 16.04% |
| 9/17/2024 |
| $8.40 |
| $22.62 |
| FTF |
| 9.61% |
| 8.63% |
| 12.78% |
| 7/30/2024 |
| $4.54 |
| $20.56 |
| 9.66% |
| 7.88% |
| 9.66% |
| 5/21/2026 |
| $9.97 |
Strategy
Our goal is to maximize total returns . We achieve those most effectively by including “trading” strategies. We regularly trade positions in the mortgage REIT common shares and BDCs because:
- Prices are inefficient.
- Long term, share prices generally revolve around book value.
- Short term, price-to-book ratios can deviate materially.
- Book value isn’t the only step in analysis, but it is the cornerstone.
We also allocate to preferred shares and equity REITs. We encourage buy-and-hold investors to consider using more preferred shares and equity REITs.
Outlook: Bullish on RC, Bearish on AGNC
For further details see:
1 Fat Yielder To Buy And 1 To Dump