BSFFF - 1 Main Capital Partners Q4 2022 Fund Letter
Summary
- 1 Main Capital is a long-biased investment partnership that invests primarily in high quality, attractively valued, growing businesses.
- For the fourth quarter, 1 Main Capital Partners returned 12.2% net of fees and expenses.
- For now, the possibility of a soft landing still appears to be in the cards.
Dear Partners,
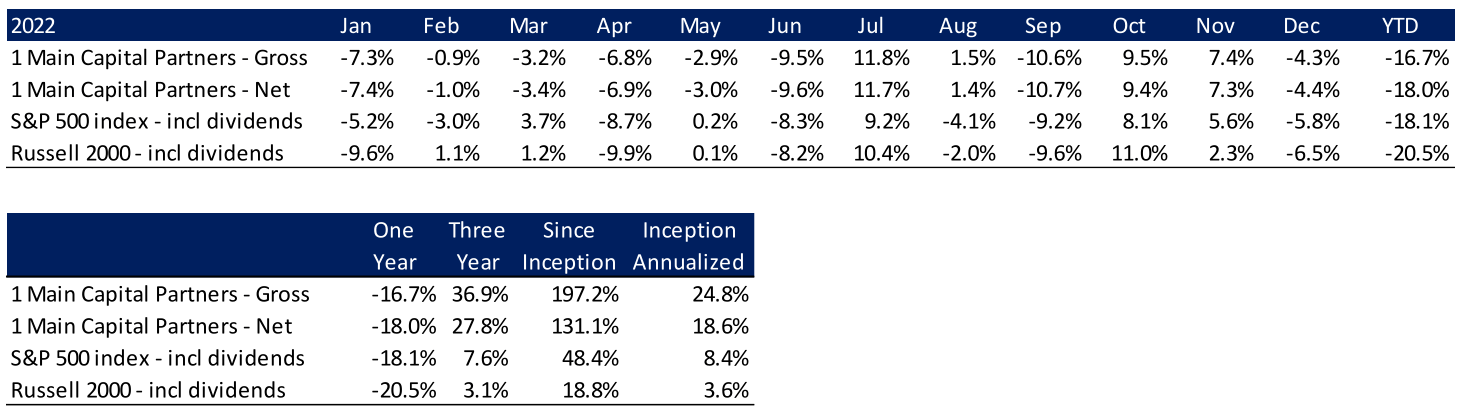
For the fourth quarter, 1 Main Capital Partners, L.P. (the “Fund”) returned 12.2% net of fees and expenses [1] , bringing its year-to-date return to (18.0%). Since its inception nearly five years ago, the Fund has delivered an annualized net return of 18.6%, compared to 8.4% for the S&P 500 ( SPX ) and 3.6% for the Russell 2000 ( RTY ).
Following three years of strong returns for risk assets, the tides turned in 2022 as the consensus view on inflation morphed from transitory to persistent. In response, central banks raised rates, prompting a reversal of growth expectations from calls for a roaring 20's into worries over a prolonged recession.
Persistent inflation with weak economic growth generally means lower multiples on lower corporate earnings, a combination that makes investors shudder. Not surprisingly, most assets performed poorly. Global stocks shed $20 trillion of value in 2022, declining approximately 20% for the year.
Bonds disappointed too. 30-year US government bond yields rose to a decade-high of 4.4% in 2022, ending the year at just under 4%, a stark increase from the less than 1% they yielded in March 2020. The market value of negative yielding debt ended the year at just $24 b illion, down from $18 t rillion at the end of 2020. High yield credit spreads rose from 3% at the start of the year to 5% at the end of the year.
With equities and bonds both down on the year, the traditional 60/40 portfolio declined 17%, leaving investors with few places to hide. Of course, there are some strategies that performed well in the year – including those focused on commodities, macro or shorting stocks.
Just like I did not pivot the Fund into growth at any price in 2020-21, I have not pivoted the fund into these currently in-vogue strategies in 2022. In my view, chasing the highest near-term performance in any given year comes with increased risk of steep and irrecoverable capital losses which are detrimental to longterm compounding.
Instead, I am sticking to our strategy of owning a collection of growing, high-quality, well capitalized, and well-managed businesses - with a strong emphasis on attractive entry valuations. I believe this is the best way to achieve the Fund’s goal, which is to generate strong returns over the full course of five, ten and twenty years; it’s a marathon after all, not a sprint.
Five Years In
The end of January marks the Fund’s five-year anniversary. Since inception, I have done plenty well and made mistakes. Fortunately, the mistakes have been manageable, as I have avoided excessive leverage, concentration, and cash burning companies.
With more repetition comes better intuition and I can say with confidence that my instincts are improved compared to early 2018. I am better at analyzing businesses, evaluating management, sizing positions, and managing risk.
Along the way, I have enhanced the Fund’s investment process, increasing the value placed on management and business quality (greatly) and reducing the value placed on valuation (only marginally).
The pace at which I filter through ideas has accelerated and the Fund’s actionable watchlist grows longer by the day. Similarly, my network has also grown wider, allowing me to collect relevant pushback or supportive/refutative datapoints about businesses that I follow.
While the core strategy remains largely unchanged, I will continuously refine the screening and diligence process. Since inception, our big winners have shared many characteristics. I believe the process that led me to them is repeatable and scalable, which makes me significantly more optimistic today about the Fund’s long-term prospects than I was when I first launched it. Cheers to the next five.
Recognizing Mistakes, Improving the Process
In the Q3 letter , where I highlighted what the perfect investment looks like, I asserted that “valuation matters because all companies eventually trade at or below the market multiple.”
Of course, that statement was not meant to suggest that any investment I make for the Fund must trade at a below market multiple today . I simply meant that I needed to believe that an investment could generate strong returns if it trades at a below market multiple at some point within our underwriting horizon (usually 3-5 years out).
One notable mistake was the Fund’s investment in FIGS . When I initiated the position, I believed that we would generate strong returns using a market multiple 5 years out. However, I overestimated what the company’s future profits could look like in my base case, in hindsight. Said another way: what I believed to be reasonable assumptions at the time of underwriting, now appear not-so-reasonable after all.
My primary miscalculation was on the number of orders per average active customer. I assumed the figure would normalize from covid-levels back to pre-covid levels. However, the figure is now ~15% below precovid levels and may still be declining, which makes it tough to gauge how much lower it can go. Management also believed the company would grow significantly faster in recent periods than it has (and has the inventory on hand to show for it).
I still very much believe in FIGS long-term, but this change (and several others) led me to significantly reduce my projections for the company’s revenues and profits, which in turn led me to exit our investment for a loss. The position cost us 3% last year. Being wrong with the crowd doesn’t make the losses sting any less. Fortunately, public markets allow investors to exit positions as soon as they realize that a thesis is broken. Better yet, when mistakes happen during bear markets, the associated losses are significantly less painful than in normal times, since the proceeds of a mistake can be recycled into new investments that are also down significantly.
To reduce the risk of another FIGS, going forward the Fund will require a higher return when making investments that have inherently wider-than-average range of outcomes. While I am normally looking for three-year-doubles, I will now demand a three-year-triple from high-growth or leveraged businesses, before initiating a position. This way, a larger than usual downward revision in my estimates could be absorbed with sufficient reason to remain invested.
Of course, losses will still occur, but I will continue to improve the Fund’s process after each one. Fortunately, we never got too concentrated in or exposed to high-growth companies, many of which saw their stocks suffer similar fates to (or worse than) FIGS. I guess I already knew this lesson before having formalized the process improvement that should ensure additional protection for us going forward.
When Facts Change
Heading into 2022 the Fund owned investments that could be characterized as cyclical, discretionary and interest rate sensitive. My prevailing view on these holdings was that they were high-quality, well-run, well-capitalized, and cheap (both on midcycle and NTM earnings). I fully expected earnings headwinds as the interest rate environment normalized in future years but thought that the businesses could navigate a steady rise in rates. What I did not expect, was a parabolic rise in rates combined with a widening of credit spreads that could lead to a significant slowdown in big ticket, financed purchases. While I still believe these businesses will successfully navigate the environment, there is no doubt things have become more challenging for them. Sometimes, it makes sense to sell an attractive investment to reinvest the proceeds into an even more attractive one. I am always re-underwriting our holdings and comparing them not only against each other, but against our watch list as well. Every position must earn its spot on the field every day. Currently, the Fund no longer holds positions in these types of companies, but I they remain on our watchlist. I will of course follow them closely and wouldn’t be surprised if we got an opportunity to re-initiate positions in some of them in the future.
Top 5 Positions
As of December 31 st , the Fund’s top 5 positions were APi Group ( APG ), Basic-Fit ( BSFFF ), IWG PLC ( IWGFF ), KKR & Co ( KKR ) , Pershing Square Holdings ( PSHZF ). Together, these holdings accounted for nearly 55% of the Fund’s capital. I have written about most of these positions in the past (links above) and am always happy to discuss any of our holdings so if you have questions please reach out.
During the quarter, I increased the Fund’s positions in BFIT after it sold off significantly. IWG and APG, which were both established in Q3 appreciated into top 5 positions in the period.
APi Group ( APG )
APi Group is leading provider of Safety Services (70% of sales) and Specialty Services (30 % of sales) for businesses globally that came public in 2019 when it was acquired by a Martin Franklin SPAC. Franklin, who oversaw a 5,000x return at Jarden in the 15 years leading up to its 2016 sale for $13 billion, is one of the few SPAC sponsors who has consistently delivered strong results for investors.
In Safety Services, 65% of segment revenue comes from fire safety, where the company designs, fabricates, installs maintains, and upgrades fire detection and suppression systems. A significant portion of these revenues are covered by statutory or insurance requirements to have systems inspected annually. Typically, every $1 of inspection revenue drives $3-4 of incremental repair & upgrade revenues.
The remaining 35% of Safety Services segment revenues come from security systems (installation and maintenance of access control, surveillance, alarm systems), and a small focus on HVAC systems.
In Specialty Services, the company primarily designs, fabricates, installs maintains, and upgrades underground gas, water, telecom, and energy infrastructure.
APG needs very little capital to support its growth, which has historically averaged 7% organically. Because of this, the company has been able to reinvest its cash flow into accretive tuck-ins, typically purchased for 5-7x EBITDA.
In early 2022, the company acquired Chubb Fire & Safety for $3 billion from Carrier Global, adding 50%+ to the top line. Chubb was neglected under its prior ownership, reporting EBITDA margins 700-800 basis points below APG’s Safety Services segment.
In addition to offering margin upside on a mismanaged asset, the Chubb acquisition increased APG’s recurring service mix to 50% of sales, up from 40% in 2019 (15% in 2008). It also added geographic diversification to the business, which went from being primarily North America based, to having 30% of revenues coming from Europe and 10% from Asia Pacific.
During 2022, the company’s shares suffered from fears that it took on floating rate USD debt just as rates rose, to buy a European asset at the top of the economic cycle just as the Euro weakened. Additionally, the company’s FCF conversion declined meaningfully as it began to restructure the acquired operations.
Fortunately, a colleague who is invested in APG invited me to breakfast with its CEO in early March, where I had an opportunity to better understand and act on the opportunity when the shares sold off.
Since initiating the position, APG’s cash conversion has shown steady improvement (Q3 reported and Q4 guided) while EU fears have subsided. Management also guided to a nearly $100 million reduction in separation costs in 2023 and increased its 2025 synergy target for Chubb from $40 million to $100.
While APG’s balance sheet is more leveraged than I am typically comfortable with, its business is very resilient. In 2020, adjusted EBITDA was down just 3% YoY despite the COVID lockdowns. In 2022, APG was able to raise constant currency guidance throughout the year, while many cyclical industrials guided lower. The statutory nature of its revenue base, revenue diversification and strong cash conversion makes it likely that APG will weather future economic slowdowns while continuing to reduce leverage.
Looking forward, I believe the company will significantly de-lever in the next few years and that it should generate $2.25-2.50 of EPS by 2027. If by 2026 it trades for a market multiple on those figures, it should still double from current levels, and we will have generated a four-year-triple on the investment.
Outlook
In the Q2 letter , I suggested that to continue owning risk assets investors had to believe that central banks would do whatever it takes to squash inflation, even if it means pushing the economy into a recession.
Since then, the Fed has taken short term rates above 4% and is expected to increase them to 5% sometime in 2023. The hope is that it can pause the rate hikes at this level and that it is enough to slow the economy just enough to reduce inflation, without tipping us into a severe recession.
On one hand, if the economy slows too rapidly at 5%, investors fear that corporate earnings would be under pressure and central banks would resort to rate cuts, which would risk reigniting inflation.
On the other hand, if the economy doesn’t slow enough at 5%, investors fear that substantially higher rates would be needed to slow inflation – which would of course be damaging for risk assets.
For now, the possibility of a soft landing still appears to be in the cards. Goods inflation has already rolled over and is expected to fully normalize. Services inflation remains too high but is currently slowing. However, the unemployment rate remains at cyclical lows while the number of job openings remains elevated, which indicates the labor market is still too tight. Of course, higher rates take time to flow through the system so the totality of the impact from higher rates is yet to be seen.
I do not have a crystal ball, so will refrain from speculating on whether a soft landing will be achieved. Instead, I’ll assert that S&P 500 market posts positive returns in seven out of ten years, on average. Last year brought meaningful declines to the value of most risk assets. Markets are forward looking and have already priced in a lot of pessimism.
As such, I continue to keep the Fund invested, but with a portfolio structured to withstand any economic environment. This means owning businesses with strong balance sheets, solid growth prospects, and competent / aligned management at attractive valuations. As always, I am excited to see what the future has in store for the Fund.
Thank you for your continued support and confidence. Please reach out with any questions at yaron@1maincapital.com or 305-710-8509.
Sincerely,
Yaron Naymark
Monthly Performance Summary [2]
IMPORTANT DISCLOSURESIn general . This disclaimer applies to this document and the verbal or written comments of any person presenting it (collectively, the “ Report ”). The information contained in this Report is provided for informational purposes only and does not contain certain material information about 1 Main Capital Partners, L.P. (the “ Fund ”), including important disclosures and risk factors associated with an investment in the Fund, and no representation or warranty is made concerning the completeness or accuracy of this information. To the extent that you rely on the Report in connection with an investment decision, you do so at your own risk. Certain information contained herein was obtained from or provided by third-party sources; although such information is believed to be accurate, it has not been independently verified. The information in the Report is provided to you as of the dates indicated and 1 Main Capital Management, LLC and its affiliates (collectively, the “ Manager ”) do not intend to update the information after its distribution, even in the event the information becomes materially inaccurate. No offer to purchase or sell securities . This Report does not constitute an offer to sell, or the solicitation of an offer to buy, and may not be relied upon in connection with the purchase of any security, including an interest in the Fund or any other fund managed by the Manager. Any such offer would only be made by means of such fund’s formal private placement documents, the terms of which shall govern in all respects. Performance Information . Unless otherwise noted, any performance numbers used in the Report are for the Fund’s Class A Interests, and are net of any accrued incentive allocation, management fees and other applicable expenses, include the reinvestment of dividends, interest and capital gains, and assume an investment from inception of such Class. As such, the performance numbers do not reflect the performance of any particular investor’s interest and you should not rely on it as a statement of your actual return. Past performance . In all cases where historical performance is presented, please note that past performance is not a reliable indicator of future results and should not be relied upon as the basis for making an investment decision. Risk of loss . An investment in the Fund will be highly speculative, and there can be no assurance that the Fund’s investment objective will be achieved. Investors must be prepared to bear the risk of a total loss of their invested capital. Portfolio Guidelines/Construction . Information contained in this Report, especially as it pertains to portfolio characteristics, construction, profiles or investment strategies or objectives, reflects the Manager’s current thinking based on normal market conditions, and may be modified in response to the Manager’s perception of changing market conditions, opportunities or otherwise, in the Manager’s sole discretion, without further notice to you. Any target strategies, objectives or parameters are not projections or predictions and are presented solely for your information. No assurance is given that the Fund will achieve its investment strategies, objectives or parameters. Index Performance . The index comparisons are provided for informational purposes only. The S&P 500 Total Return Index ( SPXT ) is a capitalization weighted index that is designed to measure the performance of the broad U.S. economy through changes in the aggregate market value of 500 stocks representing all major industries. There are significant differences between the Fund and the index referenced, including, but not limited to, risk profile, liquidity, volatility and asset composition. The index reflects the reinvestment of dividends and other income, are unmanaged, and do not reflect a deduction for advisory fees. An investor may not invest directly into an index. For the foregoing and other reasons, the performance of the index may not be comparable to the Fund’s and should not be relied upon in making an investment decision with respect to the Fund. No tax, legal, accounting or investment advice . The Report is not intended to provide, and should not be relied upon for, tax, legal, accounting or investment advice. Logos, trade names, trademarks and copyrights . Certain logos, trade names, trademarks and/or copyrights (collectively, “ Marks ”) contained herein are included for identification and informational purposes only. Such Marks may be owned by companies or persons that are not affiliated with the Manager or any the Manager managed fund and no claim is made that any such company or person has sponsored or endorsed the use of such Marks in the Report. Confidentiality/Distribution of the Report . The information in this Report is confidential. By accepting any portion of the Report, you agree that you will treat the Report confidentially. It is intended only for the use of the person to whom it is given and the Manager expressly prohibits its redistribution without the Manager’s prior written consent. The Report is not intended for distribution to, or use by, any person or entity in any jurisdiction or country where such distribution or use is contrary to law, regulation or rule. |
Footnotes[1] Performance data is presented for the Fund’s Class A Interests, and is net of any accrued incentive allocation, management fees and other applicable expenses (as disclosed in the Fund’s Confidential Private Offering Memorandum), include the reinvestment of dividends, interest and capital gains, and assume an investment from inception. Returns for month-end and year to date 2022 are estimated, and un-audited. For investor specific returns, please refer to your capital statements. Due to the format of data available for the time periods indicated, net returns are difficult to calculate precisely. Please see the last page for important disclosure information. [2] Performance Data is presented for the Fund’s Class A Interests, and are net of any accrued incentive allocation, management fees and other applicable expenses (as disclosed in the Fund’s Confidential Private Offering Memorandum), include the reinvestment of dividends, interest and capital gains, and assume an investment from inception. Returns for month-end and year to date 2022 are estimated, and un-audited. For investor specific returns, please refer to your capital statements. Due to the format of data available for the time periods indicated, net returns are difficult to calculate precisely. Please see the last page for important disclosure information. |
Editor's Note: The summary bullets for this article were chosen by Seeking Alpha editors.
For further details see:
1 Main Capital Partners Q4 2022 Fund Letter