ABNB - 10 Attractive Growth Stocks For May 2023
2023-05-10 18:00:00 ET
Summary
- Growth Companies often come attached to a high level of risk for investors, particularly when high growth expectations are priced into the stock price.
- In today’s article, I will provide you with 10 growth companies that I consider to be appealing for investors.
- All of these picks have strong competitive advantages, are financially healthy, have shown strong results in terms of Growth within the past 5 years, and their Valuation is relatively attractive.
Investment Thesis
Growth companies can be particularly attractive for investors, since they can help you to gain significant capital gains. However, you need to be careful when investing in growth companies, since it is often the case that high growth expectations have been priced into their stock price.
This means that if these companies do not achieve their growth expectations, it can have a significant effect on its stock price. Therefore, I suggest limiting the proportion of growth companies in your overall portfolio.
In order to help you find attractive growth companies, I have used a filter process, which should help you to find growth companies that have significant competitive advantages, a strong financial health, a relatively attractive Valuation and that have shown strong results in terms of Growth within the past years.
In the following, I will describe the selection process in greater detail. In case you are already familiar with this process , you can skip the section written in italic.
First step of the Selection Process: Analysis of the Financial Ratios
In order to identify attractive growth companies, I have used a filter process to make a pre-selection. From this pre-selection, I then select my top 10 growth companies of the month. The companies should fulfil the following requirements in order to become part of the pre-selection:
- Market Capitalization > $5B [changed from $10B]
- P/E [FWD] Ratio < 100
- Average Revenue Growth Rate over the past 3 years > 6% [changed from 8%]
- Average EBITDA Growth Rate over the past 3 years > 6% [changed from 8%]
- EBIT Margin [TTM] > 0%
You may wonder why the P/E [FWD] Ratio should not be below 100 when selecting attractive growth companies. If this maximum P/E Ratio was significantly lower, it would lead to the exclusion of companies that have historically had a very high P/E Ratio, and could still turn out to be excellent long-term investments. An example would be Amazon ( AMZN ) , which has shown an Average P/E [FWD] Ratio of 194.07 over the last 5 years. Nevertheless, the Valuation of the majority of the final selected companies is well below this P/E [FWD] Ratio of 100.
The Average Revenue Growth Rate and EBITDA Growth Rate of more than 6% [changed from 8%] contribute to only selecting companies that have shown significant growth within the past years and therefore justify their designation as a growth stock.
An EBIT Margin of more than 0% helps to only select those growth stocks that are profitable. This contributes to reducing the risk level of your investment and to decrease the probability of losing the money you invest.
Second step of the selection process: Analysis of the Competitive Advantages
In a second step, the companies’ competitive advantages (for example: brand image, innovation, technology, economies of scale, etc.) are analyzed in order to make an even narrower selection. I consider it to be particularly important for companies to have strong competitive advantages in order to stand out against the competition in the long term. Companies without strong competitive advantages have a higher probability of going bankrupt one day, thus representing a strong risk for investors to lose their invested money.
Third step of the selection process: The Valuation of the companies
In the third step of the selection process, I will dive deeper into the Valuation of the companies.
In order to conduct the Valuation process, I use different methods and criteria, for example, the companies’ current Valuation as according to my DCF Model, the expected compound annual rate of return as according to my DCF Model and/or a deeper analysis of the companies’ P/E [FWD] Ratio. These metrics should serve as an additional filter to only select companies that currently have an attractive Valuation, which helps you to identify companies that are at least fairly valued.
The Fourth and final step of the selection process: Diversification over Industries and Countries
In the fourth and final step of the selection process, I have established the following rules for choosing my top picks: in order to help you diversify your investment portfolio, a maximum of two companies should be from the same industry. In addition to that, there should be at least one pick that is from a company that is based outside of the United States, serving as an additional geographical diversification.
New Companies Compared to the Previous Month's List
10 Growth Companies to Invest in for May 2023
- Adobe ( ADBE )
- Airbnb
- Alphabet ( GOOG ) ( GOOGL )
- Amazon
- Broadcom ( AVGO )
- MercadoLibre
- Novo Nordisk
- Salesforce ( CRM )
- Tesla ( TSLA )
- Waste Management
Overview of the Selected Growth Companies for May 2023
| Company Name |
| Sector |
| Industry |
| Country |
| P/E FWD Ratio |
| Revenue Growth 3Y |
| EBIT Margin |
| Adobe |
| Information Technology |
| Application Software |
| United States |
| 21.81 |
| 15.57% |
| 33.91% |
| Airbnb |
| Consumer Discretionary |
| Hotels, Resorts and Cruise Lines |
| United States |
| 33.09 |
| 20.46% |
| 22.54% |
| Alphabet |
| Communication Services |
| Interactive Media and Services |
| United States |
| 19.87 |
| 19.53% |
| 25.35% |
| Amazon |
| Consumer Discretionary |
| Broadline Retail |
| United States |
| 68.23 |
| 21.00% |
| 2.54% |
| Broadcom |
| Information Technology |
| Semiconductors |
| United States |
| 14.73 |
| 14.93% |
| 44.39% |
| MercadoLibre |
| Consumer Discretionary |
| Broadline Retail |
| Uruguay |
| 68.78 |
| 66.03% |
| 11.01% |
| Novo Nordisk |
| Health Care |
| Pharmaceuticals |
| Denmark |
| 30.46 |
| 14.15% |
| 43.27% |
| Salesforce |
| Information Technology |
| Application Software |
| United States |
| 26.88 |
| 22.40% |
| 5.93% |
| Tesla |
| Consumer Discretionary |
| Automobile Manufacturers |
| United States |
| 46.1 |
| 48.97% |
| 14.82% |
| Waste Management |
| Industrials |
| Environmental and Facilities Services |
| United States |
| 27.74 |
| 8.77% |
| 17.40% |
| Average |
| 35.77 |
| 25.18% |
| 22.12% |
Source: The Author, data from Seeking Alpha
Adobe
In terms of Growth, Adobe has produced excellent results within the past years: the company has shown an Average Revenue Growth Rate of 18.10% over the past 5 years and an Average EPS Diluted Growth Rate [FWD] of 23.84% over the same time period.
Adobe is also an attractive pick when considering Profitability: the company’s Gross Profit Margin [TTM] of 87.66% stands 77.21% above the Sector Median of 49.47% and its EBITDA Margin [TTM] of 37.34% lies 303.57% above the Sector Median (9.25%).
In addition to the above, I consider Adobe to be currently undervalued, since its P/E [FWD] Ratio of 30.16 lies 34.87% below its Average from over the past 5 years. Its Price / Sales [FWD] Ratio of 7.98 stands 40.04% below its Average over the same time period, which can be interpreted as an additional indicator of the company being undervalued.
The Seeking Alpha Quant Ranking, which you can find below, confirms that Adobe is currently an attractive pick for investors. The company is ranked 8 th out of 209 within the Application Software Industry, 25 th out of 590 within the Information Technology Sector and 261 st out of 4732 within the overall ranking.
Source: Seeking Alpha
Airbnb
Airbnb was founded in 2007 and currently has 6,811 employees. The company has a Market Capitalization of $74.13B.
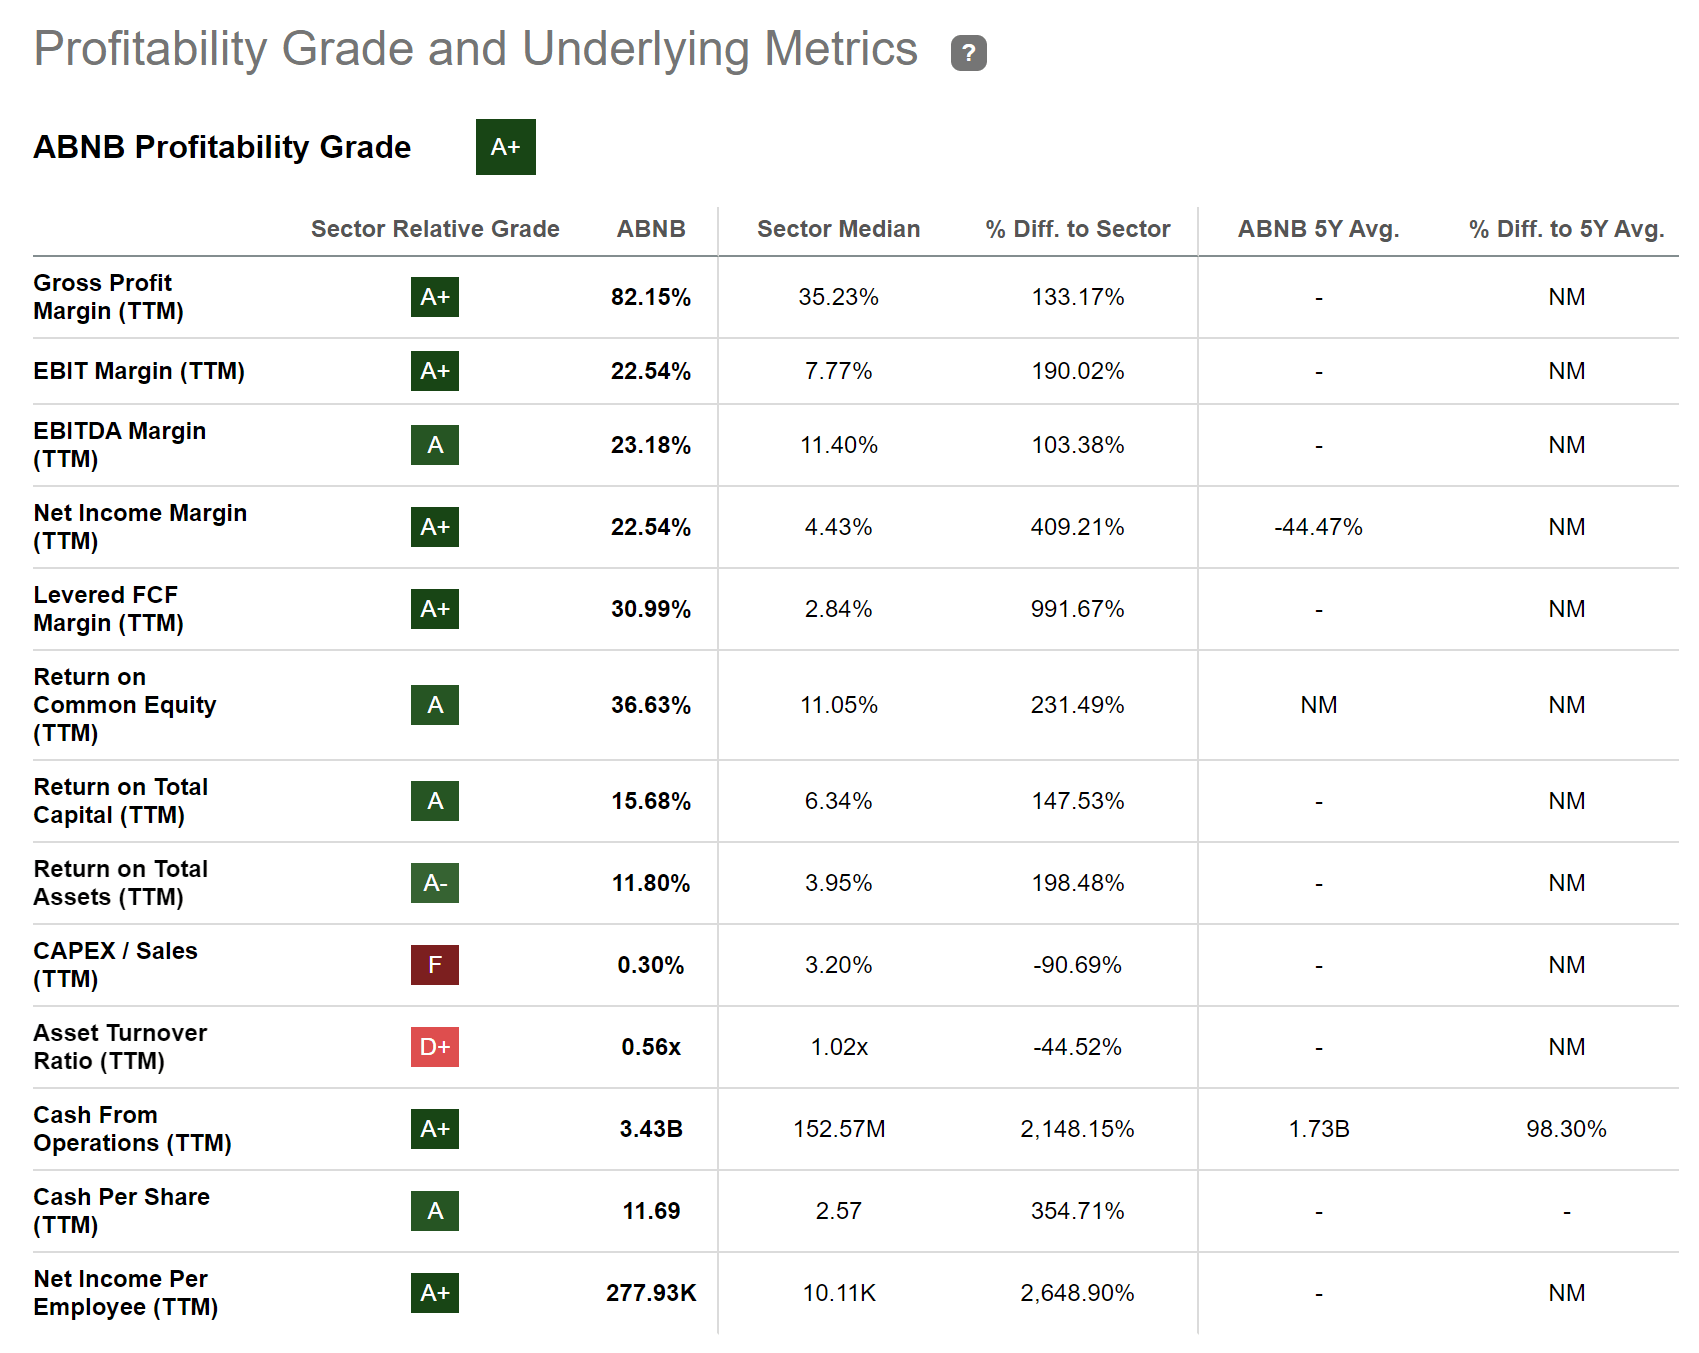
Airbnb’s EBIT Margin [TTM] of 22.54% stands 190.02% above the Sector Median of 7.77% and reflects the company’s strong position within the Hotels, Resorts and Cruise Lines Industry. In addition to the above, it can be highlighted that the company’s Return on Equity of 36.63% stands 231.49% above the Sector Median of 11.05%, which further demonstrates the company’s strength in terms of Profitability.
Below you can find the Seeking Alpha Profitability Grade for Airbnb, which demonstrates, once again, the company’s financial health.
Furthermore, it can be stated that Airbnb has shown an Average Revenue Growth Rate [FWD] of 26.97% over the past 5 years, which underlines the company’s growth perspective.
In terms of Growth, Airbnb is clearly ahead of its peer group: while Airbnb’s Revenue Growth Rate [CAGR] over the past 5 years is 26.81%, Marriott International’s ( MAR ) is 6.03%, Booking Holdings’ ( BKNG ) is 6.15%, and Hilton Worldwide Holdings’ ( HLT ) is 3.01%.
Even though the company is not particularly cheap (having a P/E [FWD] Ratio of 34.37), I consider its Valuation to be fair, particularly when taking into consideration the Growth Rates it has shown within the past years.
Alphabet
I continue to consider Alphabet’s current Valuation to be very attractive for Investors: at this moment of writing, Alphabet has a P/E [FWD] Ratio of 19.79, which lies 25.96% below its Average P/E [FWD] Ratio over the past 5 years. The company’s Price / Sales [TTM] Ratio of 4.77 is 25.42% below its Average from over the past 5 years (which is 6.39). Alphabet’s Price / Cash Flow [FWD] Ratio of 13.15 is 23.29% below its Average over the past 5 years. These metrics can all be interpreted in the same way: Alphabet is currently undervalued.
When comparing the company’s current Valuation with its peer group, it can be highlighted that Alphabet’s P/E [FWD] Ratio of 19.70 stands below the one of competitors such as Meta ( META ) (P/E [FWD] Ratio of 20.23), Apple ( AAPL ) (27.80) and Microsoft ( MSFT ) (32.59). However, it lies slightly above the one of Baidu ( BIDU ) (18.60).
Despite recently lower Revenue Growth Rates than the past, I believe that Alphabet continues to be on track in terms of Growth: the company has shown a Revenue Growth Rate [FWD] of 9.03% and an EBITDA Growth Rate [FWD] of 7.50%, thus underlying this theory.
The Seeking Alpha Quant Ranking also highlights Alphabet’s attractive position: the company is ranked 4 th out of 63 within the Interactive Media and Services Industry and 7 th out of 252 within the Communication Services Sector. In the overall ranking, the company is placed 70 th (out of 4732).
Source: Seeking Alpha
Amazon
Amazon is one of the largest positions of my own investment portfolio and I continue my buy rating for the company.
Amazon’s current P/E Non-GAAP [FWD] Ratio of 68.23 is not low, however, it is significantly lower than its Average P/E Non-GAAP [FWD] Ratio of 199.22 over the past 5 years. This means that Amazon’s current Valuation is 64.50% lower than its Average over the past 5 years, indicating that the company is currently undervalued.
The theory that Amazon is currently undervalued is also confirmed when looking at the company’s Price / Sales [FWD] Ratio of 1.90, which lies 40.54% below its Average over the past 5 years (which is 3.20).
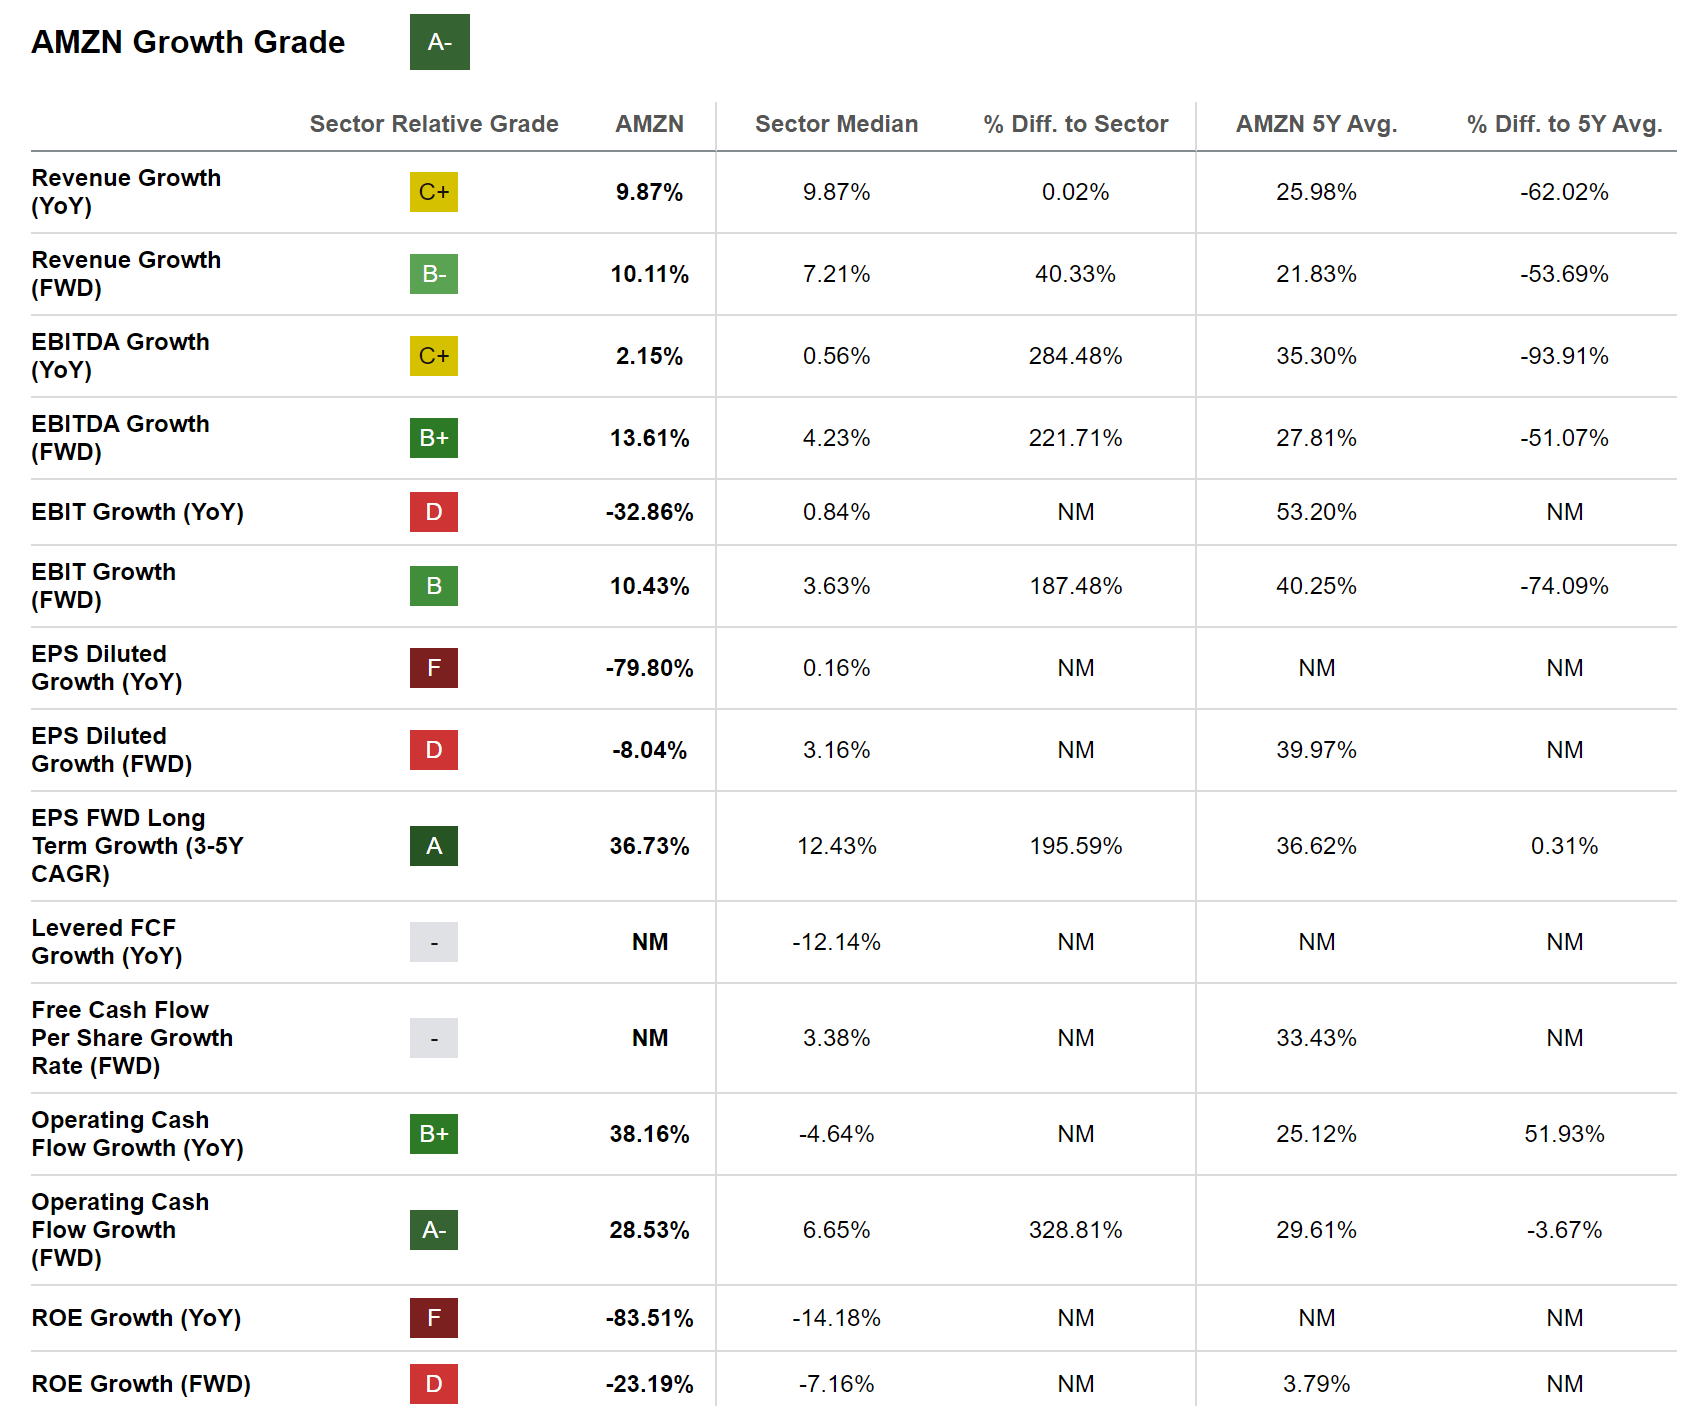
I continue to see Amazon as an excellent growth company for investors, which is underlined by its Revenue Growth Rate [FWD] of 10.11% and an Average Revenue Growth Rate [FWD] of 21.83% over the past 5 years.
I believe that Amazon will continue to deliver excellent results for investors over the long term due to its strong competitive advantages including a continuous focus on innovation and customer satisfaction.
Below you can find the Seeking Alpha Growth Grade for Amazon, which confirms my investment thesis that the company is on track when it comes to Growth.
Broadcom
At Broadcom’s current stock price of $629.50, it has a P/E GAAP [FWD] Ratio of 17.94, which is 45.50% below its Average over the past 5 years. At the same time, the company’s current Valuation is 19.10% below the Sector Median of 22.18.
My statement that the company is an attractive growth stock for investors is underlined by its Revenue Growth Rate [FWD] of 10.62% and its EBITDA Growth Rate [FWD] of 13.12%.
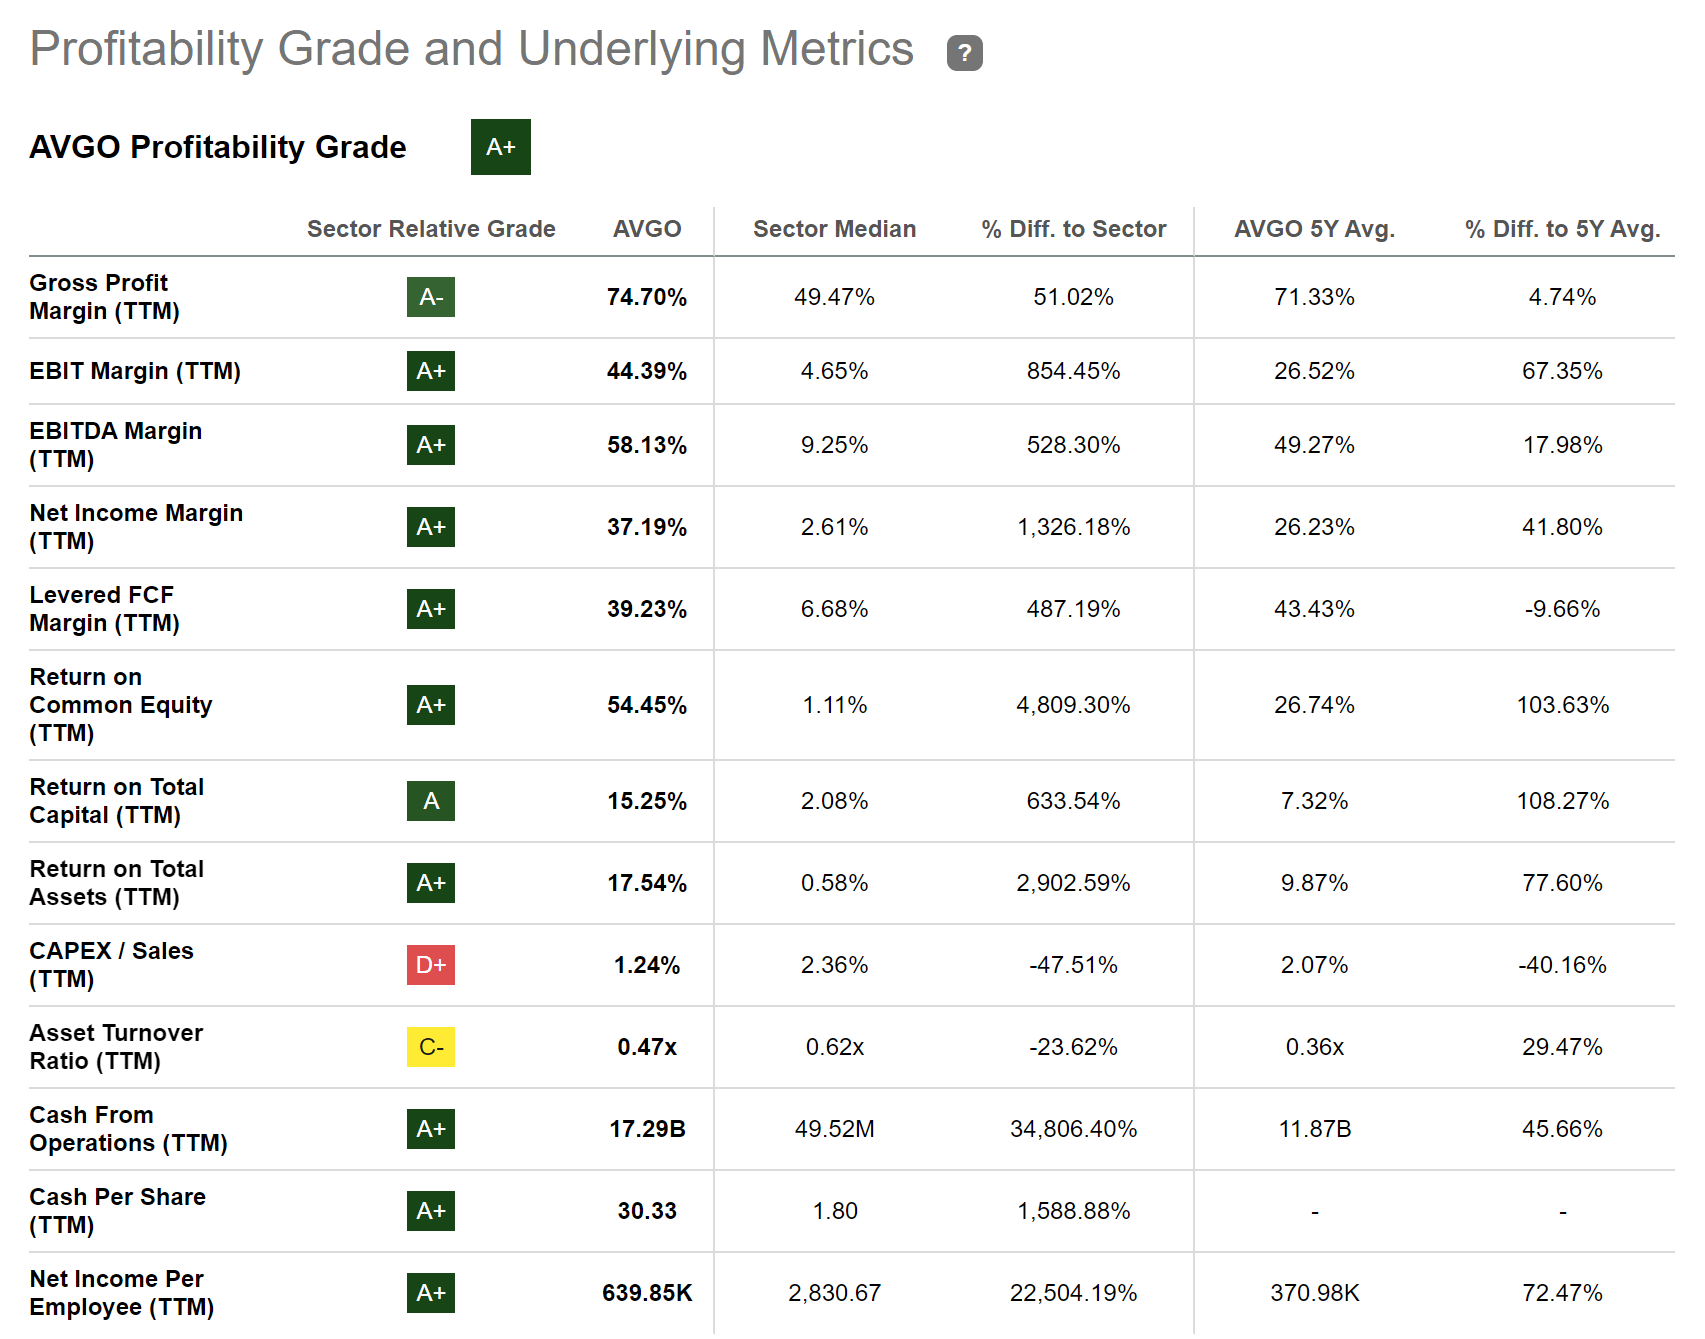
The company also shows impressive results in terms of Profitability: it has a Return on Equity of 54.45% and a Gross Profit Margin [TTM] of 74.70%. Both numbers demonstrate the company’s strength in terms of Profitability.
Below you can find the Profitability Grade for Broadcom, which reinforces my belief that the company is an excellent choice for investors.
MercadoLibre
MercadoLibre is a company based in Uruguay that operates online commerce platforms . It was founded in 1999 and currently has a Market Capitalization of $62.44B.
MercadoLibre is another company that I consider to be attractive due to its growth perspectives, but it also comes with a higher risk factor attached. Therefore, I would only underweight this company in an investment portfolio if you decide to include it.
The higher risk factor that comes attached to this investment is also reflected in the company’s relatively high P/E [FWD] Ratio of 68.78, which demonstrates that high growth expectations are priced into the stock price.
However, MercadoLibre exhibits excellent Profitability metrics: its EBIT Margin [TTM] of 11.01% stands 41.64% above the Sector Median and its Return on Equity of 34.06% lies 208.20% above the Sector Median.
When it comes to Growth, the company has also shown impressive results: its Revenue Growth Rate [FWD] is at 32.42% and its EBIT Growth Rate [FWD] at 66.07%.
The Seeking Alpha Factor Grade further strengthens my belief that the company is an excellent choice for investors, since it is rated with an A+ in terms of Growth and Revisions and with an A for Profitability and for Momentum. Only for Valuation is MercadoLibre rated with an F, which underlines my theory to underweight the company.
Source: Seeking Alpha
Novo Nordisk
Novo Nordisk is a worldwide operating health care company that is based in Denmark. The company was founded in 1923 and it currently has a Market Capitalization of $363.52B.
Novo Nordisk has a Gross Profit Margin [TTM] of 84.22% and an EBIT Margin [TTM] of 43.27%. Its Gross Profit Margin [TTM] stands 51.29% above the Sector Median, confirming the company’s strength in terms of Profitability.
The company also has a high Return on Equity of 83.50%, which further underlines its strength when it comes to Profitability.
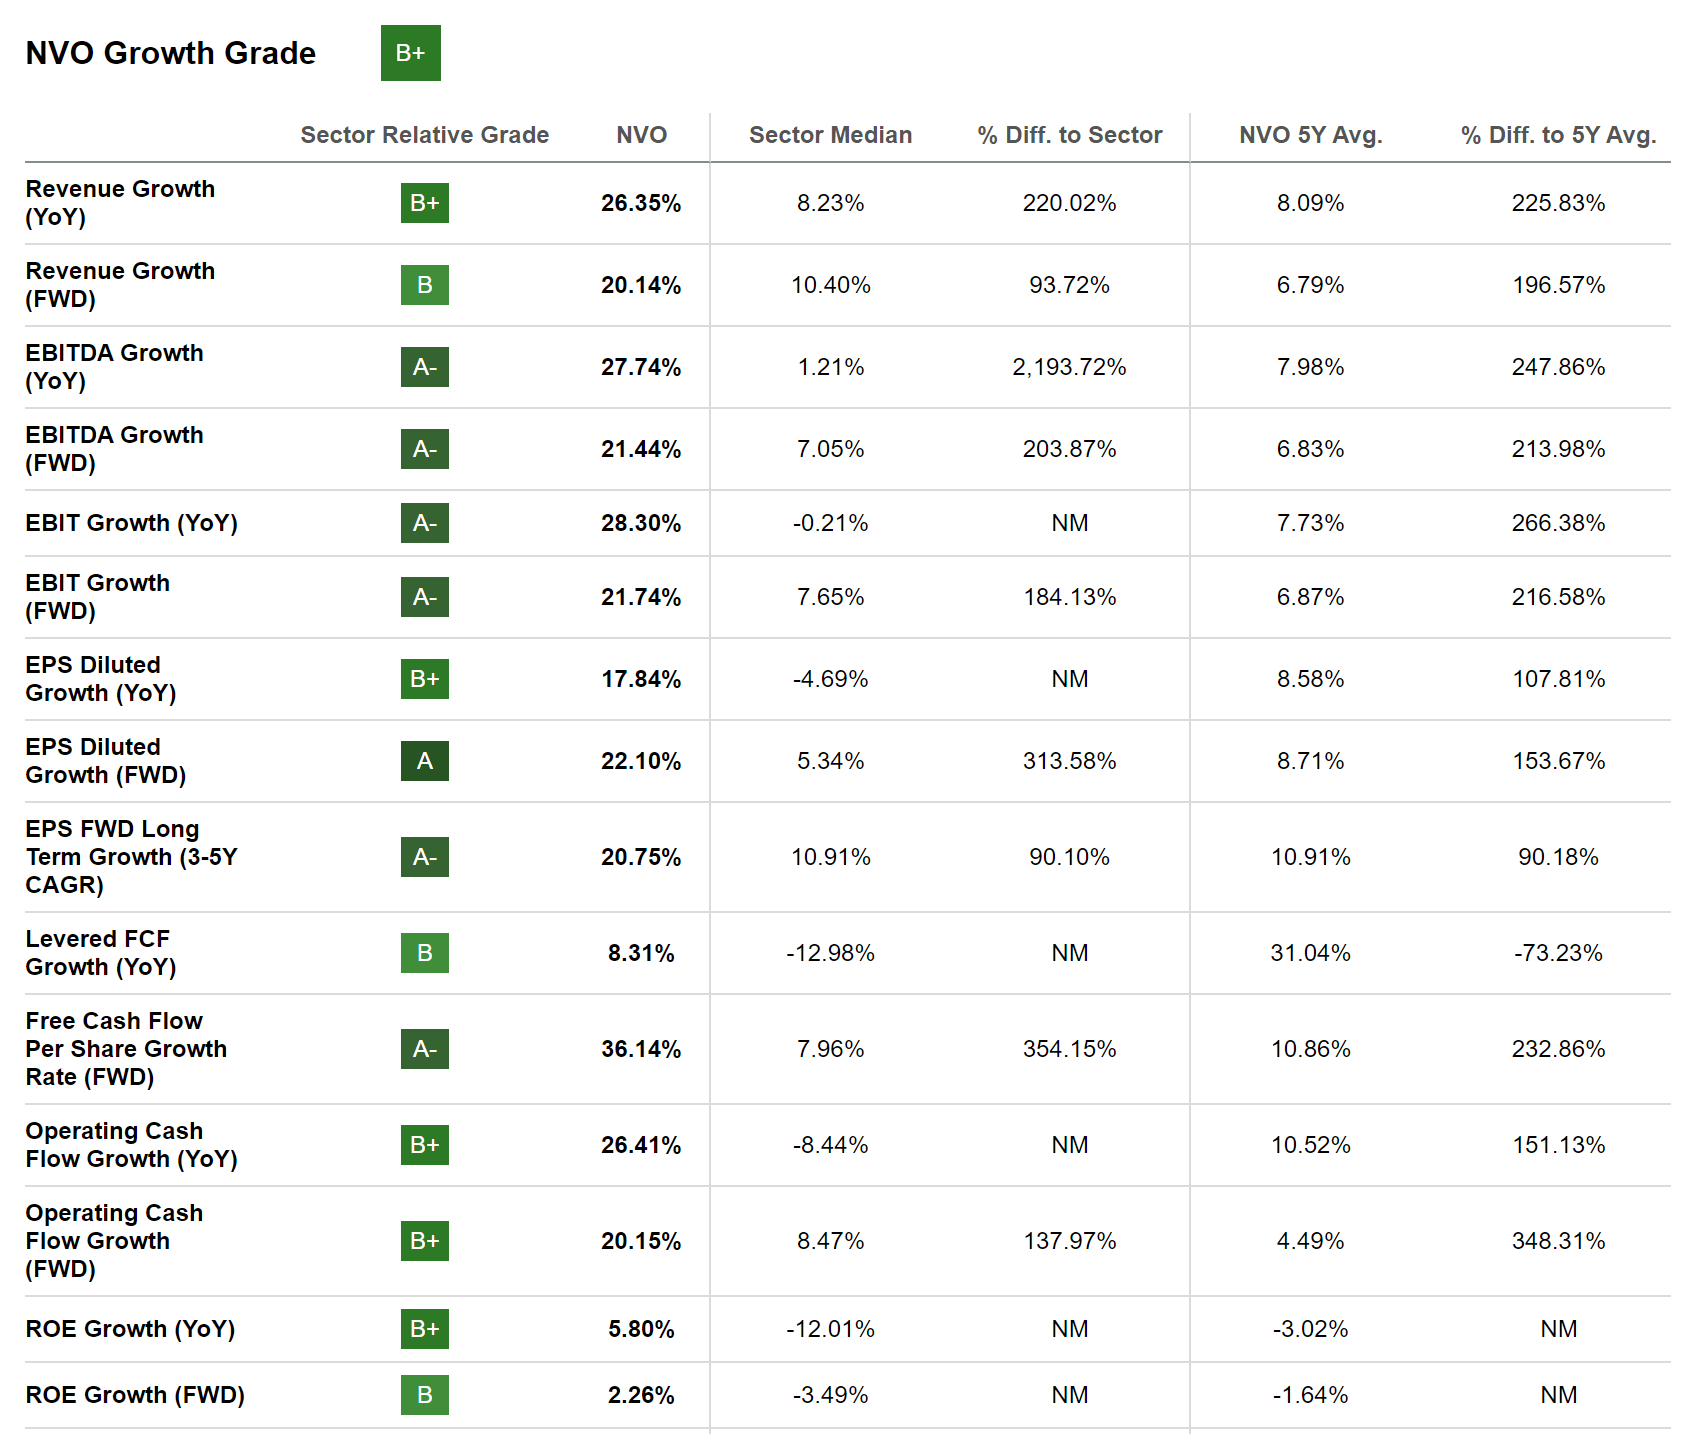
In addition to the above, Novo Nordisk has shown strong results in terms of Growth: the company has an EBIT Growth Rate [FWD] of 21.74% and an EPS Diluted Growth Rate [FWD] of 21.40%, which further confirms its strength in terms of Growth.
Below you can find the Seeking Alpha Growth Grade for Novo Nordisk, underlying the company’s excellent metrics when it comes to Growth.
Salesforce
Salesforce currently has a P/E Non-GAAP [FWD] Ratio of 26.88, which lies significantly below its Average from the past 5 years (52.44), indicating that the company is undervalued.
I consider Salesforce to be an attractive growth company for investors, which is why I have made it part of this list of attractive growth companies to invest in: Salesforce has shown a Revenue Growth Rate [FWD] of 13.34% and an EBITDA Growth Rate [FWD] of 13.77%, which underlines my theory that it's an attractive growth company.
Salesforce has an attractive position according to the Seeking Alpha Quant Ranking, which further confirms my investment thesis. At this moment in time, the company is ranked 2 nd out of 209 within the Application Software Industry and 6 th out of 590 within the Information Technology Sector. In the overall ranking, the company is placed 47 th out of 4732.
Source: Seeking Alpha
Tesla
I see Tesla as a stock that I would only underweight in an investment portfolio. This is particularly the case due to the risks that come attached to an investment in the company. In addition to that, I would also suggest not to speculate over the short term when buying Tesla stocks.
My theory to only underweight the company in an investment portfolio is also based on its high Valuation: with a P/E Non-GAAP [FWD] Ratio of 46.1, Tesla’s Valuation is significantly above the one of competitors such as Ford (F) (P/E [FWD] Ratio of 7.08) and General Motors ( GM ) (5.51), indicating that an investment in the company comes attached with significantly higher risk due to the higher growth expectations being priced in.
However, I do see Tesla as an attractive growth company from which you can benefit while investing a small percentage of your overall portfolio over the long term in order to reduce risks.
The company has shown excellent results in terms of Profitability: its EBITDA Margin [TTM] of 19.37% stands 69.96% above the Sector Median and its Return on Equity of 28.70% lies 159.73% above the Sector Median of 11.05%.
Below you can find the Seeking Alpha Profitability Grade for Tesla, which underlines the company’s excellent position within the Automobile Manufacturers Industry as well as its financial health.
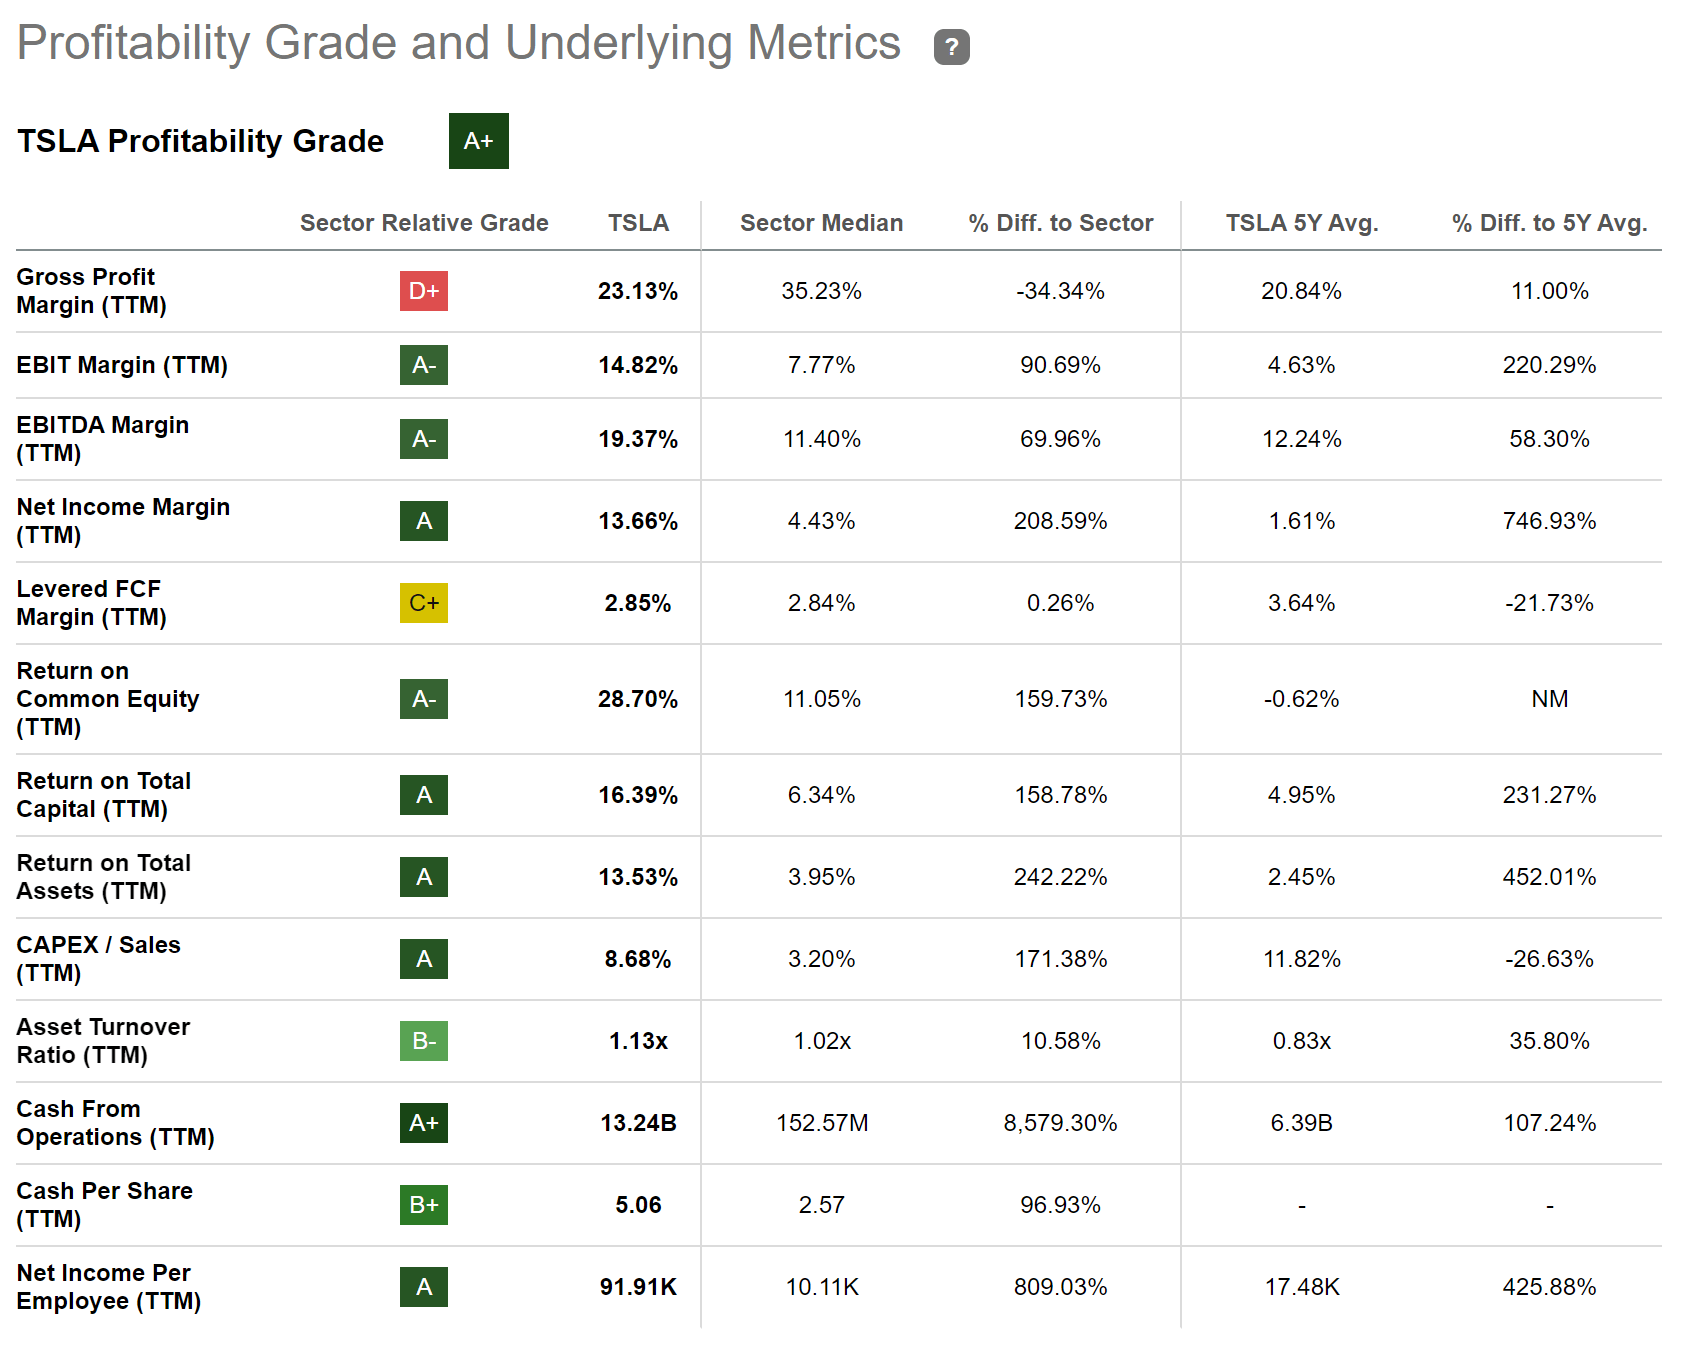
In terms of Growth, it can be highlighted that the company has a Revenue Growth Rate [FWD] of 34.08% and an EBIT Growth Rate [FWD] of 42.84%. Both are indicators that the company is an attractive fit for investors seeking growth.
Waste Management
Waste Management was founded in 1987 and has 49,500 employees. The company provides environmental solutions to its customers.
In terms of Growth, it can be highlighted that Waste Management has shown an EPS Diluted Growth Rate [YoY] of 20.59%, which is 67.89% above the Sector Median (12.26%). The company has further shown a ROE Growth Rate [YoY] of 23.48%, which is another indicator of its strength in terms of Growth.
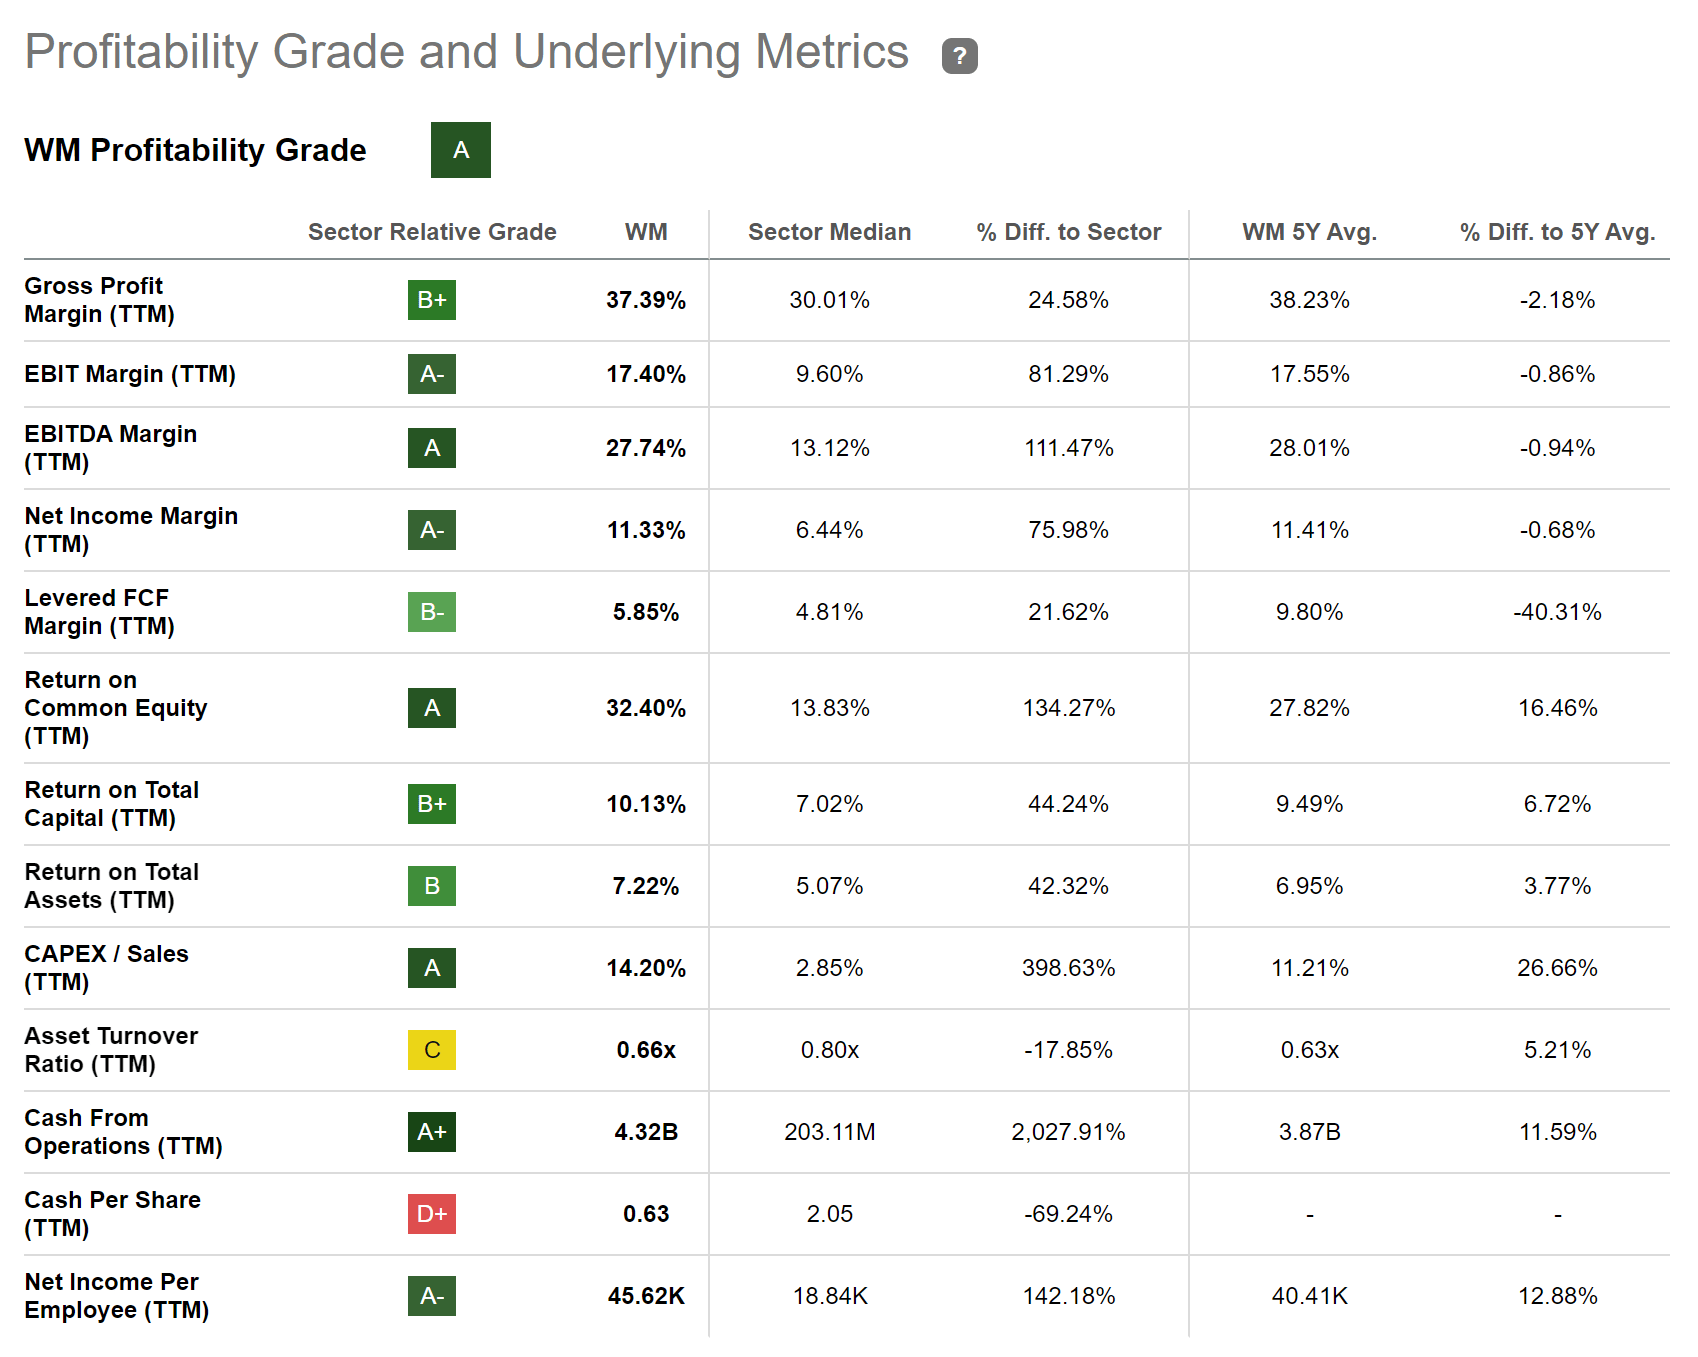
The company’s excellent position within the Environmental and Facilities Services Industry is further proven by its high Gross Profit Margin [TTM] of 37.39% (which stands 24.58% above the Sector Median) and its high EBIT Margin [TTM] of 17.40% (which stands 81.29% above the Sector Median).
Below you can find the Seeking Alpha Profitability Grade, which, once again, shows that the company is an excellent fit in terms of Profitability, a factor that has contributed to me making it part of this list.
Conclusion
Investing in growth companies implies a higher risk for investors, since high growth expectations are often priced into the company’s stock price.
For this reason, this article should help you to identify growth companies that have strong competitive advantages, are financially healthy, and which currently have a Valuation that I consider to be at least fair.
These characteristics aim to help you reduce the risk level of your investments and to increase the probability of making well founded and excellent investment decisions over the long term.
However, I would like to repeat what I have already mentioned at the beginning of this article: due to the elevated risk factors that come attached with investing in growth companies, I suggest limiting the proportion of growth companies in your overall investment portfolio.
Author’s Note: I would appreciate your opinion on this selection of growth companies. Do you already own or plan to buy some of the listed companies? Which are currently your favorite growth stocks to invest in?
For further details see:
10 Attractive Growth Stocks For May 2023