FTDS - 10 Leading Indicators To Tell You Where The Market Is Heading
Summary
- 5 out of 10 leading indicators suggest the economy is not heading for a recession.
- However, 3 out of 10 of these leading indicators suggest the economy is heading for a recession.
- 2 out of these 10 leading indicators provide a neutral outlook of the economy.
- Overall, there is a 40% chance that the economy is heading for a recession.
The Conference Board
The conference board is a not-for-profit research organization and private source of business intelligence. Its Composite Index of Leading Indicators (" CILI ") is widely followed as it offers a forwarding looking outlook of the future state of the economy.
This CILI consists of 10 separate indicators which will be analyzed in detail in this article to understand its outlook on the future economy. Specifically, we want to understand based on the current trend of each of these indicators, whether we are likely to be heading for the next recession.
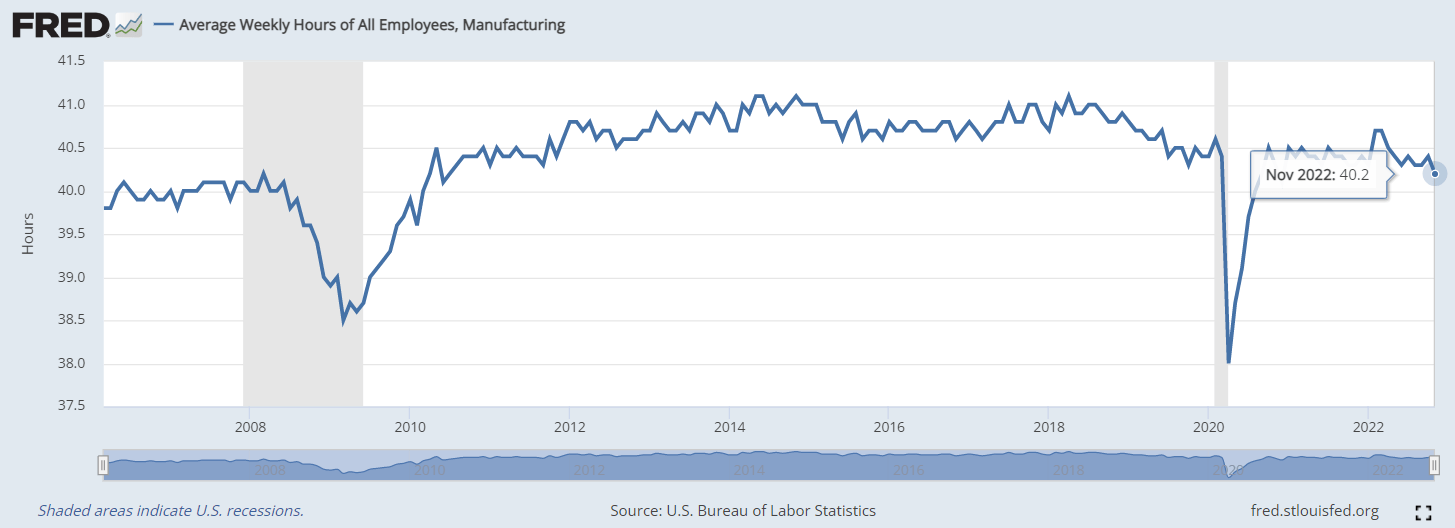
Average weekly hours, manufacturing
This indicator describes how much input employees are contributing to the manufacturing sector. According to Investopedia :
Assuming stable productivity, more hours worked would mean more output. Therefore, if workers are producing the same amount of goods or services per hour, and are working more hours than real GDP is higher.
If we infer from the Federal Reserve Economic Data ("FRED"), employees in the manufacturing sector are working an average of 40.2 hours per week .
Average weekly hours, manufacturing ((FRED))
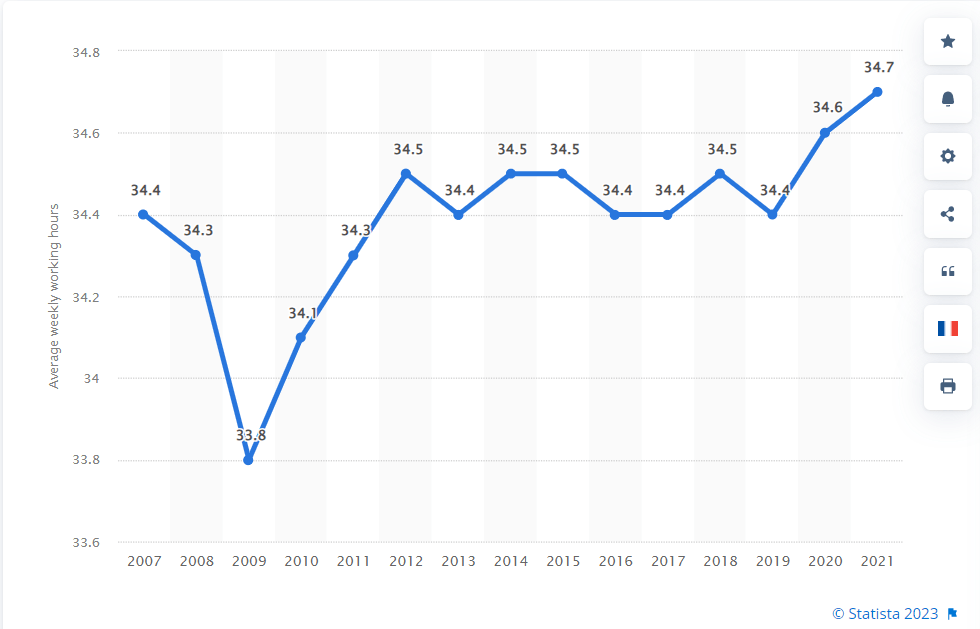
According to Statista , the average weekly working hours of all employees in the U.S. in 2021 is 34.7 hours. If we use this figure as a benchmark, we understand that the average weekly working hours of the manufacturing sectors are higher than the benchmarked average working hours for all employees.
average working hours for all employees (Statista)
Assuming these higher working hours translate to real GDP growth; it suggests that the economy is still healthy and not heading for a recession .
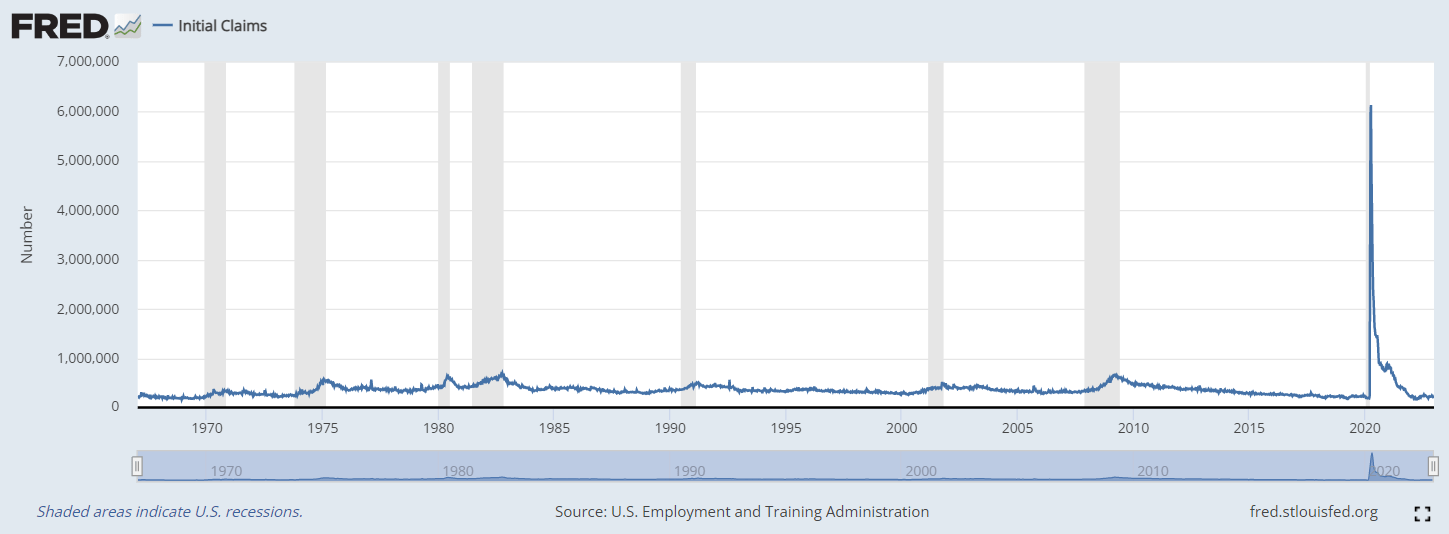
Average weekly initial claims for unemployment insurance
According to Investopedia :
Initial claims typically rise before the economy enters a recession and decline before the economy starts to recover, making them useful as a leading indicator."
Hence, if the economy is heading for a recession, we should expect to observe Initial Claims rising significantly. If we infer from FRED , right now, this is not happening yet:
Average weekly initial claims for unemployment insurance ((FRED))
In fact, not only is Initial claims not increasing, it is currently at one of the lowest levels since 1967. There is an unusual spike in the year 2000 due to the effect of COVID-19 that resulted in the mass shutdown of businesses. As explained by Investopedia :
The claims report relies on data gathered by the states, and so was distorted early in the COVID-19 pandemic by the huge backlogs of unemployment claims in swamped and outdated state processing systems.
If we compare current initial claims with previous levels just before the onset of the next recession, these are the observations:
- Initial claims before the next recession in 1990: ~350000
- Initial claims before the next recession in 2000: ~360000
- Initial claims before the next recession in 2007: ~330000
- Current initial claims figure: 225000
Comparatively, the current initial claims figure is significantly lesser that the levels before the last 3 recessions. In my opinion, the current Initial Claims report suggests the economy is not heading for a recession.
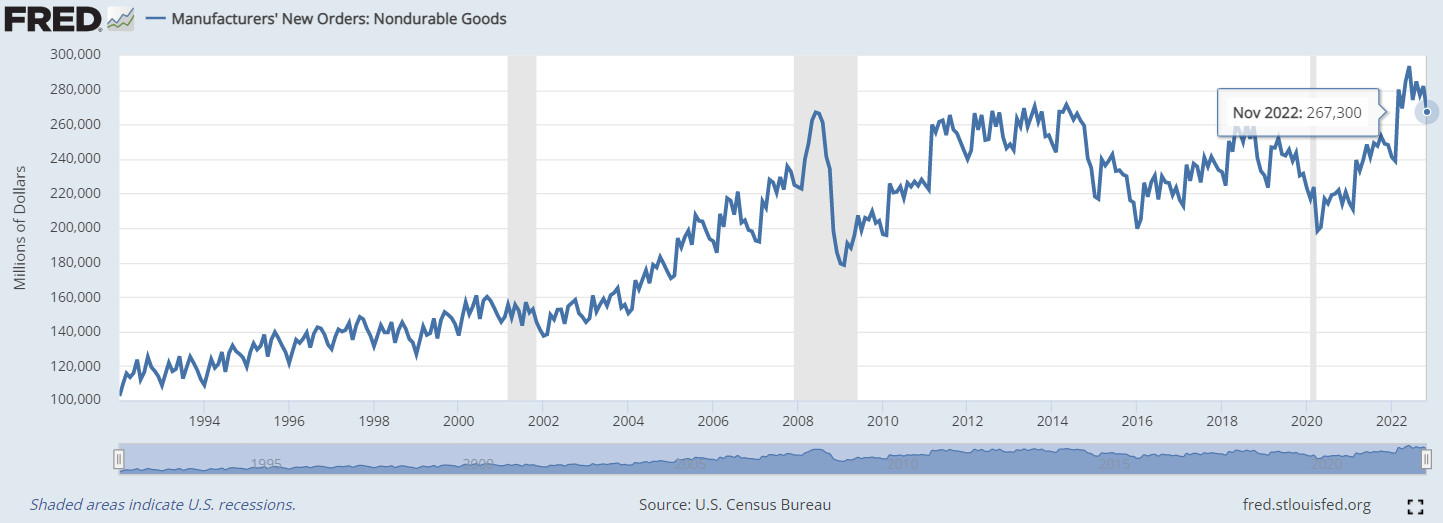
Manufacturers' new orders, consumer goods, and materials and Nondefense Capital Goods Excluding Aircraft
According to Investopedia :
When factory orders increase, it usually means the economy is expanding as consumers demand more goods and services, which in turn requires retailers and suppliers to order more supplies from factories.
If this indicator suggests consumers are still increasingly demanding goods and services in spite of the current climate of rising interest rates, spending is likely to continue and benefit companies that are depending on this spending to maintain their profit margins.
This results in productive companies continuing to remain profitable which helps to avert the possibility of a recession.
We can observe the demands for 'new orders' from different segments to get a more diversified and informed perspective:
New orders for Non-Durable goods ((FRED))
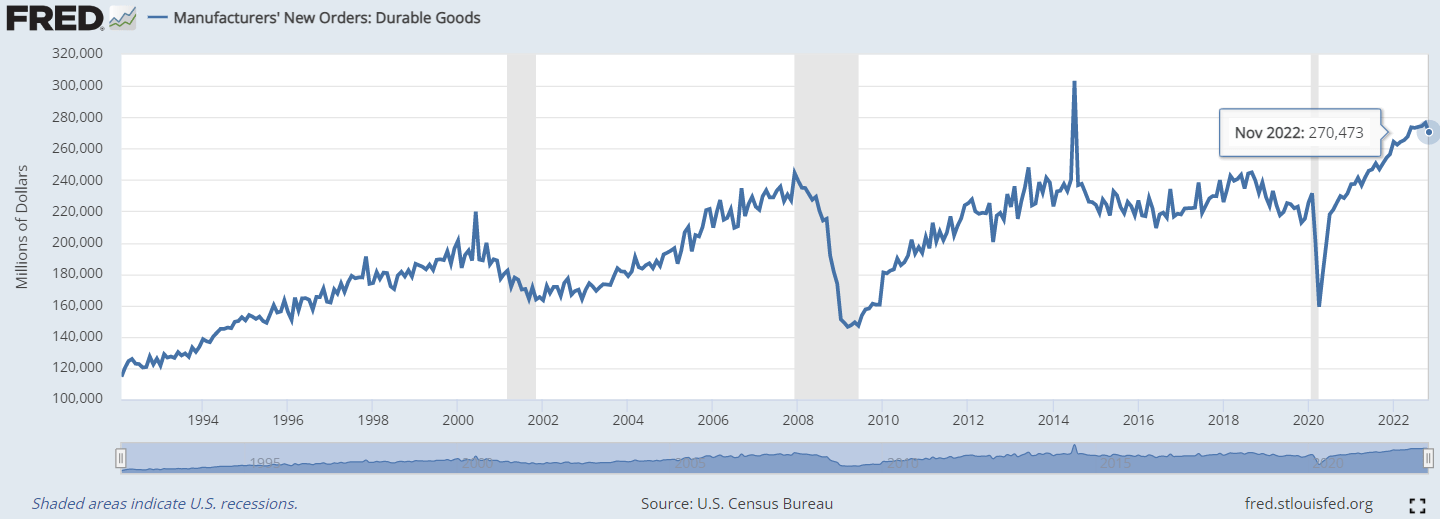
New Orders for Durable Goods ((FRED))
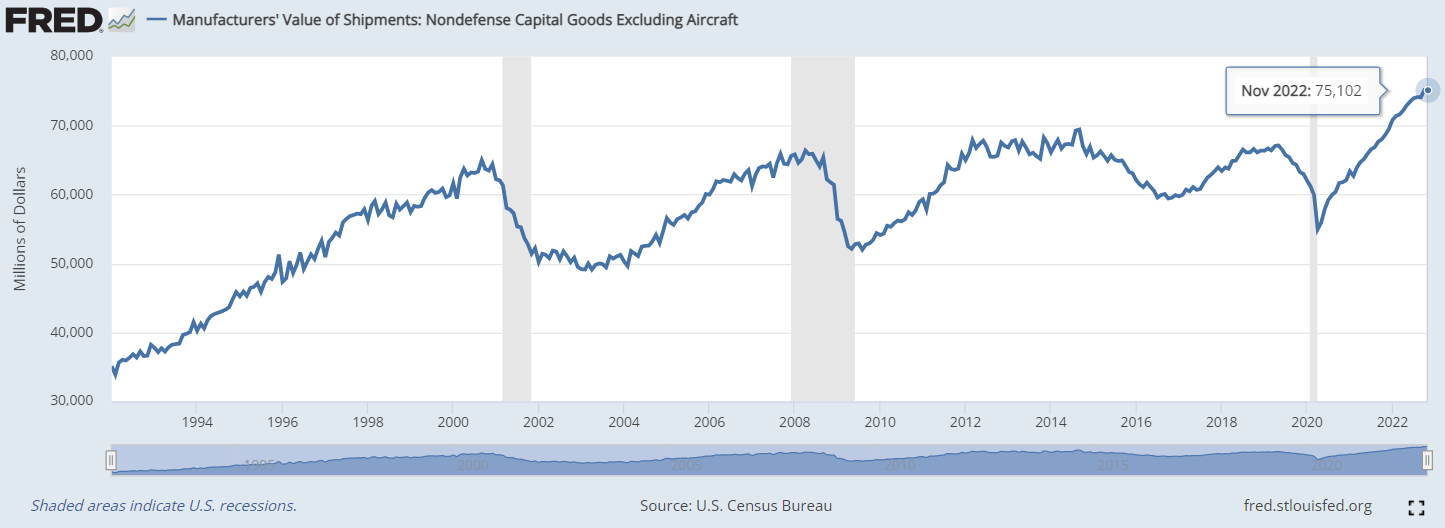
Nondefense Capital Goods Excluding Aircraft:
New orders for durable Nondefense Capital Goods Excluding Aircraft ((FRED))
Non-durable goods last for less than 3 years and represent necessary goods (like groceries) that consumers must purchase no matter the current economic situation. From the chart, we can see that the demand is generally on an uptrend. Durable goods, which account for 68.4% of the U.S. GDP , are also rising steadily.
Nondefense capital goods, which are considered subtypes of durable goods since they also last for more than 3 years , are used for the production of other goods. The demand for this specific type of durable goods is also increasing.
There are 2 indicators discussed in this section:
- Manufacturers' new orders for consumer goods, and materials (durable and nondurable goods)
- Manufacturers' new orders for Nondefense Capital Goods Excluding Aircraft (durable goods)
Both of these indicators for manufacturing orders look healthy and suggest the economy is not heading for a recession.
ISM new order index
The Institute for Supply Management (ISM) publishes an index to measure the change in production levels across the U.S. economy from month to month. According to Investopedia :
A PMI above 50 indicates an expansion of the manufacturing segment of the economy compared to the previous month. A reading of 50 means no change. A reading below 50 suggests a contraction.
On the Institute for Supply Management ("ISM") website , there are 3 different PMI indexes published measuring the production levels across different sectors:
- Manufacturing PMI is currently at 49%
- Services PMI is currently at 56.5%
- Hospital PMI is currently at 57.5%
From these latest figures published, only 1 out of 3 of the sectors (manufacturing) mentioned is in contraction. The other 2 sectors are still expanding.
Overall, the average value of the 3 PMI indexes is about 54% (above 50%), suggesting the overall economy is not heading for a recession.
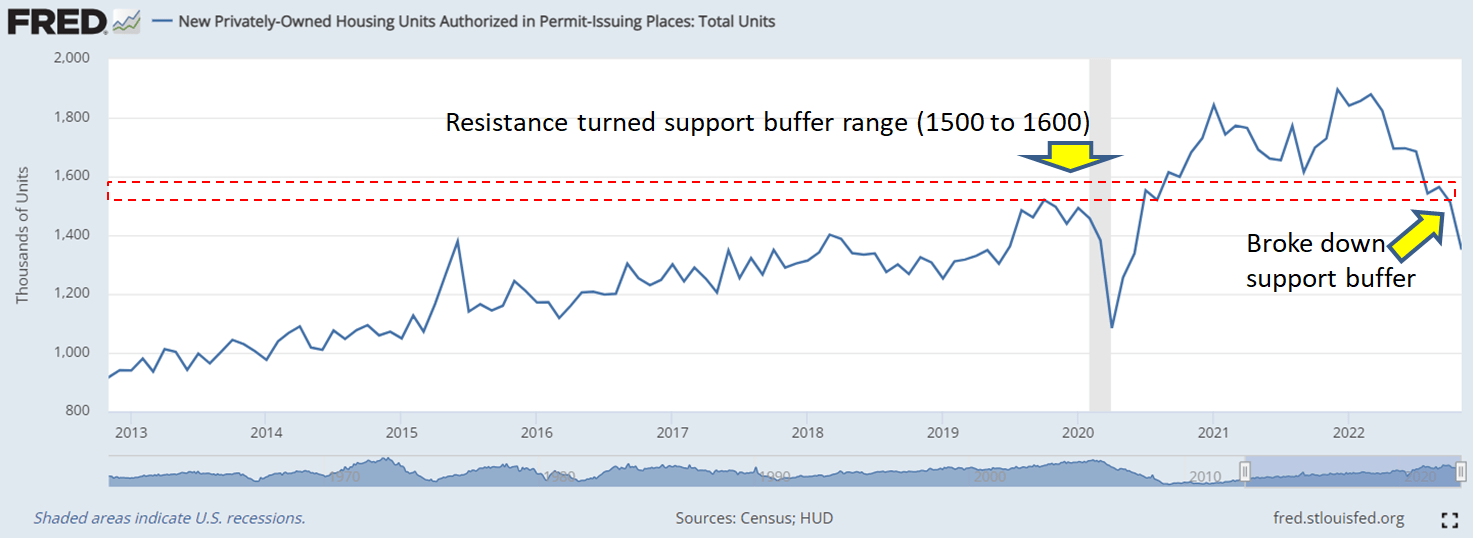
Building permits for new houses
Houses are expensive for most people. Generally, consumers are more likely to demand more of such big-ticket items only when they have already accumulated enough savings for it, or they foresee that they will accumulate enough cash for it in the future. This suggests the economy is still growing.
According to Investopedia :
A general increase in building permits might indicate a need for more homes. A rise in building permits specifically for single-family homes can indicate that more citizens have accumulated enough finances to afford their residences.
Therefore, an increase in building permits allows us to understand whether the economy is in the growth or stagnation phase.
If we infer from FRED :
Building permits for new houses ((FRED))
This indicator has been down-trending since March 2022. Recently, in October 2022, it has also broken a key "resistance turned support buffer".
Past recessions have often preceded a significant drop in building permits. Hence, in my opinion, this indicator suggests we are heading for a recession .
S&P 500 equity price index
The S&P 500 index hardly needs any introduction. The index comprises the 500 largest and most liquid companies in the United States. According to Investopedia :
Although the index is created by a private company, the S&P500 is now a popular yardstick for the performance of the market economy at large.
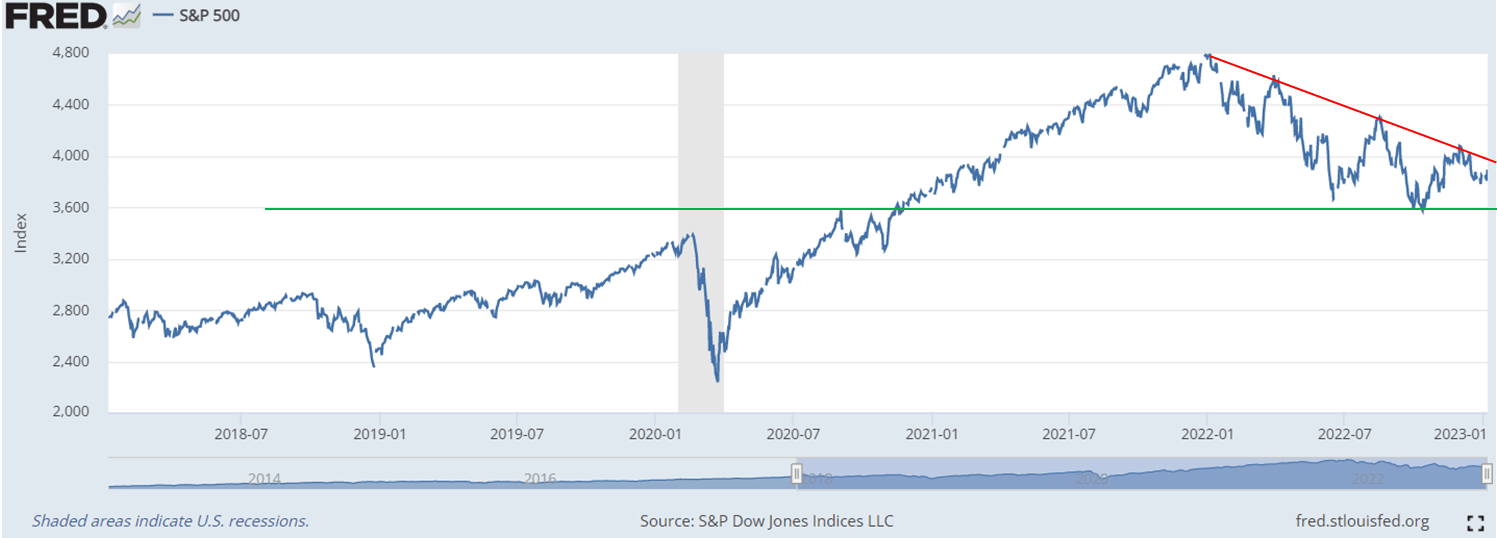
If we infer from FRED , we can observe that this index has retraced significantly since its high in December 2021:
S&P 500 equity price index ((FRED))
Right now, it appears to have bottomed and approaching a major resistance-turned-support around the 3500 level (green line). At the same time, it appears to be near a strong trendline resistance tested 4 times prior (red line).
In my opinion, if the price can breakout above the trending resistance, it will be very bullish for the stock market suggesting the market economy is a track for a convincing recovery.
However, if the price breaks down significantly below the 3500 support level, it suggests a recession is likely to follow.
In my opinion, the S&P 500 index is giving a neutral outlook to the overall economy.
Inflation-Adjusted Monetary Supply (M2)
For most 'individuals', having more money is never a bad thing. But for the economy, too much money leads to excessive inflation. As described by Investopedia :
When there is more cash out there, more cash gets spent. A little more can be good. A lot more can increase the risk of inflation
When inflation goes rampant, as it is happening now, the Fed intervenes by increasing interest rates, which in turn increases the borrowing costs of businesses, especially smaller-fledging startups that depend more on such borrowings to expand their businesses.
When inflation is too high, consumers have less purchasing power and hold back on their spending, which further hurts businesses' top-line revenues.
The combined effect of lower revenue and higher costs of business reduced profit margins, which in turn led to cost-cutting measures like retrenchments and pay cuts, further reducing the purchasing power of consumers. If this cycle repeats long enough, the economy will be forced into a recession.
As this Forbes article noted:
The Federal Reserve has already raised rates several times this year and is expected to do so until the fed funds rate reaches 3.5% . This is expected to push prices downward, but it comes with some risk of entering a recession.
The U.S. Federal Reserve uses M2 to estimate the total money supply in the economy.
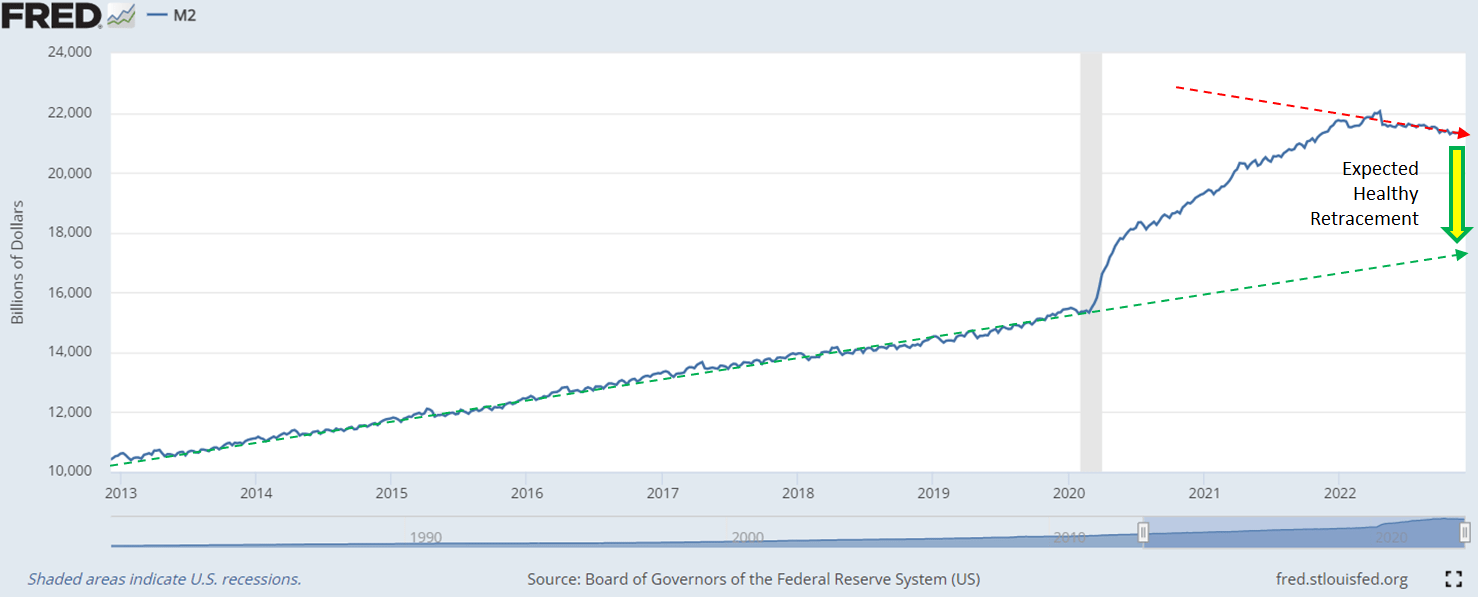
If we infer from FRED , this is the current trend of M2:
There is a huge spike shortly after the Covid pandemic crisis. This is due to the massive injection of money into the US economy to fight the devastation to the economy brought about by the coronavirus.
Prior to this spike at the beginning of the year 2020, the trend of M2 can be observed to be increasing 'steadily' for the last 10 years. The rate of increment almost exactly follows a straight trending line.
While the surge over the last 2 years has been massive, it appears to be tapering off since the middle of 2022 and currently appears to be decreasing slowly, suggesting the Fed's decision to hike interest rates appears to be effective in reducing inflation.
While the Fed's strategy to bring down inflation using multiple rate hikes has yielded some results, the current inflation rate is still significantly far away from the trending support (green dashed arrow). In my opinion, the Fed is most likely not going to significantly bring down the current rate hikes unless inflation levels go through a 'healthy retracement' and approach near the trendline line.
Since the inflation rates are already reducing, albeit slowly, the Fed might want to simply maintain the current rate hike and allow the inflation level to gradually comes down at the current rate. On the other hand, the Fed might think that the current retracing trend of the inflation rate might be 'too slow' and believes it's necessary to step up on rate hikes to further accelerate the reduction of inflation to a sustainable level, even if it means causing short-term inflation.
Overall, in my opinion, the M2 indicator is suggesting a neutral outlook for the overall economy.
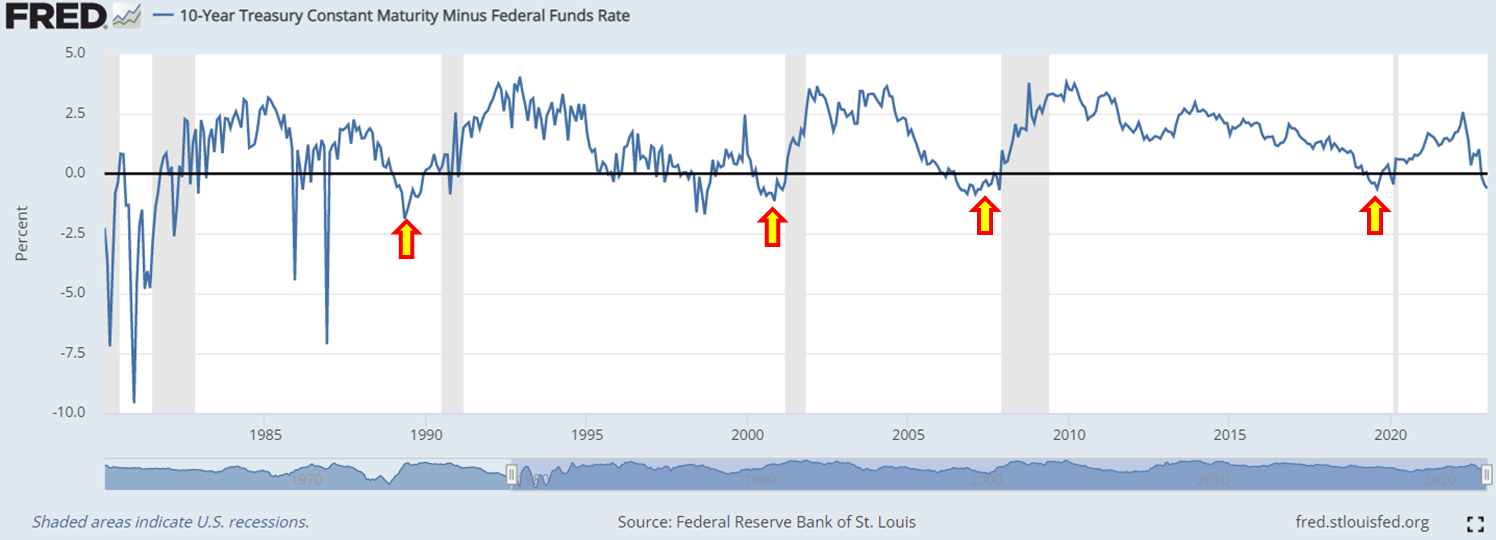
10-year Treasury To Federal Funds Interest Rate Spread
The federal funds rate is the target interest rate set by the FOMC that influences short-term interest rates while the 10-year treasury yield is the interest one gets when holding the US T-Bill. Since the maturity of the 10-year US T-Bill is 10 years, it is considered a long-term rate.
According to the Conference Board , the difference between long and short-term rates is an indicator of whether a recession is imminent:
The spread or difference between long and short rates is often called the yield curve. This series is constructed using the 10-year Treasury bond rate and the federal funds rate, an overnight interbank borrowing rate. It is felt to be an indicator of the stance of monetary policy and general financial conditions because it rises (falls) when short rates are relatively low (High). When it becomes negative (i.e., short rates are higher than long rates and the yield curve inverts) its record as an indicator of recessions is particularly strong .
If we infer from FRED , this is the current trend of the short vs long-term interest spread:
10-year Treasury To Federal Funds Interest Rate Spread ((FRED))
We can observe that this indicator has accurately predicted the onset of the last 4 recessions whenever it dipped below the negative region of the chart.
Right now, it has once again dipped below the critical 0% level suggesting the economy is heading for a recession .
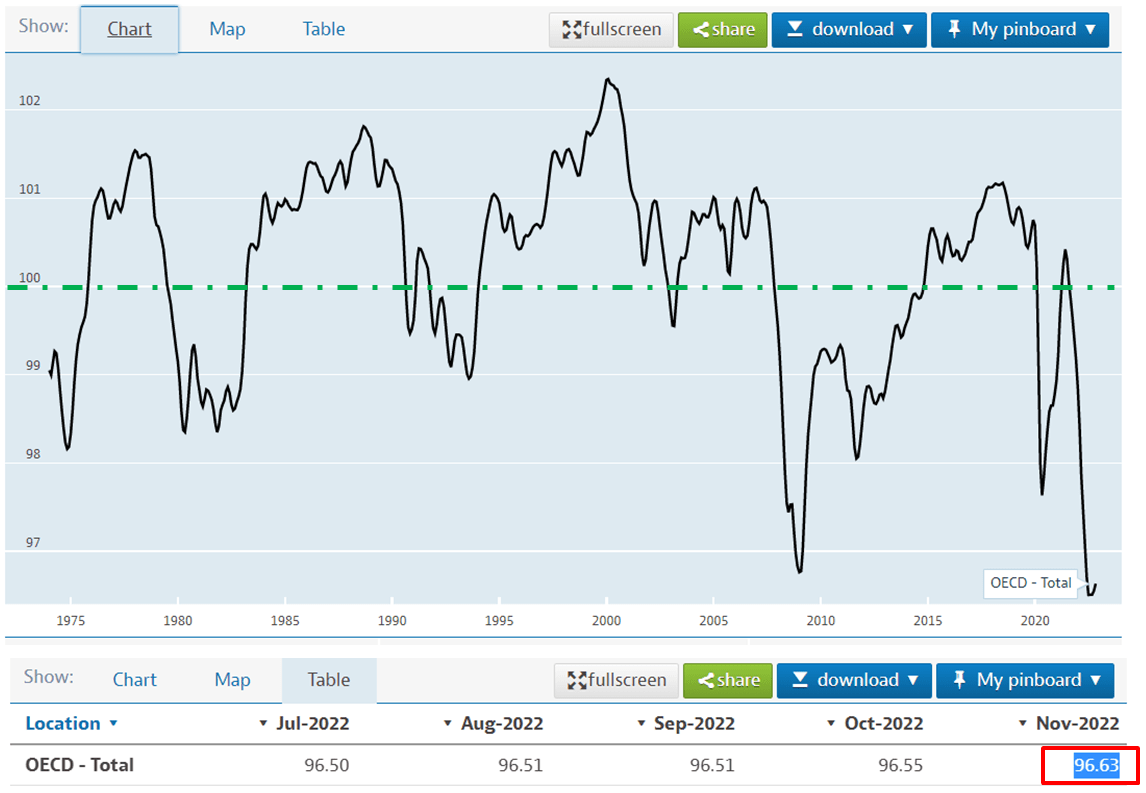
Average Consumer Expectations for Business and Economic Conditions
When consumers expect the economy to do well, they will spend more which benefits businesses in the economy. When businesses do well, they are likely to hire more, boosting employment and income. Higher employment and income lead to consumers having even higher confidence in the economy. If the cycle repeats persistently, it will help to reduce the chance of a recession.
The Consumer Confidence Index ("CCI") is a widely used indicator to gauge the expectations of consumers. According to Investopedia :
A current CCI above 100 means consumers are more optimistic than the benchmark CCI of 100 set in 1985. Conversely, if the current CCI were below 100, it would mean consumers were more pessimistic than in 1985.
If we infer from the Organisation for Economic Co-operation and Development ("OECD"), this is the current trend of the CCI index.
We can observe that the index has dipped way below the benchmark CCI of 100, at just 96.63.
In my opinion, this indicator suggests we are heading for a recession .
Conclusion and Key Takeaway
No one can predict the market with absolute certainty. However, using a systematic approach to analyze the 10 widely used leading indicators of the CILI, we can reasonably estimate the probability of an impending recession.
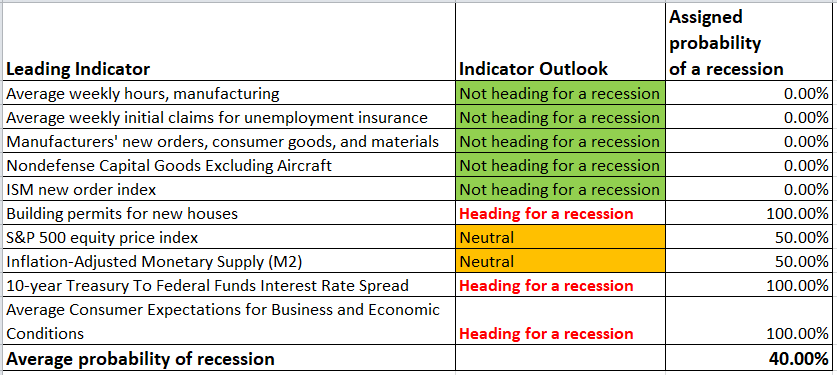
Here is the summary of the findings from the 10 leading indicators discussed earlier:
Leading Indicators' Summary (Author's own calculation)
For each indicator stated in the table, I assign an arbitrary probability such that:
- An indicator that suggests we are "Not heading for a recession" is assigned 0%
- An indicator that suggests we are "Heading for a recession" is assigned 100%
- An indicator that suggests a "Neutral" outlook is assigned 50%
The average of these probabilities will provide an overall probability of an impending recession of 40%.
This figure is very close to Statista, which provides an estimate of 38.06%
By November 2023, it is projected that there is probability of 38.06 percent that the United States will fall into another economic recession. This is a significant increase from the projection of the preceding month where the probability came to 26.03 percent.
In my opinion, a 40% chance of the economy going into a recession is significant, but for long-term investors, it should not be a cause for concern. In my opinion, the primary cause of the perceived upcoming recession is largely due to the Fed's aggressive interest rate hikes to curb runaway inflation.
As I mentioned in my previous article:
In fact, inflation is one of the reasons why the market always goes up in the 'long run'. Long-term investors should consider this as an opportunity to add more positions to fundamentally good companies.
In my opinion, companies with fundamentally good business models and cash-rich are likely to be least impacted by the massive hike in interest rates. This is because they are least likely to take on a massive debt that will result in higher servicing costs.
Patient investors who have the cash to slowly dollar cost average into cash-rich and fundamentally good companies like Amazon ( AMZN ) and Meta Platforms ( META ) will likely be greatly rewarded in the long term.
For further details see:
10 Leading Indicators To Tell You Where The Market Is Heading