KMLM - 11 Blue-Chips For The Ultimate High-Yield Buffett-Style Dividend Aristocrat Portfolio
2023-05-17 07:10:00 ET
Summary
- The economic data is getting worse at an accelerating rate. It now appears a 1.7% GDP recession lasting nine months could start in 5 weeks.
- The eerie calm of the market is 100% driven by an AI bubble in the biggest tech stocks. A bubble that could end as soon as next Wed.
- The stock market will likely suffer a 22% to 40% correction later this year. This house of horrors for stocks will panic most people, but not smart investors.
- Here are 11 of the widest moat, Buffett-style dividend aristocrats. They aren't just "wonderful companies at fair prices". They are wonderful companies at wonderful prices.
- Combined with two high-yield ETFs that generate the best hedging strategy of the last 53 years, you can build a 4.1% yielding ultra-low volatility wide-moat aristocrat portfolio that historically delivers 11% to 12% returns while falling 60% less than the S&P during bear markets. With bond rebalancing in bear markets, you can boost after-tax long-term returns by 20% and achieve 13% to 14% Nasdaq-like returns while rolling over the worst market potholes in a Rolls-Royce Portfolio.
This article was published on Dividend Kings on Monday, May 15th.
---------------------------------------------------------------------------------------
I believe an economic hurricane is coming.
In part 1 of this series, I explained why five economic headwinds are converging to create the "hurricane" JPMorgan CEO Jamie Dimon has been predicting for a year.
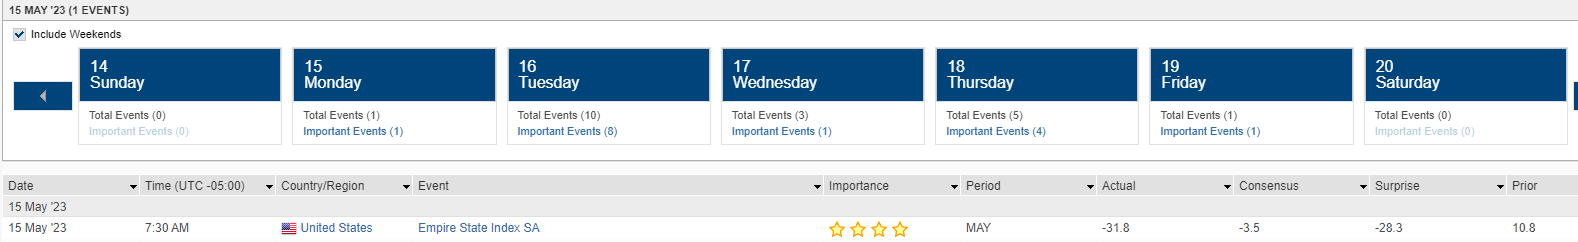
This morning we got jaw-droppingly terrible economic news out of New York.
The Fed's Empire State manufacturing index is a guide to how the industrial economy of New York is doing. Economists had been expecting a steep decline from 11 to -3.
Instead, we got a 42-point decline to -32.
- New orders were down 53 to -28
- shipments down 40 to -16.4
- employment down 4th straight month to -3.3
This is the 2nd fastest monthly decline in this index in history, second only to April 2020, when the government locked down the NY economy overnight.
That's slightly worse than the Philadelphia Manufacturing index, which came in this month at -31.3, the 2nd lowest ever recorded, behind April 2020.
In other words, New York and Pennsylvania's industrial economies are in a depression right now, or so the Fed data tells us.
Why the US Is Likely In A Manufacturing Recession
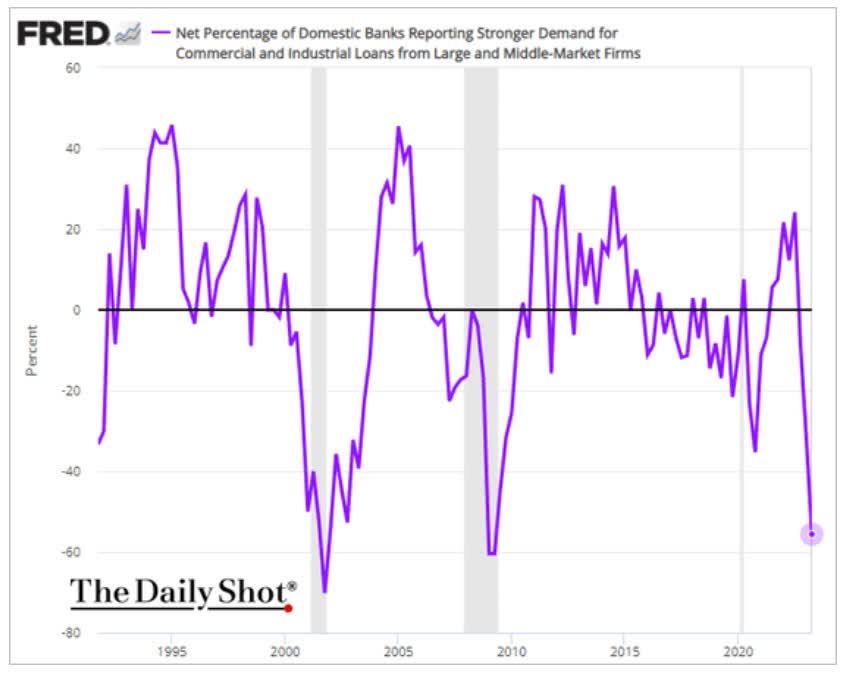
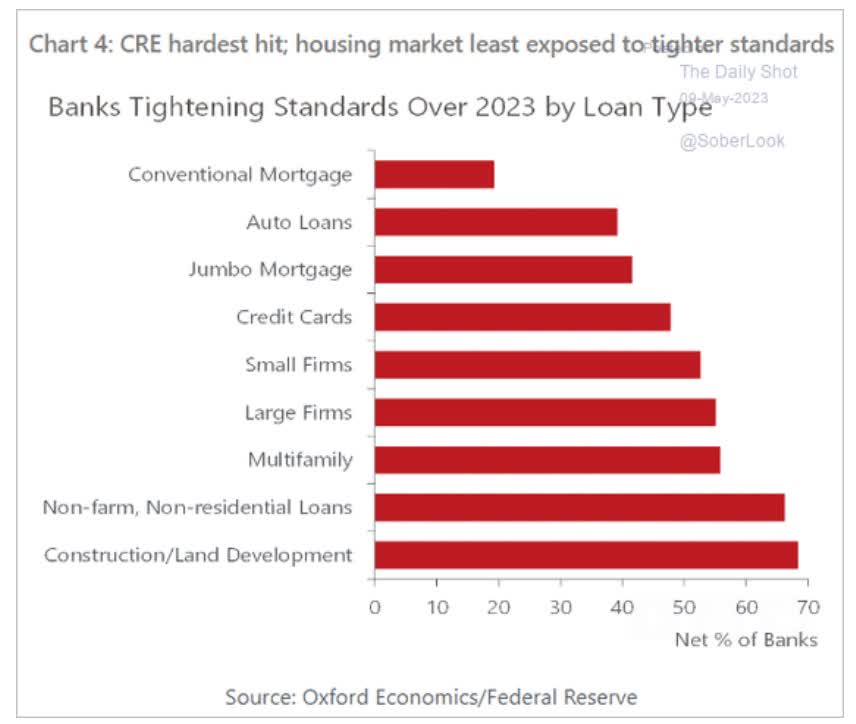
According to the Fed's Senior Loan Officer Opinion Survey or SLOOS, credit conditions are slamming shut for parts of the economy.
Meanwhile, Fed Presidents Bostik (Boston) and Neel Kashkari (Minneapolis) just said they don't support rate cuts this year... even if we're in a declared recession.
In fact, if inflation stays sticky, they will support further hikes.
So does this mean we're headed for depression? Manufacturing is 7% of the US economy, and consumer spending is 70%.
No, we're not headed for another Great Recession.
- though the last time all five economic headwinds were present at the same time was in 1932
The media headlines may get scary in a few weeks. You'll likely see and hear things like this:
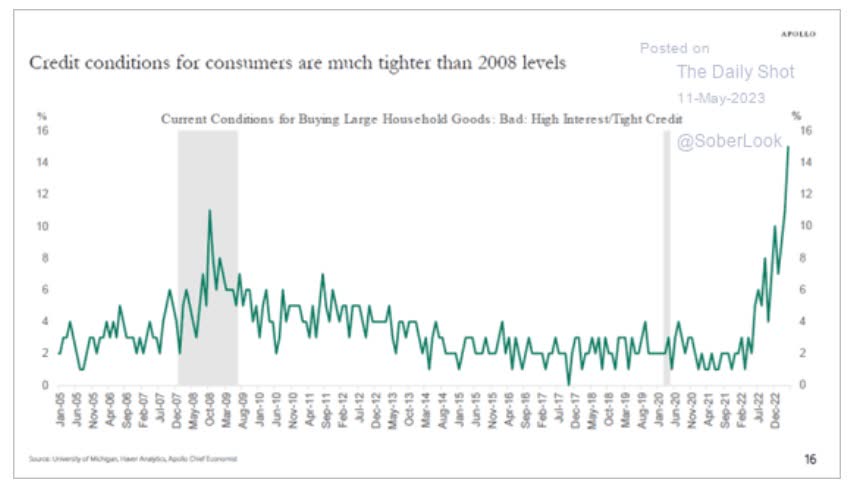
Credit conditions for consumers are tightening at the fastest rate in recorded history, almost twice as fast as the Great Recession.
You'll likely hear that the last time the US money supply fell by 10% YOY (as it did last week) was 1930. You might get a history lesson on the Depression.
It was the worst time in American history.
Seven hundred fifty thousand farmers lost their farms.
Nine thousand banks disappeared forever and took the life savings of 9 million American families.
Eleven million workers lost their jobs, almost 50% more than during the Great Recession, but there were almost three times fewer workers back then.
Unemployment soared from 3% to 25% in four years.
Eighty-six thousand businesses failed, and wages crashed by 43%.
The stock market fell 86% and didn't hit new highs until November 1954.
The good news is that we'll almost certainly never see another economic cataclysm like the Great Depression.
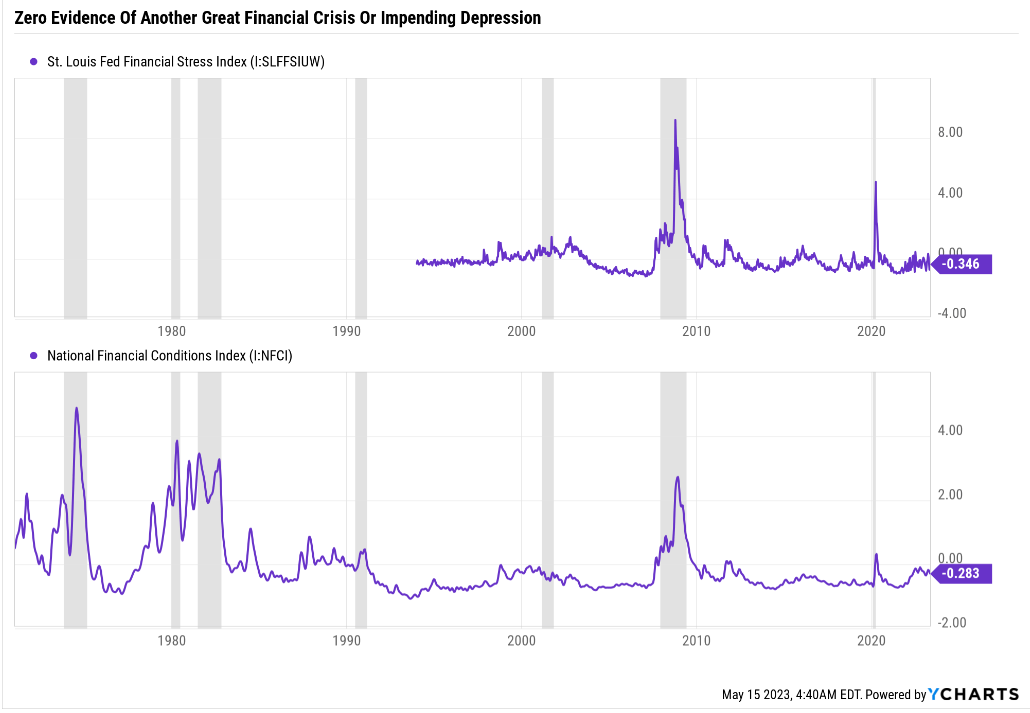
There are actually eight financial stress indicator charts from St. Louis and Chicago Fed, tracking 123 weekly updated metrics.
And I track them all.
If another Depression or GFC were coming, it would appear in these eight charts.
If a severe recession were coming, I would tell you immediately.
Why am I telling you this? Because I believe the stock market is NOT at all prepared for what the data says is now likely coming:
- -1.7% peak decline in GDP
- 9 to 12-month recession
Last week the consensus was a -0.9% GDP decline in a six-month recession.
- the historical average since WWII -1.4% GDP
- 9-month long recession
How do I know the S&P will likely become a house of horrors in the next few months (possibly by May 31st)?
Doesn't the fact that the S&P remains dead calm and stuck around 4,100 for months now prove the market isn't going to crash? Guess why the market is so eerily calm?
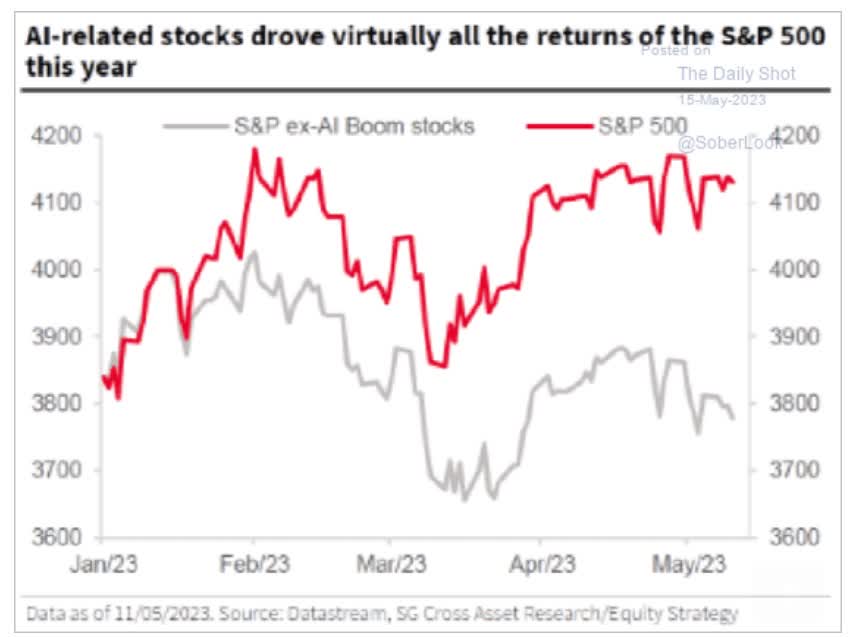
In my view, the entire market is being propped up by big tech, which is in an AI-inspired bubble.
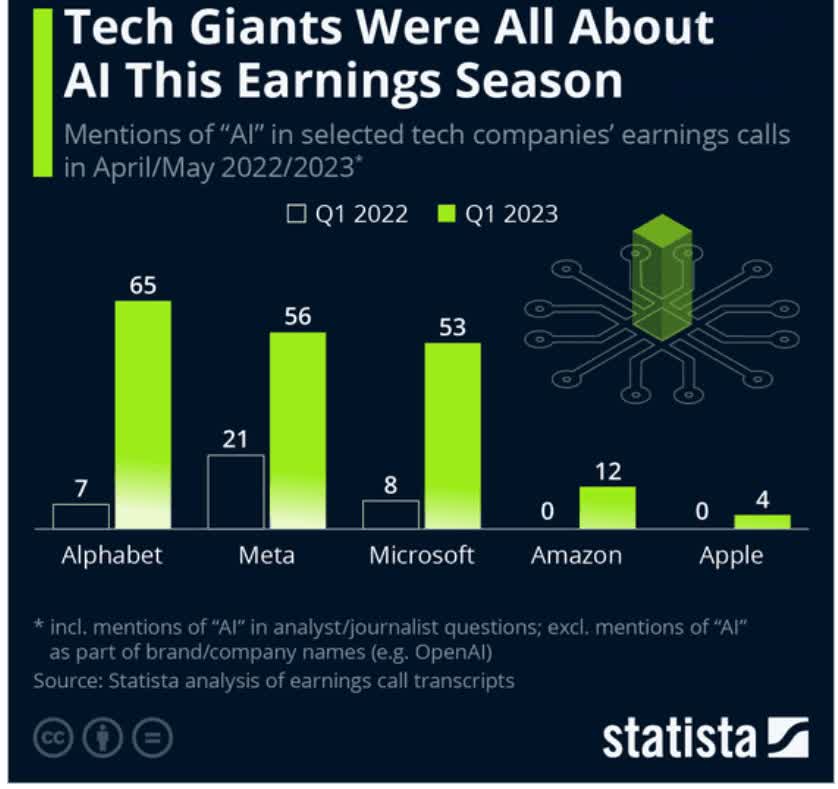
This bubble is being created by the companies themselves, hyping AI to the moon.
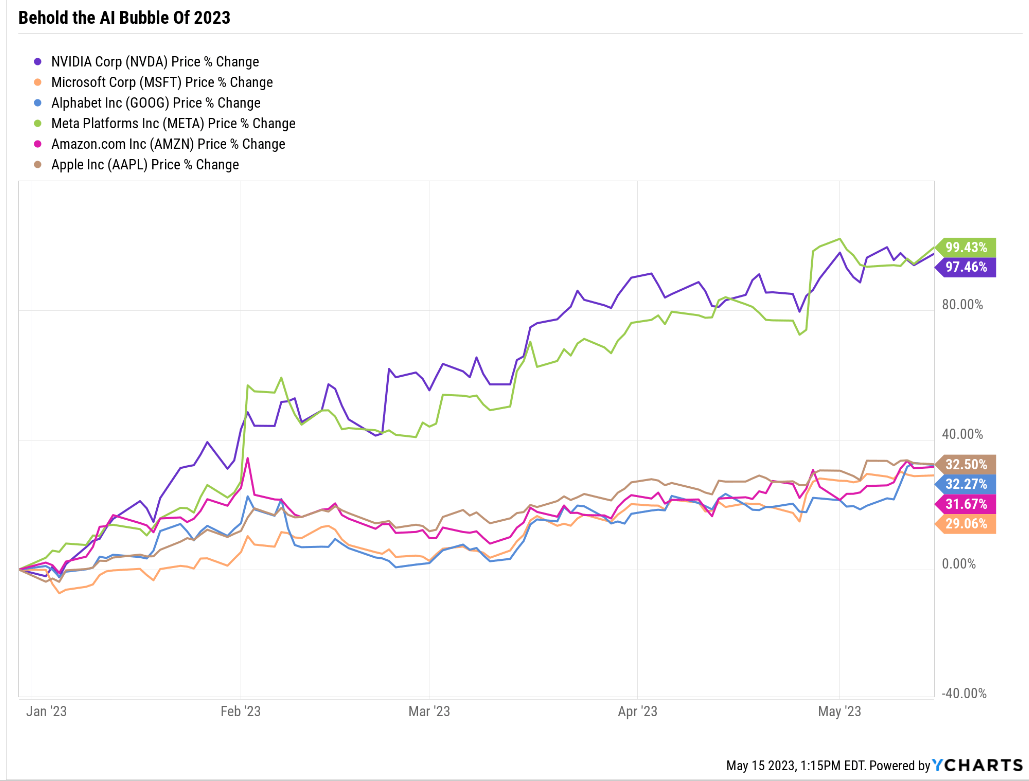
Guess what likely happens when the economy is twice as bad as economists expected, and super-cyclical NVIDIA (NVDA), the king of AI hype in 2023, announces earnings after the Bell on May 24th?
An earnings miss and weak guidance from NVIDIA could end the AI bubble of 2023.
Or the debt ceiling crisis could.
Or both.
Treasury, Goldman Sachs, Moody's
The point is that the market will likely experience a terrible few months until it finally reaches the final bottom.
- most likely Q4 to Q1
S&P Bear Market Bottom Scenarios
| Earnings Decline |
| S&P Trough Earnings |
| Historical Trough PE Of 14 (13 to 15 range) |
| Decline From Current Level |
| Peak Decline From Record Highs |
| 0% (blue-chip consensus, mildest recession in history) |
| 228 |
| 3194 |
| 22.6% |
| -33.7% |
| 5% |
| 217 |
| 3034 |
| 26.4% |
| -37.0% |
| 10% |
| 205 |
| 2875 |
| 30.3% |
| -40.4% |
| 13% (average recession, Moody's 2-month default scenario) |
| 198 |
| 2779 |
| 32.6% |
| -42.3% |
| 15% |
| 194 |
| 2715 |
| 34.2% |
| -43.7% |
| 20% |
| 183 |
| 2555 |
| 38.0% |
| -47.0% |
| 25% |
| 171 |
| 2395 |
| 41.9% |
| -50.3% |
| 30% (JEC 3-month default scenario) |
| 160 |
| 2236 |
| 45.8% |
| -53.6% |
(Source: Dividend Kings S&P Valuation Tool)
A base-case 23% market decline to 3,200 on the S&P is also what the blue-chip consensus expects.
And the data is lining up that way.
Why You Should NOT PANIC In The Face Of Impending Market Horror
My goal is to immunize you against the crazy headlines that I anticipate news outlets will trot out and unleash on you.
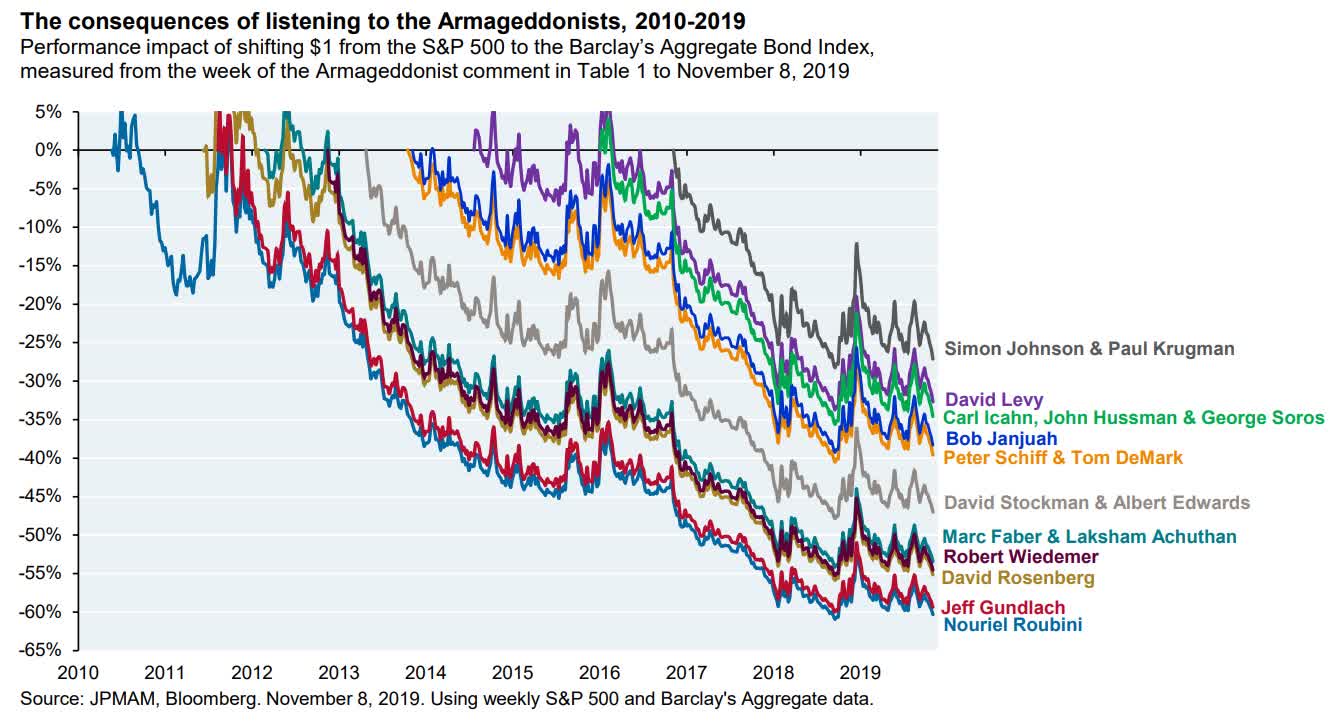
I am not a permabear; I'm a long-term bull. But when the data says, "prepare for a hurricane," I get in my storm cellar and tell others to do the same.
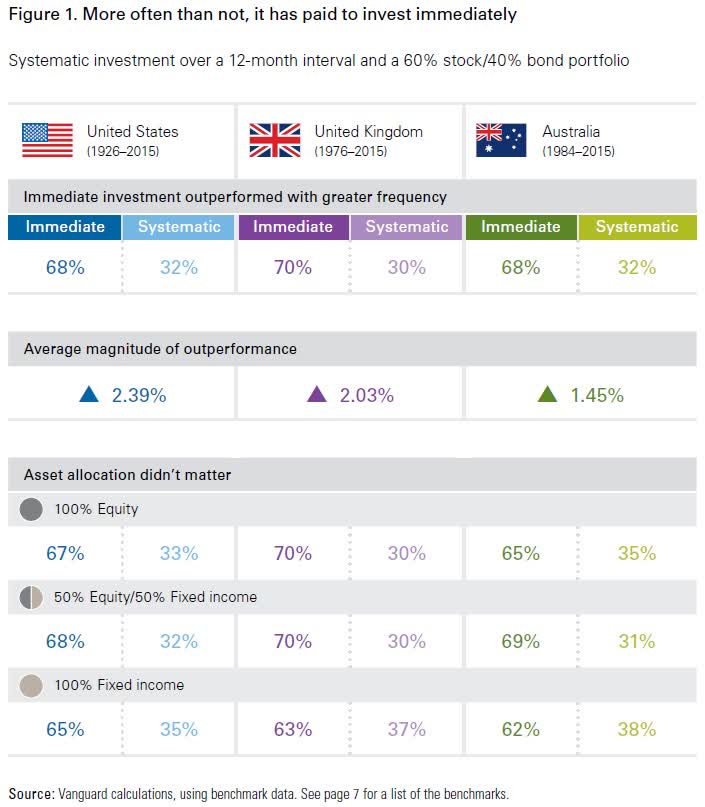
The doomsday prophets will never tell you when it's time to buy stocks.
The answer? 70% of the time, investing 100% of your discretionary savings immediately is optimal.
When it's time to start pounding the table, banging the gavel, hammering your fist, filling the hauler, loading the mini-van, packing the dump truck, cramming the super plane, and backing up the train on the world's best blue-chips, believe me, I'll tell you ;)
Get Ready To Fill The Largest Plane In History With Your Favorite Blue-Chip Bargains (Wikipedia)
How bad is a 1.7% GDP recession?
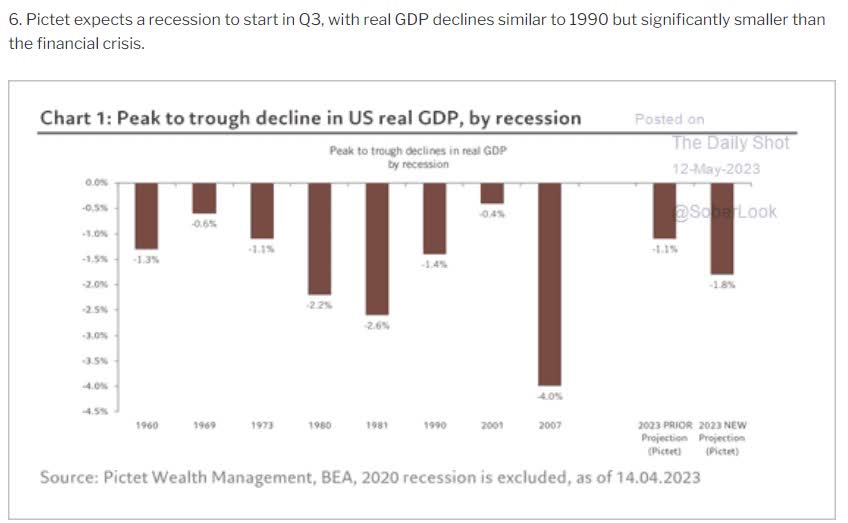
Milder than the 1980 and 1981 recessions and slightly worse than the average recession. But it's about 60% milder than the Great Recession and 40% milder than the Pandemic.
And let's not forget why we sit through bear markets in the first place.
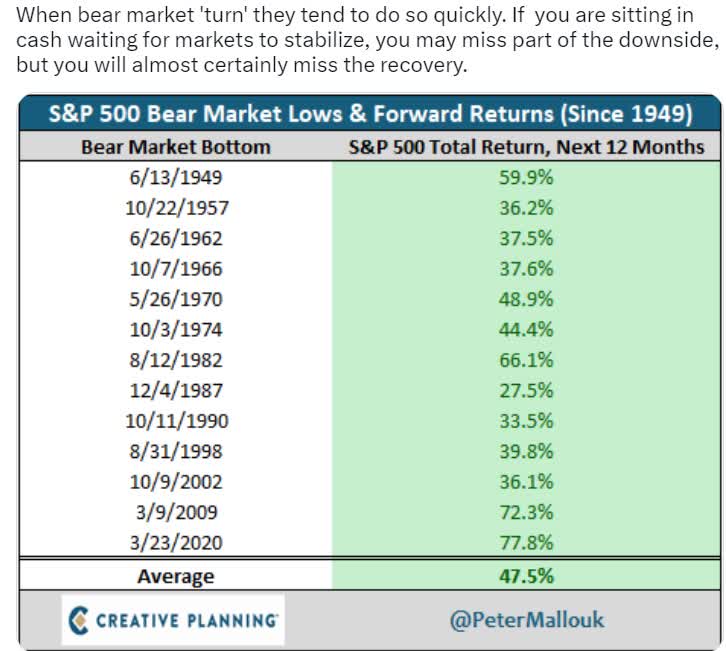
As soon as the bear market bottoms (and no one will tell you when that is), the market takes off and 12 months later has delivered Buffett-like returns.
Miss this first-year rally - your long-term returns will be 50% to 66% lower.
So let me show you how to build the ultimate Buffett-style dividend aristocrat portfolio, with the widest moats, strongest balance sheets, and volatility so low it rode over the Great Recession like a Rolls Royce riding over a pothole.
How To Find The Widest Moat Dividend Aristocrats At Good To Great Prices
It's far better to buy wonderful companies at fair prices, than fair companies at wonderful prices. - Warren Buffett
Let me show you how to screen the Dividend Kings Zen Research Terminal, which runs off the DK 500 Master List, to find the widest moat dividend aristocrats you can buy at reasonable to great prices.
- the most Buffett-style aristocrats in the world
The Dividend Kings 500 Master List includes some of the world's best companies, including:
- Every dividend champion (25+ year dividend growth streaks, including foreign aristocrats)
- Every dividend aristocrat
- Every dividend king (50+ year dividend growth streaks)
- Every Ultra SWAN (as close to perfect quality companies as exist)
- The 20% highest quality REITs, according to iREIT
- 40 of the world's best-growth blue chips
The key with any screen is to remember that whatever metric you're targeting is never enough on its own.
- Valuation always matters
- Total return always matters
- Total return is yield + growth + changes in valuation
In other words, you don't want a wide moat aristocrat with a 1% yield and 2% growth rate because that's 3% long-term returns. You can buy T-bill ETFs yielding 5% with virtually no volatility and no fundamental risk that will do better long-term.
| Step |
| Screening Criteria |
| Companies Remaining |
| % Of Master List |
| 1 |
| Dividend Champions List |
| 133 |
| 26.60% |
| 2 |
| Reasonable Buy or better (nothing overvalued) |
| 79 |
| 15.80% |
| 3 |
| Long-Term Total Return Potential 10% (Market-Level) |
| 49 |
| 9.80% |
| 4 |
| Non-Speculative (No Turnaround Stocks, investment grade) |
| 49 |
| 9.80% |
| 5 |
| Sort By Return On Capital |
| 0.00% |
| 6 |
| Select 12 Highest Return On Capital Aristocrats |
| 0.00% |
| 7 |
| Use "build your watchlist" to get just those 12 aristocrats |
| 11 |
| 2.20% |
| Total Time |
| 2 Minutes |
11 Blue-Chips For The Ultimate Buffett-Style Dividend Aristocrat Portfolio
I've linked to articles about each company to help you with further research.
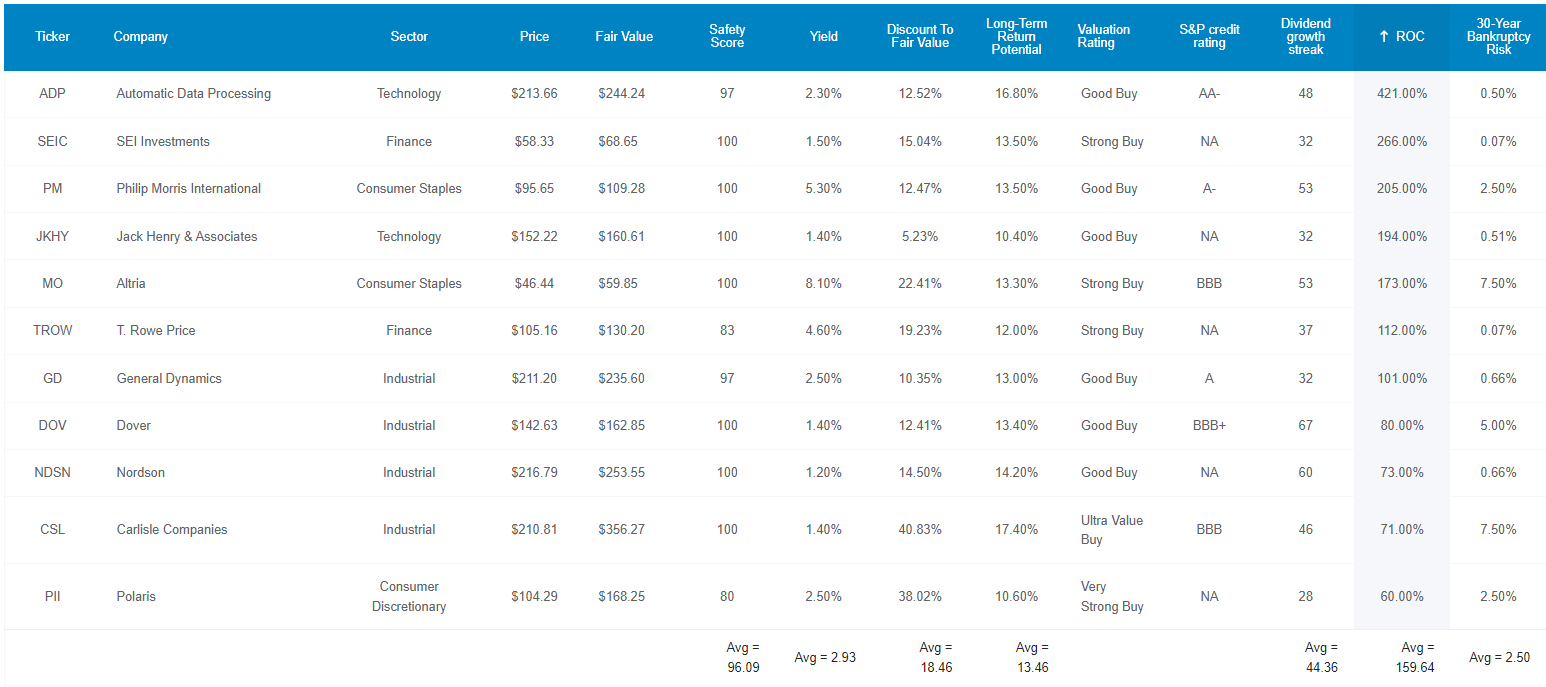
Here they are in order of highest return on capital (widest moat).
- Automatic Data Processing ( ADP )
- SEI Investments ( SEIC )
- Philip Morris International ( PM )
- Jack Henry & Associates ( JKHY )
- Altria ( MO )
- T. Rowe Price ( TROW )
- General Dynamics ( GD )
- Dover ( DOV )
- Nordson ( NDSN )
- Carlisle Companies ( CSL )
- Polaris ( PII )
Fundamental Summary
- yield: 2.9%
- dividend safety score: 96% (1.2% severe recession cut risk)
- dividend growth streak: 44 years
- credit rating: A- stable = 2.5% 30-year bankruptcy risk
- long-term growth consensus: 10.2% vs. 8.5% S&P
- total return potential: 13.3% vs. 10.2% S&P and 12.0% Nasdaq
- discount to fair value: 19% (27% upside to fair value)
- consensus 5-year return potential: 13.3% + 4.3% valuation boost = 17.7% = 126% total return consensus vs. 60% S&P 500
- return on capital: 160% = 16X S&P 500 and almost 2X dividend aristocrats = wide moat
How would you like twice the yield of the S&P and 3X the yield of the Nasdaq with superior long-term return potential and 16X higher quality and wider moats than the broader market?
That's what these 11 wide-moat Buffett-style aristocrats offer.
Historical Returns Since 1990
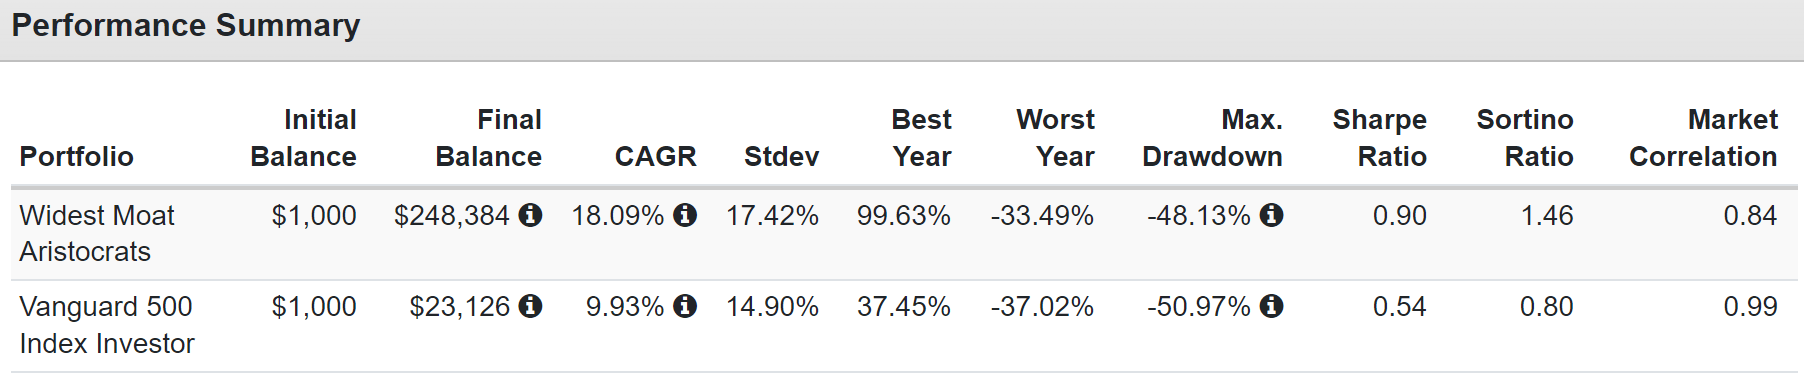
Explosive returns for 34 years from these wide moat aristocrats, who turned $1 into almost $250, 12X more than the S&P 500.
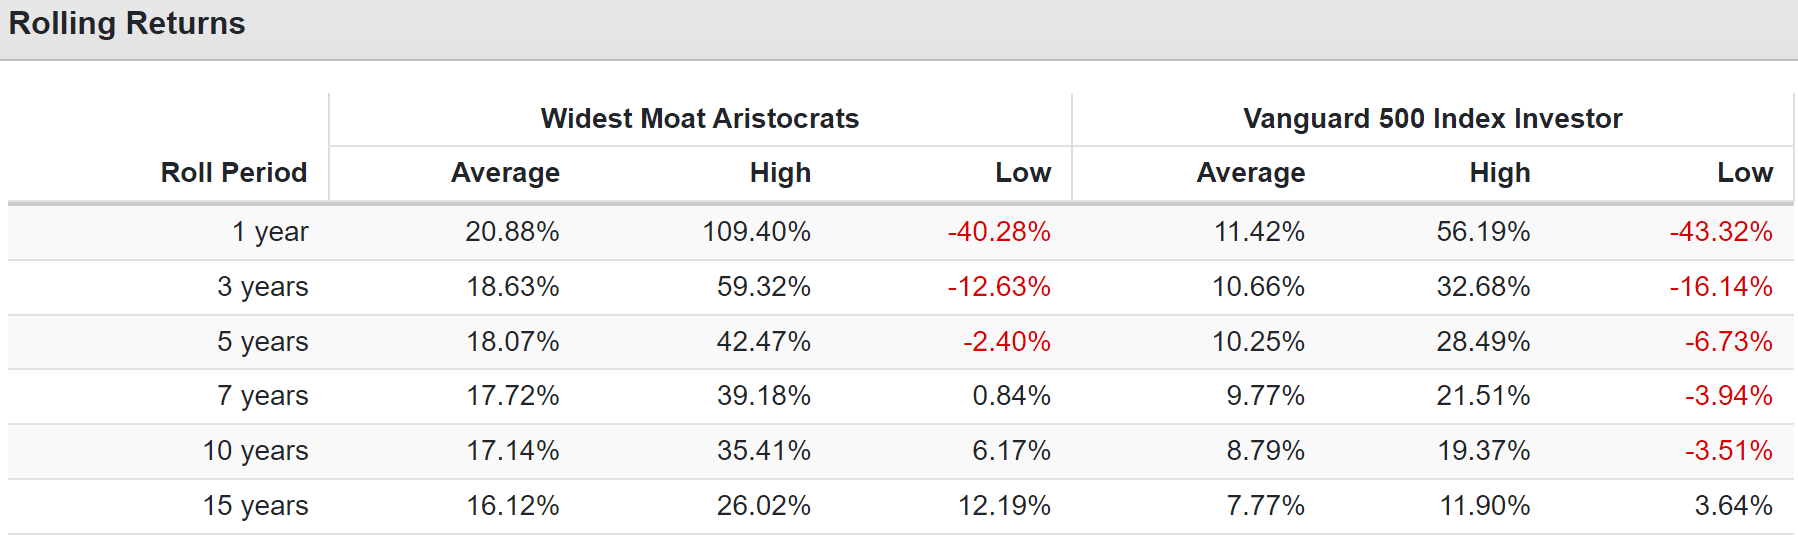
This portfolio very consistently doubled the market's returns. In the future, 33% better returns are expected.
16% Annual Income Growth For A Third Of A Century = 524% Yield On Cost
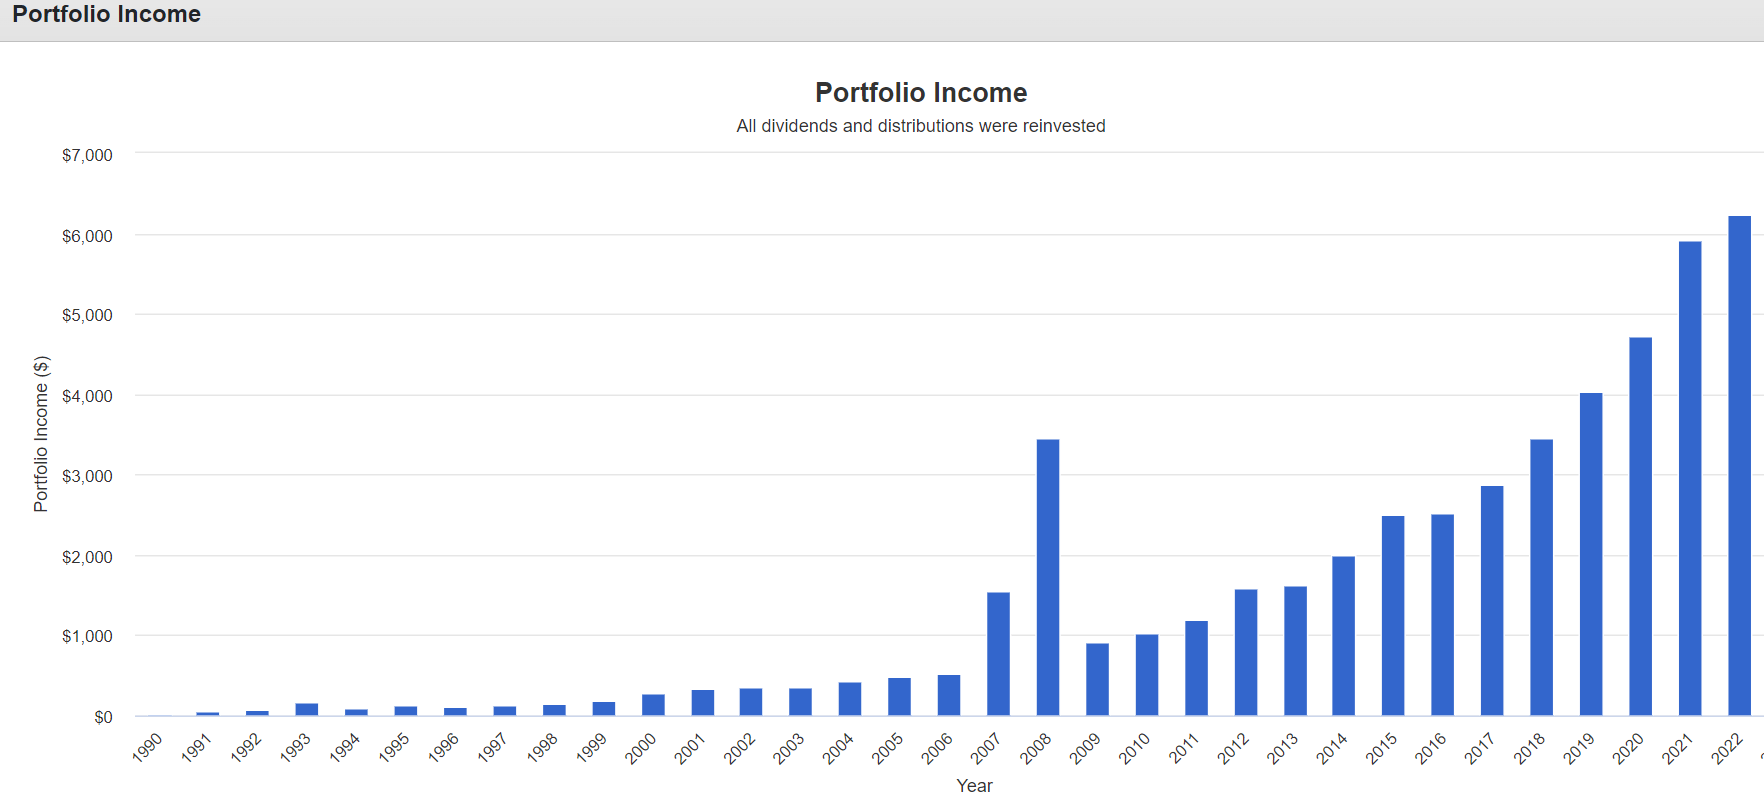
So generous and very safe yield from proven market-crushing world-beater Buffett-style wide moat aristocrats.
What about the impending house of horrors for the stock market?
How To Build The Ultimate Buffett-Style Wide Moat Aristocrat SWAN Portfolio
There is no question of the quality or moatiness of these businesses. But what about the potential 22% market correction that could start any day now?
Ultra SWAN means the world's best companies; it has nothing to do with volatility.
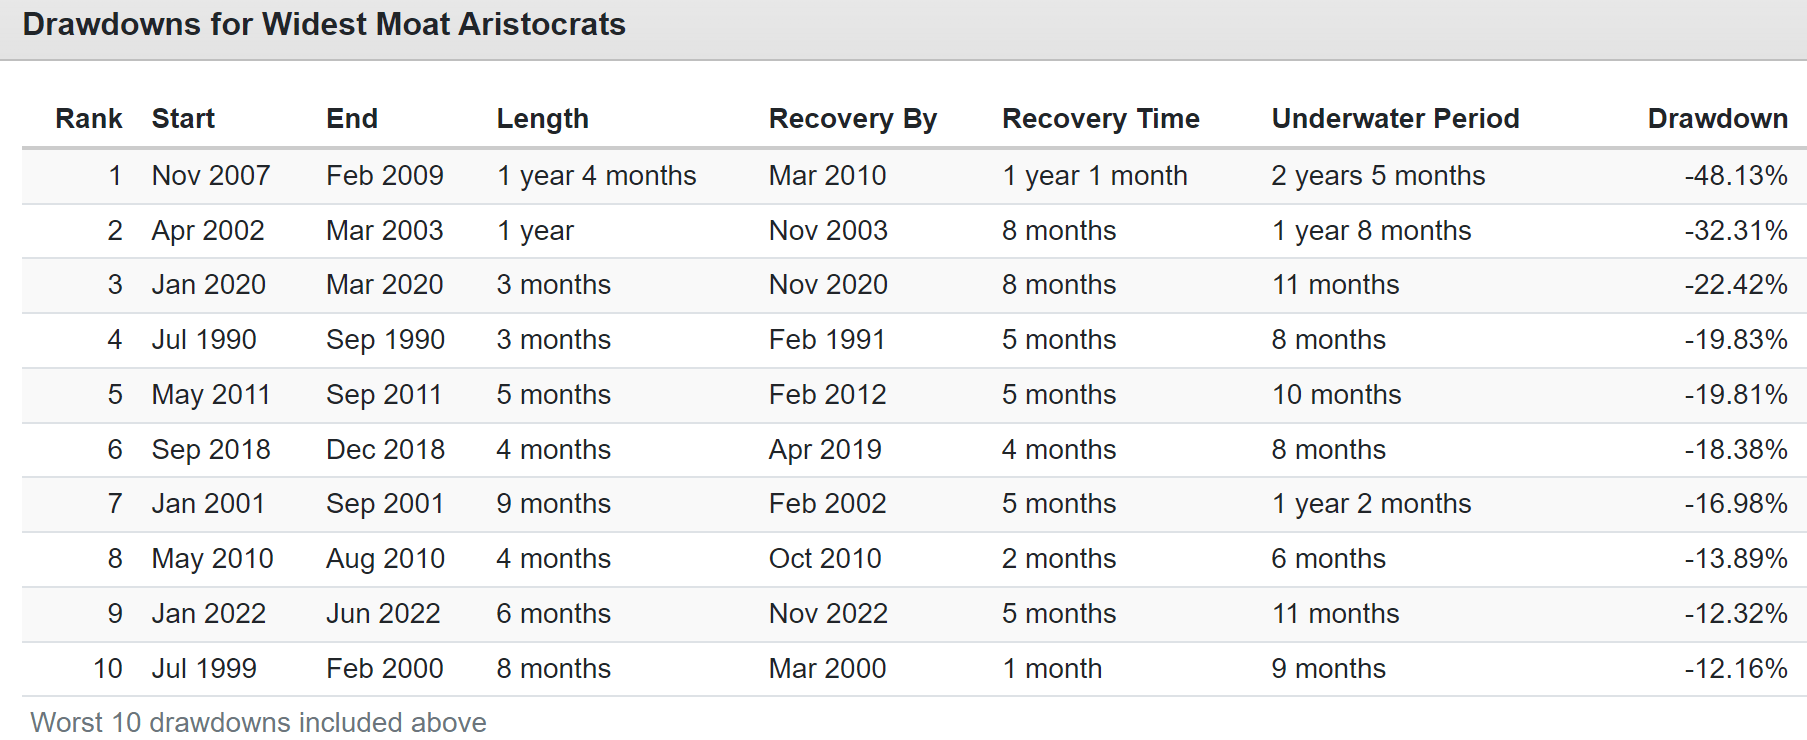
There have been plenty of bear markets over the decades, though in the 2022 stagflation hell, these wide-moat aristocrats only fell 12% when the market was down 28%.
Let me show you how to profit from the inherent volatility of blue-chips, so you can come out of the other side of the economic hurricane stronger and richer than ever.
Bonds + Managed Futures: Letting You Be "Greedy When Others Are Fearful"
Do you know why Buffett never worries about 30%, 40%, or even 50% market crashes? Because Berkshire generates $25 billion per year in free cash flow and he's sitting on $130 billion in cash.
Buffett owns the world's best companies... and always has money to buy more in bear markets.
You probably don't own insurance companies, and thus might think that you need cash set aside for bear market blue-chip buying.
Actually, you need non-correlated blue-chip assets that zig when the market zags.
Consider the DK ZEUS strategy: Zen Extraordinary Ultra Sleep-Well-At-Night
Consider adding a 16.67% allocation to long-duration bonds like ( EDV ).
And a 16.67% allocation to managed futures like ( KMLM ).
Take a look at what this balanced Zen Extraordinary Ultra Sleep Well At Night or ZEUS Wide Moat aristocrat portfolio does.
- 16.66% EDV
- 16.66% KMLM
- 6.1% each of the 11 widest moat aristocrats
ZEUS Wide Moat Aristocrat Vs. 60/40
| Metric |
| 60/40 |
| ZEUS Wide Moat Aristocrat Portfolio |
| X Better Than 60/40 |
| Yield |
| 2.1% |
| 4.1% |
| 1.95 |
| Growth Consensus |
| 5.1% |
| 7.0% |
| 1.37 |
| LT Consensus Total Return Potential |
| 7.2% |
| 11.1% |
| 1.54 |
| Risk-Adjusted Expected Return |
| 5.0% |
| 7.8% |
| 1.54 |
| Safe Withdrawal Rate (Risk And Inflation-Adjusted Expected Returns) |
| 2.8% |
| 5.5% |
| 1.99 |
| Conservative Time To Double (Years) |
| 26.0 |
| 13.1 |
| 1.99 |
(Source: DK Research Terminal, FactSet)
Twice the yield of a 60/40, 54% better return potential, twice the safe withdrawal rate, and it's expected to double in half the time.
By the time you turn $1 into $2 with a 60/40, adjusted for inflation, this high-yield wide moat aristocrat portfolio could have quadrupled.
ZEUS Wide Moat Aristocrat Vs. S&P 500
| Metric |
| S&P |
| ZEUS Wide Moat Aristocrat Portfolio |
| X Better Than S&P 500 |
| Yield |
| 1.7% |
| 4.1% |
| 2.41 |
| Growth Consensus |
| 8.5% |
| 7.0% |
| 0.82 |
| LT Consensus Total Return Potential |
| 10.2% |
| 11.1% |
| 1.09 |
| Risk-Adjusted Expected Return |
| 7.1% |
| 7.8% |
| 1.09 |
| Safe Withdrawal Rate (Risk And Inflation-Adjusted Expected Returns) |
| 4.9% |
| 5.5% |
| 1.13 |
| Conservative Time To Double (Years) |
| 14.8 |
| 13.1 |
| 1.13 |
(Source: DK Research Terminal, FactSet)
Almost 3X the yield of the S&P with higher return potential? That's impressive and shows the ZEUS strategy isn't just for retirees. Even young people with decades before retirement can benefit from it.
Let me show you why.
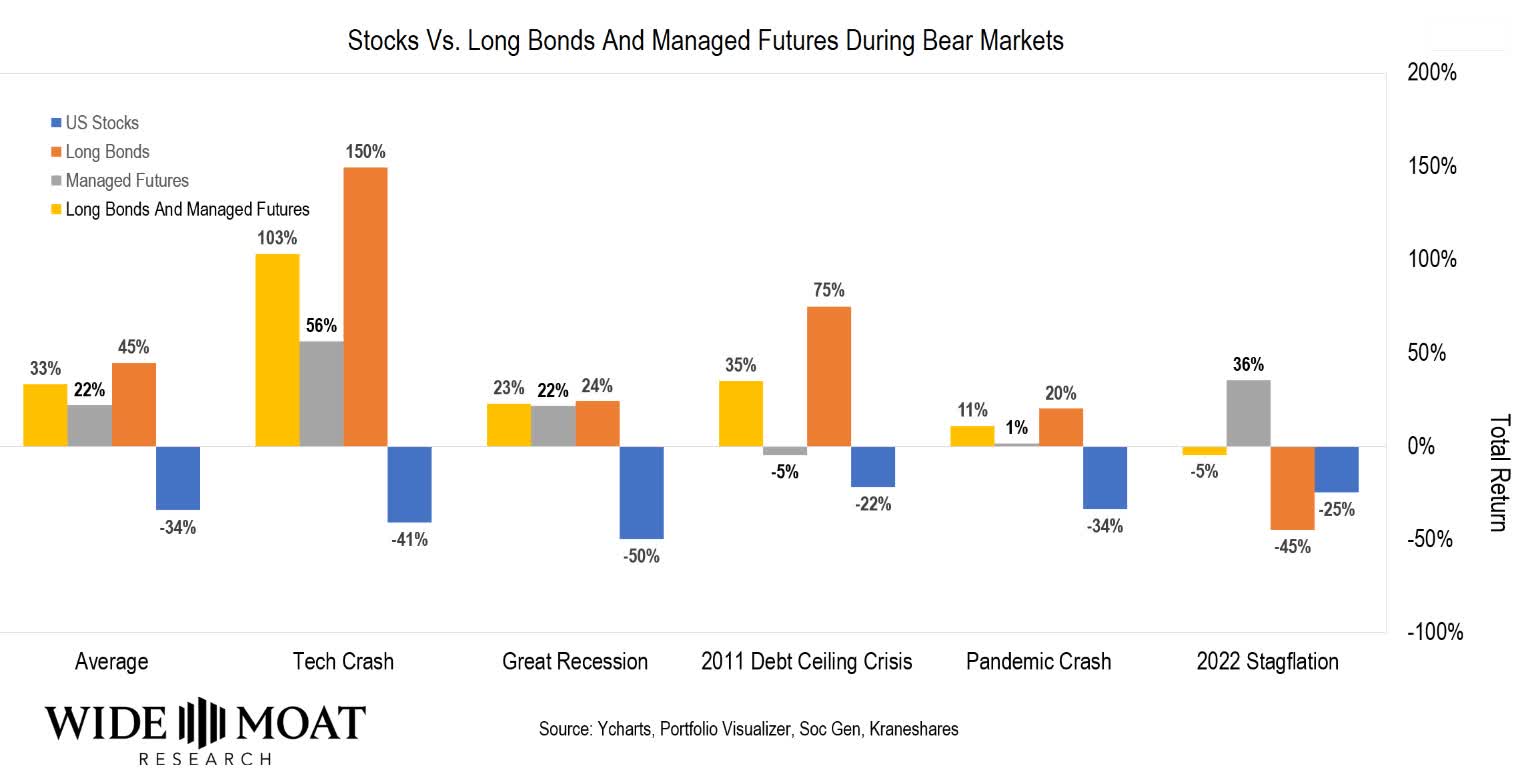
Long-duration bonds are the best long-term hedging strategy, according to Duke University.
Managed futures are the 2nd best and the #1 strategy during stagflation.
Since 1970 there has only been one bear market in which this strategy didn't deliver a positive return in a crashing market. 2022 was the worst bond bear market in history, and even then, the hedging strategy suffered a peak decline of 5%, compared to the S&P 500's 28%, a 60/40's 21%, and the Nasdaq's 35%.
In the coming recession?
- TD, HSBC, Morgan Stanley, and JPMorgan think 30-year yields will hit 2.75%
- 26% to 33% upside potential for 30-year bonds
But that 2.75% is hardly the best-case scenario.
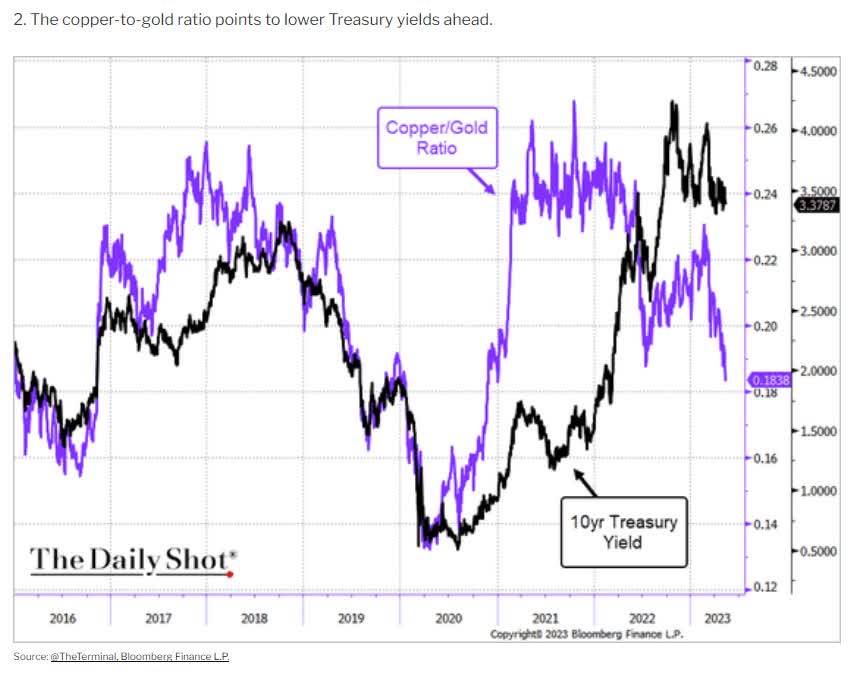
The copper/gold ratio signals that 10-year yields might fall to 2% in this recession and 30-year yields about 2.25%.
- 37% to 47% rally in bonds in that scenario
In 2011's debt ceiling crisis, 30-year yields fell 2.5%, and long bonds rallied 60% to 75%.
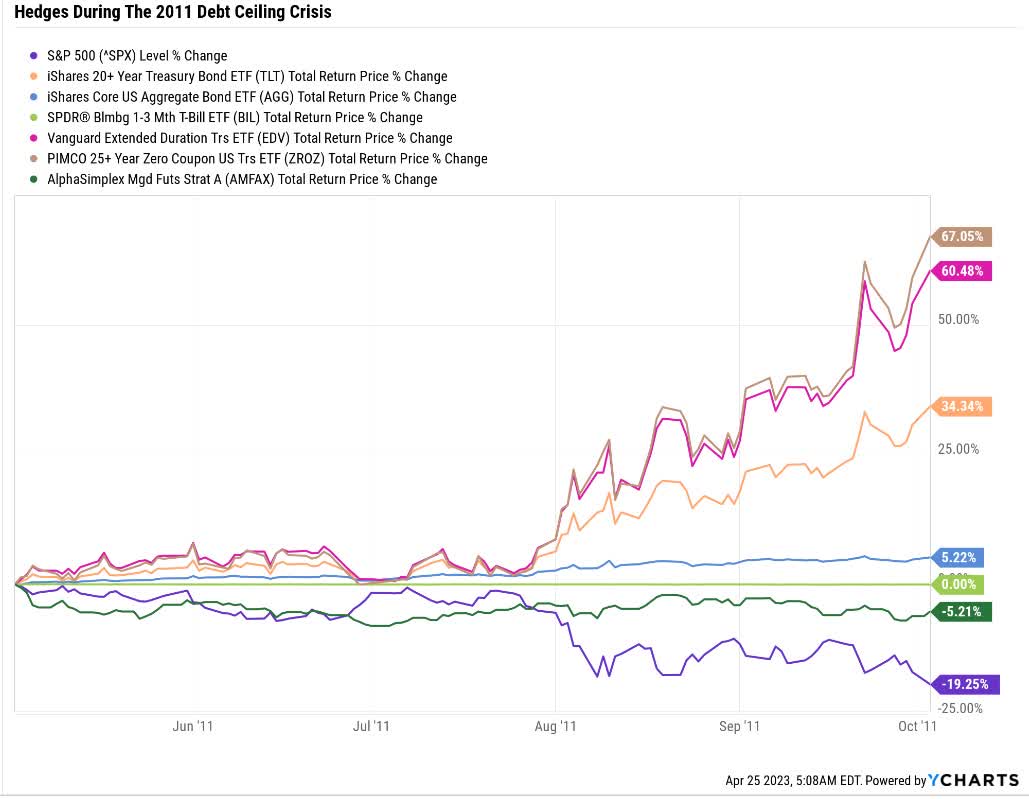
If we actually default on our debt, there is a 10% chance, according to Moody's (13% betting markets), then the longest ration bonds are the safest.
- if the US stays defaulted for 30 years, the world has ended, and we will have bigger problems than our bond portfolios
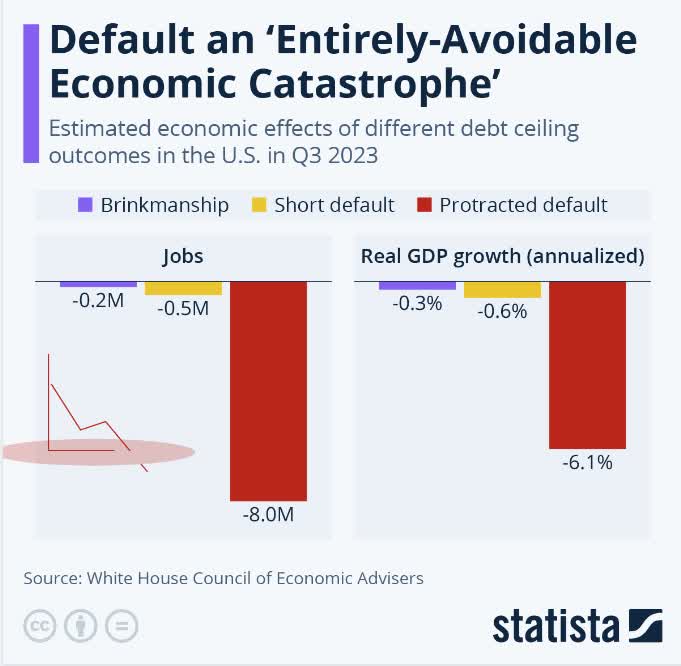
A 3-month default crates a recession 50% worse than the Great Recession.
A six-month default puts us into a depression, and a year of default would recreate the Great Depression.
You can imagine what happens if we remain defaulted for two, five, ten, or thirty years.
- the global economy is in ruins
- the living envy the dead
- your portfolio is the least of your concerns
Why is it worth considering owning some hedges?
Because long bonds + hedges historically average the mirror image of the market's decline.
- 33% gains in the average bear market since 2000
- market's average loss is 34%
Imagine the benefits of 33% of your portfolio going up 33% when stocks fall 34%.
Lower volatility? Sure. But young investors don't care about volatility (or they shouldn't).
But this is where hedges can help you bend it like Buffett in a bear market.
Bend It Like Buffett With Blue-Chip Bargains In A Bear Market With Bonds
Imagine the stock market falls 22%, the base-case for the blue-chip consensus.
You have a $100,000 portfolio that's 33% bonds and managed futures.
| Asset |
| Allocation |
| Position Pre-Correction |
| Position Post-Correction |
| Gain/Loss |
| Hedges |
| 33% |
| $33,333.33 |
| $40,666.67 |
| 22.0% |
| Stocks |
| 67% |
| $66,666.67 |
| $52,000.00 |
| -22.0% |
| Total |
| $100,000.00 |
| $92,666.67 |
| -7.3% |
Imagine a high-yield portfolio that falls 7% in 22% bear market.
You can sell your excess hedges at a profit to rebalance into stocks.
What if the market keeps falling? What if the average recession becomes a severe recession?
Then you still have your 33% hedge allocation.
Those hedges will likely keep rising as the market falls.
You can keep rebalancing into better and better blue-chip bargains.
In other words, the worse the market crash becomes, the more money you mint to buy blue-chips with.
The bigger the crash, the bigger the bargains, and the more life-changing the returns will be when the bear market finally ends.
This is how the best hedging strategy of the last 53 years can help you bend it like Buffett by buying blue-chip bargains in bear markets.
What's the long-term benefit to this strategy?
- adjusted for taxes about 20% better long-term returns
- 11.1% buy and hold returns become 13.3% long-term returns using the Super ZEUS rebalancing strategy
What kind of difference does that extra 2.2% in potential long-term returns mean over time?
- 81% more inflation-adjusted wealth over 30 years
- better long-term returns than the Nasdaq
Sounds incredible? Too good to be true? It's not. It's the power of ZEUS at work.
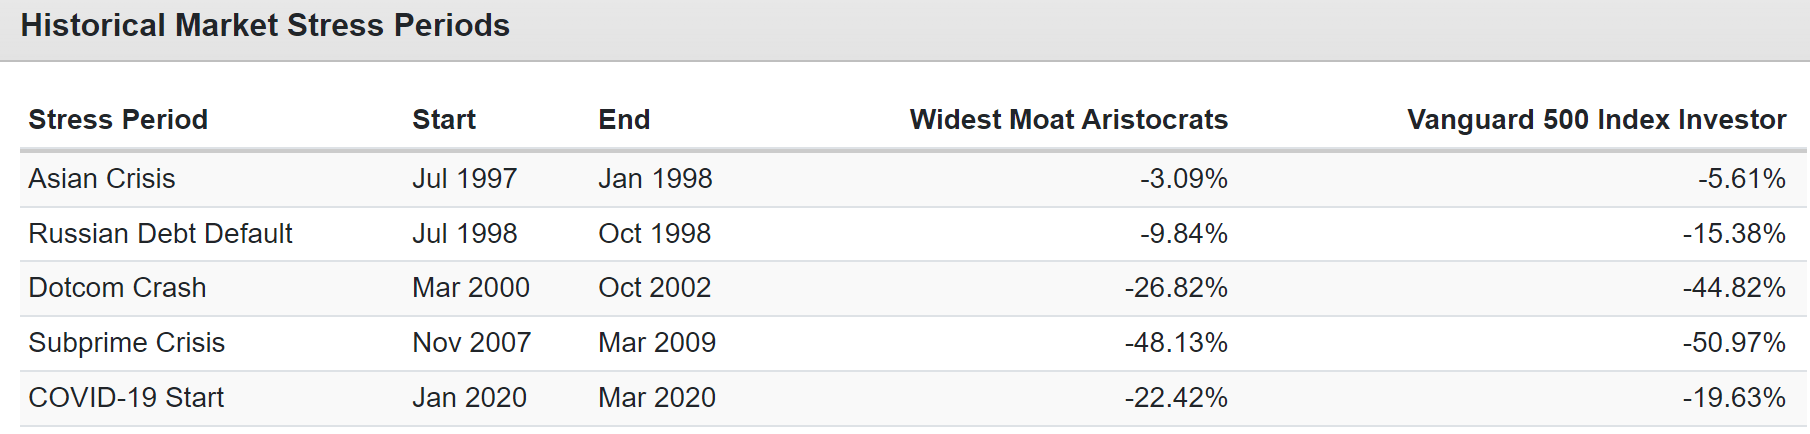
Historical Total Returns Since December 2007 (Start Of The Great Recession)
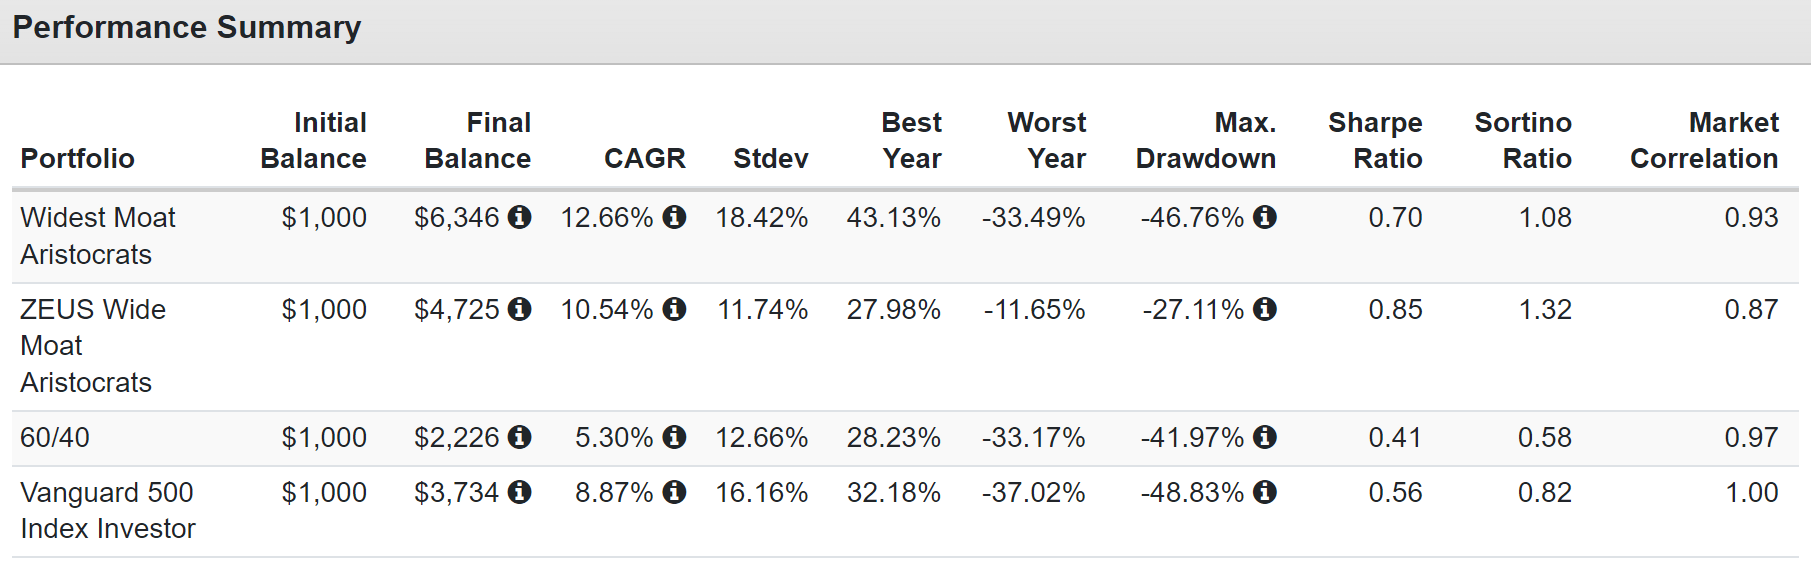
Much better returns than the 60/40 and even better than the S&P, exactly as expected.
But with annual volatility lower than 60/40, a peak decline that's half as bad as the S&P, even in the 2nd worst market crash in US history, and almost 3X better negative-volatility-adjusted returns than a 60/40 and 60% better than the S&P 500.
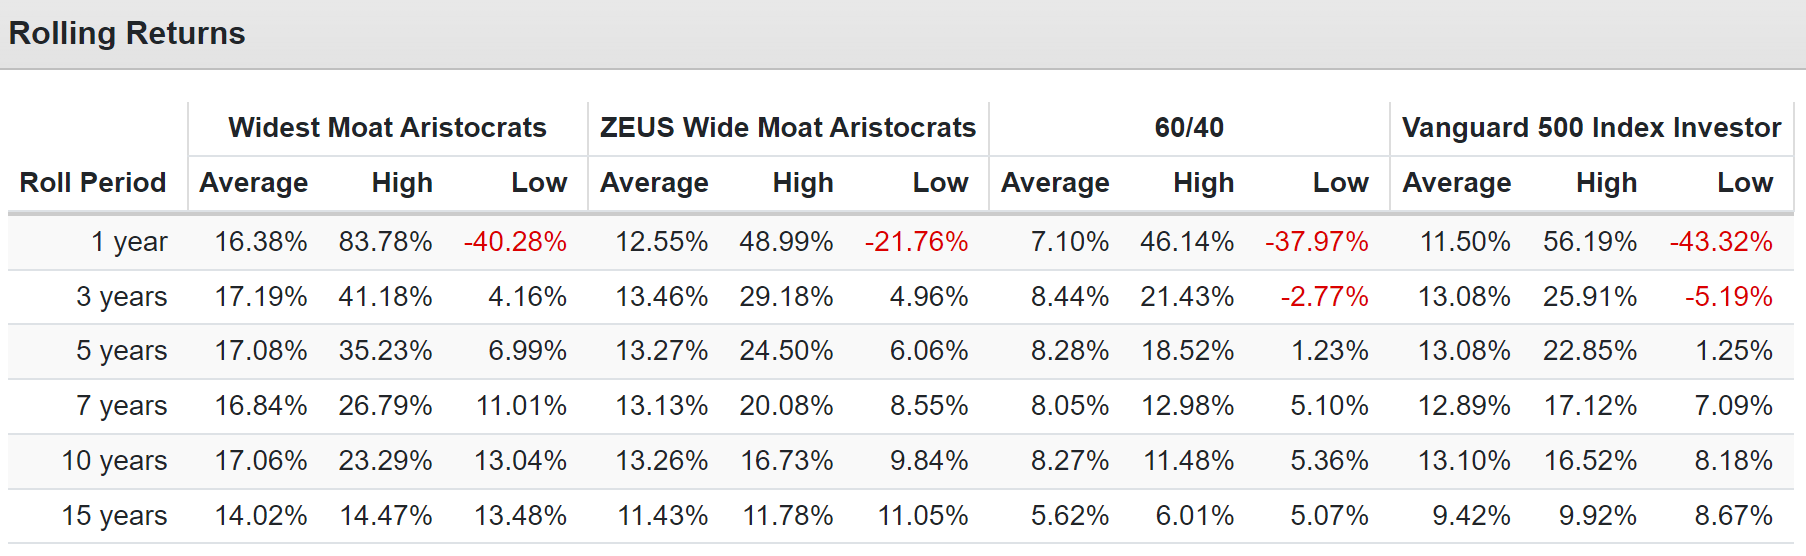
Average 12-month rolling returns that beat the S&P and run circles around a 60/40.
Bottom Line: Wide Moat, Buffett-Style Aristocrats Are A Great Way To Profit From The Coming Market Mayhem
I'm not saying that ADP, SEIC, PM, JKHY, MO, TROW, GD, DOV, NDSN, CSL, or PII are not going to fall in the coming correction.
- yield: 2.9%
- dividend safety score: 96% (1.2% severe recession cut risk)
- dividend growth streak: 44 years
- credit rating: A- stable = 2.5% 30-year bankruptcy risk
- long-term growth consensus: 10.2% vs. 8.5% S&P
- total return potential: 13.3% vs. 10.2% S&P and 12.0% Nasdaq
- discount to fair value: 19% (27% upside to fair value)
- consensus 5-year return potential: 13.3% + 4.3% valuation boost = 17.7% = 126% total return consensus vs 60% S&P 500
- return on capital: 160% = 16X S&P 500 and almost 2X dividend aristocrats = wide moat
These are some of the world's highest quality, safest, and widest moat businesses.
They are trading at a highly attractive valuation. Not just Buffett's "wonderful companies at fair prices" but downright wonderful prices.
They almost all will. That's not the point. The point is that these Ultra SWAN Buffett-style wide moat aristocrats offer exceptional fundamentals that can see you through the maelstrom so you can ride that glorious new bull market on the other side of the economic hurricane.
And look what happens if you add bonds and managed futures to boost yield and reduce volatility by 60% during bear markets.
| Bear Market |
| ZEUS Wide Moat Aristocrat |
| 60/40 |
| S&P |
| Nasdaq |
| 2022 Stagflation |
| -8% |
| -21% |
| -28% |
| -35% |
| Pandemic Crash |
| -10% |
| -13% |
| -34% |
| -13% |
| 2018 |
| -13% |
| -9% |
| -21% |
| -17% |
| 2011 |
| -6% |
| -16% |
| -22% |
| -11% |
| Great Recession |
| -27% |
| -44% |
| -58% |
| -59% |
| 2008 |
| -12% |
| -33% |
| -37% |
| -42% |
| Average |
| -13% |
| -23% |
| -33% |
| -30% |
| Median Decline |
| -11% |
| -19% |
| -31% |
| -26% |
(Source: Portfolio Visualizer Premium)
A 45% smaller peak decline than a 60/40 and a 60% smaller peak decline than the S&P in the average bear market over the last 15 years.
Higher safe yield, better returns, and volatility so low it's like riding over the worst market potholes in a Rolls Royce.
ZEUS Wide Moat Aristocrat Vs. 60/40
| Metric |
| 60/40 |
| ZEUS Wide Moat Aristocrat Portfolio |
| X Better Than 60/40 |
| Yield |
| 2.1% |
| 4.1% |
| 1.95 |
| Growth Consensus |
| 5.1% |
| 7.0% |
| 1.37 |
| LT Consensus Total Return Potential |
| 7.2% |
| 11.1% |
| 1.54 |
| Risk-Adjusted Expected Return |
| 5.0% |
| 7.8% |
| 1.54 |
| Safe Withdrawal Rate (Risk And Inflation-Adjusted Expected Returns) |
| 2.8% |
| 5.5% |
| 1.99 |
| Conservative Time To Double (Years) |
| 26.0 |
| 13.1 |
| 1.99 |
(Source: DK Research Terminal, FactSet)
And if you rebalance using the super ZEUS rebalancing strategy, you can boost those returns by 20% (after taxes).
In other words, you can earn the same returns as unhedged aristocrats... but with higher yield, 60% smaller bear market declines, and can sleep well at night no matter what the market or economy is doing.
What about 2022? The worst bond bear market in history? This portfolio fell just 8%, 72% less than the S&P.
Bring on the recession, bring on the debt ceiling, and bring on Powell and his crusade against inflation.
When you own the best companies and world-beater blue-chip assets, protected by wide moats, strong balance sheets, and battle-tested management, retiring in safety and splendor isn't a matter of luck.
It's just a matter of patience and time.
For further details see:
11 Blue-Chips For The Ultimate High-Yield Buffett-Style Dividend Aristocrat Portfolio