WDI - 12% Portfolio Yield And 10% Income Growth With Oversold Purchase Strategy
2023-06-30 15:26:27 ET
Summary
- This article displays the first 6 months of 2023 high-yield performance. In just 6 months, I have achieved a 10% annual income growth rate exceeding my yearly goal of 8%.
- Portfolio yield was sitting at 12% for months providing excellent entry points, but then June arrived, and investors started to bid up market price.
- This article emphasizes the importance of a disciplined trading plan and the use of technical analysis in making investment decisions.
- Stock prices are often influenced by factors like investor psychology and market manipulation, which can lead to misperceptions about a company's true value. Taking advantage of dislocations in price to improve performance.
Introduction
We completed the first 6 months of 2023 and I wanted to report on both performance and income purchases. Most purchases were facilitated during March 2023 caused by three bank failures triggering a market decline. Chart-1 demonstrates the significant income growth increase between February to March during that event.
In addition, I will give an example of a recent purchase where a stock price declined based on a downgrade. The goal of this analysis is to demonstrate how I find good entry points to reduce costs and increase cash flow. Analyzing price is a topic that is rarely explained because it is based on the investor's emotional response to unexpected events.
Technical analysis gives a window into price behavior anyone can take advantage of when they realize it does exist. The method I use makes purchasing low-cost income shares very easy. I use automated mathematical calculations in real-time when the market is open, and I get notified of any possible trades.
I only invest in RIC (Regulated Investment Company) stocks that invest in various securities and distribute most of their income to shareholders. A RIC can avoid paying corporate income tax if it meets certain requirements, such as distributing at least 90% of its taxable income to its shareholders annually. This method provides a tax-free investment method to increase income growth in a tax-sheltered account.
Price is the illusion of confusion
I want to talk about how I view the stock market as it relates to price. Price is what you pay for a commodity at a particular point in time. Once you have decided on an investment it becomes time to focus on your entry price. There is nothing wrong with initiating a starting position for a stock of interest to see how it behaves. When you feel more confident in the performance of the stock, the next step should be to lower the cost basis over time. This is where technical analysis comes into play. I focus on how to add income shares at reduced cost and generate additional dividend income in the process.
Let's step back for a moment and consider the cost of things you purchase in your normal life. If there is an item you use all the time, do you get excited when the price is reduced? Perhaps people are buying less of the item today and the company just wants to move its inventory. Most of us will purchase more at reduced cost knowing eventually the price will move back up once the inventory is reduced.
The price of a stock responds the same way, when people begin to reduce their exposure to an investment the price will decline. When good news comes along, they suddenly buy more, and the price moves up. This happens all the time in the market.
The challenge becomes how do I know when to buy stocks at reduced cost over time? This has been a challenge over the years, and I have solved this mystery through an application I call the TEA/POT strategy explained in my profile .
Cash-Flow Performance
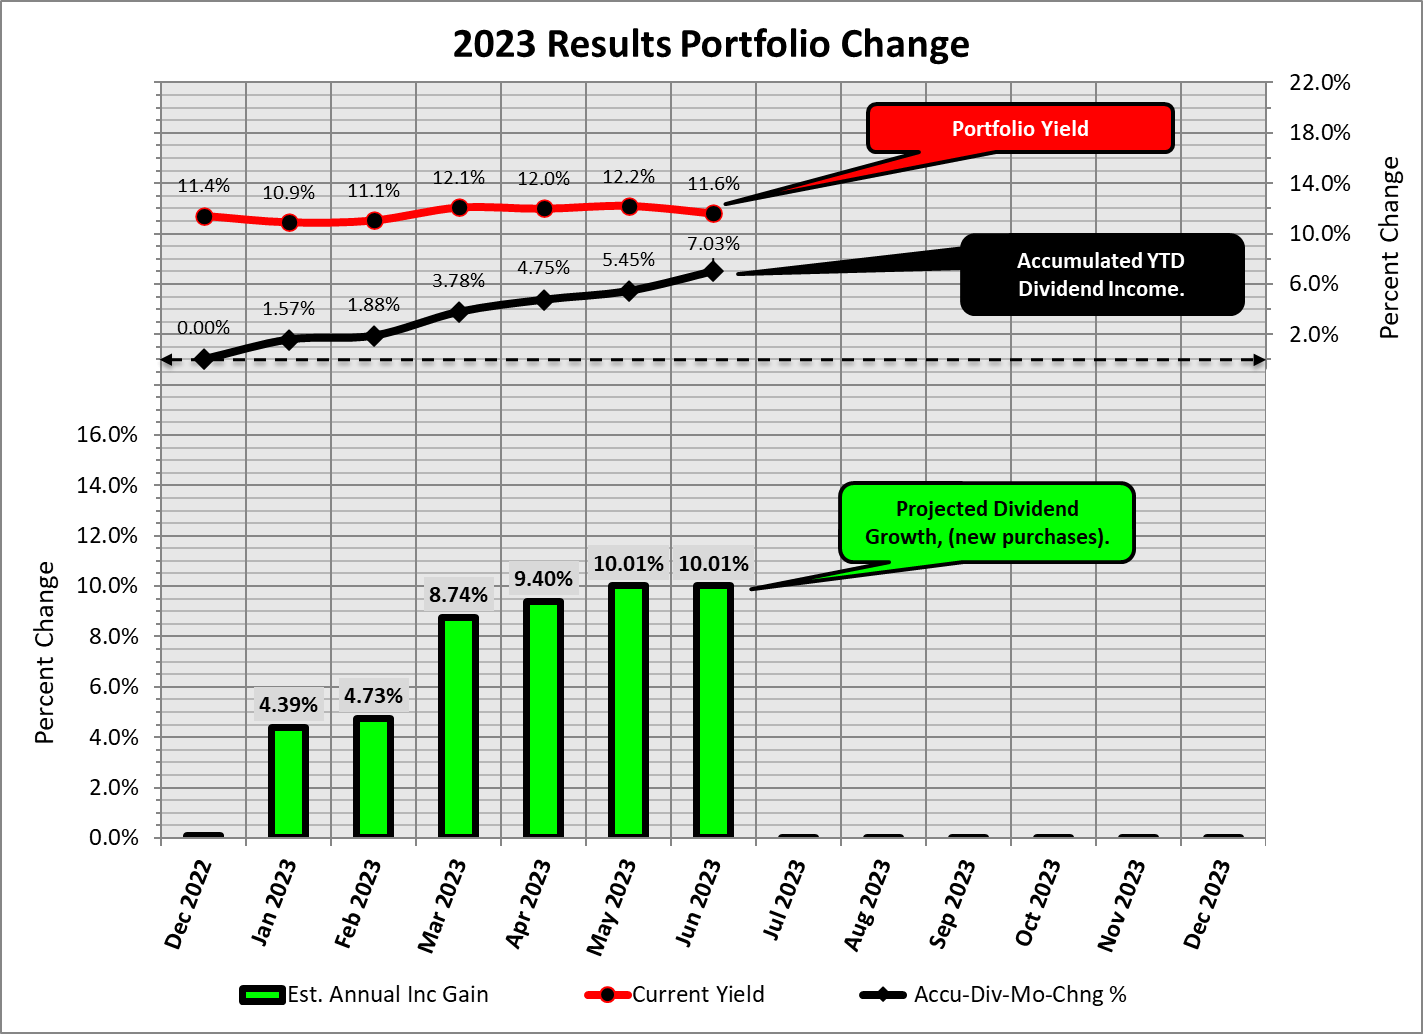
The following chart displays each month's income performance, portfolio yield, accumulated dividends and projected dividend growth brought about by increasing shares and dividend changes.
Chart-1; Portfolio YTD cash flow
Looking at January 2023, (top red yield line) in the chart above, investors were buying into many of the stocks I currently own. The yield at the end of January was 10.9%, the lowest value YTD. When the market declined in March, the yield stayed at the 12% level and provided an excellent time to accumulate shares.
The black line is just the accumulation of monthly dividends. This will continue to move upward as the year progresses.
The bottom green bars reflect the projected dividend income growth after purchasing shares and any dividend changes during the first half of the year. The last few days in December provided a great opportunity to purchase shares and increase income growth by more than 4%. This was a tax selling event to offset investors' capital gains and fund managers window dressing.
The March green bar also moved higher during the banking turmoil where the market took a temporary hit. Massive purchasing took place that bumped up my total income growth by over 8%. This is how I make purchases, waiting for TEA/POT oversold signals, reducing cost, and increasing cash flow.
High-Yield Portfolio
The following three tables outline three stock groups contained in my high yield portfolio. The list of stocks is BDC (Business Development Company), mREIT (mortgage Real Estate Investment Trusts) and CEF (Closed-End Fund).
The three tables display current stock yield, capital allocation and yearly income. The last three columns identify dividend change, special dividends, and new purchases.
| Table-1: YTD 2023 |
| Type |
| Symbol |
| Yield |
| %CapAlloc |
| %IncAlloc |
| DivChg |
| Special |
| New Buys |
| BDC |
| ( ARCC ) |
| 10.2% |
| 9.5% |
| 8.3% |
| BDC |
| ( TSLX ) |
| 9.8% |
| 8.6% |
| 7.3% |
| 2.2% |
| yes |
| BDC |
| ( CSWC ) |
| 10.9% |
| 8.3% |
| 7.8% |
| 3.8% |
| yes |
| BDC |
| ( HTGC ) |
| 10.5% |
| 8.4% |
| 7.6% |
| 8.3% |
| yes |
| BDC |
| ( GBDC ) |
| 9.8% |
| 6.2% |
| 5.2% |
| BDC |
| ( TPVG ) |
| 13.6% |
| 6.2% |
| 7.3% |
| 8.1% |
| May |
| BDC |
| ( GSBD ) |
| 13.0% |
| 4.8% |
| 5.3% |
| March |
| BDC |
| ( OCSL ) |
| 11.3% |
| 1.9% |
| 1.9% |
| 1.9% |
| BDC |
| ( BBDC ) |
| 12.7% |
| 0.4% |
| 0.5% |
| 4.2% |
| March |
| 54.4% |
| 51.1% |
| Table-2: YTD 2023 |
| Type |
| Symbol |
| Yield |
| %CapAlloc |
| %IncAlloc |
| DivChg |
| Special |
| New Buys |
| mREIT |
| ( STWD ) |
| 10.0% |
| 7.5% |
| 6.4% |
| mREIT |
| ( BXMT ) |
| 12.1% |
| 4.7% |
| 4.9% |
| mREIT |
| ( RITM ) |
| 10.4% |
| 2.6% |
| 2.4% |
| March |
| mREIT |
| ( ABR ) |
| 11.5% |
| 2.0% |
| 2.0% |
| 5.0% |
| March |
| mREIT |
| ( ACRE ) |
| 13.0% |
| 1.2% |
| 1.3% |
| yes |
| 18.0% |
| 16.9% |
| Table-3: YTD 2023 |
| Type |
| Symbol |
| Yield |
| %CapAlloc |
| %IncAlloc |
| DivChg |
| Special |
| New Buys |
| CEF |
| ( PDI ) |
| 14.1% |
| 6.1% |
| 7.4% |
| CEF |
| ( ECC ) |
| 16.6% |
| 5.8% |
| 8.3% |
| yes |
| CEF |
| ( GOF ) |
| 13.8% |
| 5.7% |
| 6.8% |
| CEF |
| ( WDI ) |
| 11.6% |
| 3.7% |
| 3.7% |
| 1.6% |
| March |
| CEF |
| ( PTY ) |
| 10.4% |
| 3.5% |
| 3.1% |
| March |
| CEF |
| ( ARDC ) |
| 11.0% |
| 2.8% |
| 2.7% |
| 9.8% |
| March |
| 27.6% |
| 31.9% |
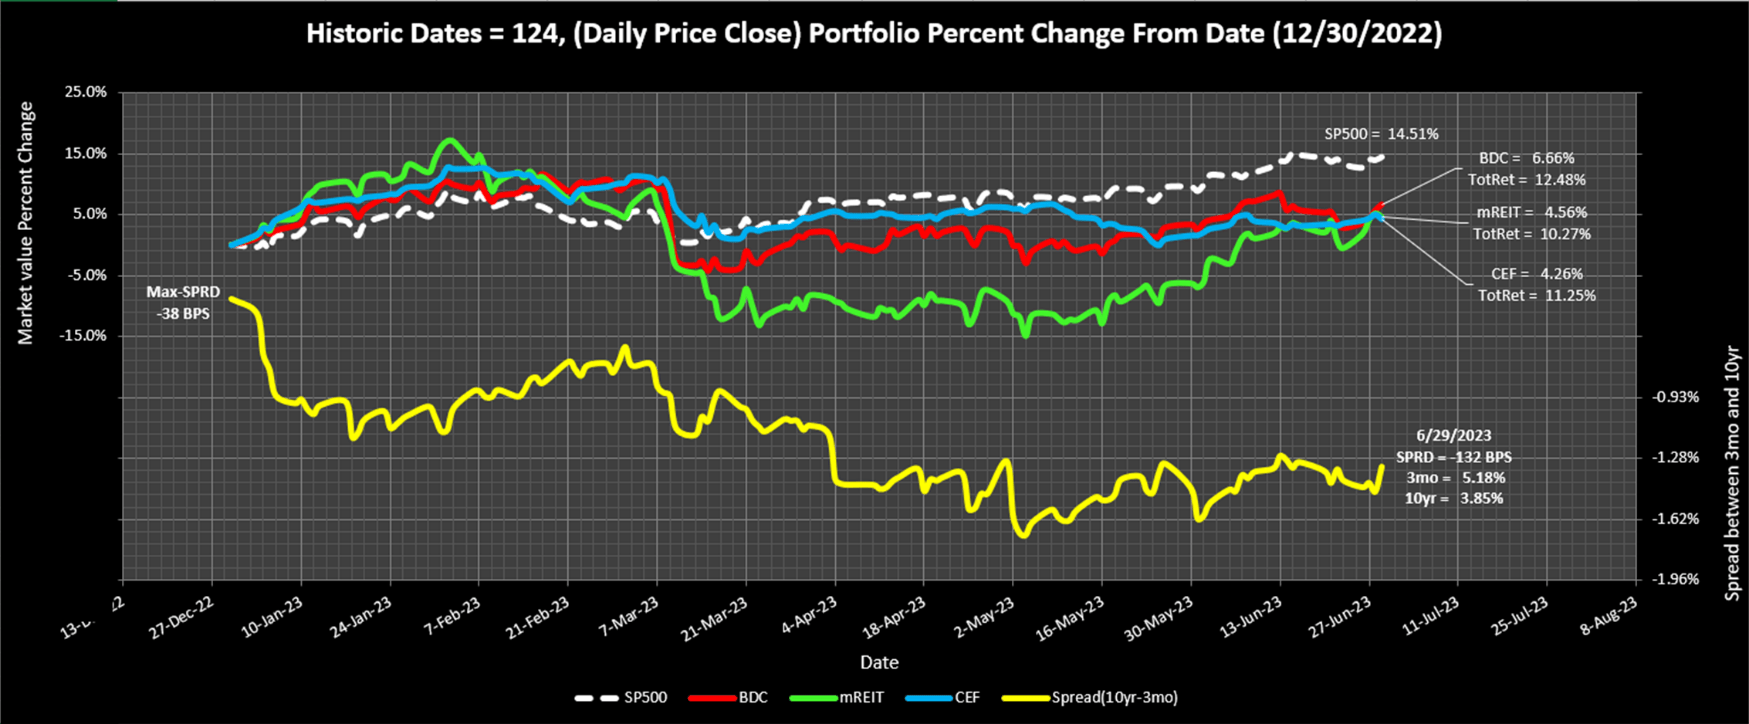
Chart-2; Performance between 3 stock groups
This chart shows the relationship between each of the three stock groups along with the S&P 500. The total return percentage under each group name represents the dividends added to price.
As of this writing, total returns are displayed below.
- mREIT green line, with a price gain of 10.27%.
- CEF blue line, with a price gain of 11.25%.
- BDC red line, with a price gain of 12.48%.
It must be noted stock prices are always in motion, one year down the next up. Tangible dividends are more stable and are considered the cornerstone of my high yield strategy. On a personal note, I do not pay much attention to total return as a meaningful metric, price is always in flux and distorts performance.
One of the interesting items on this chart is the yellow line showing the spread between the 3-month and 10-year Treasury interest rates. The short-term rate has been higher than the 10-year since the beginning of the year. This typically indicates a recession might be coming later this year or next.
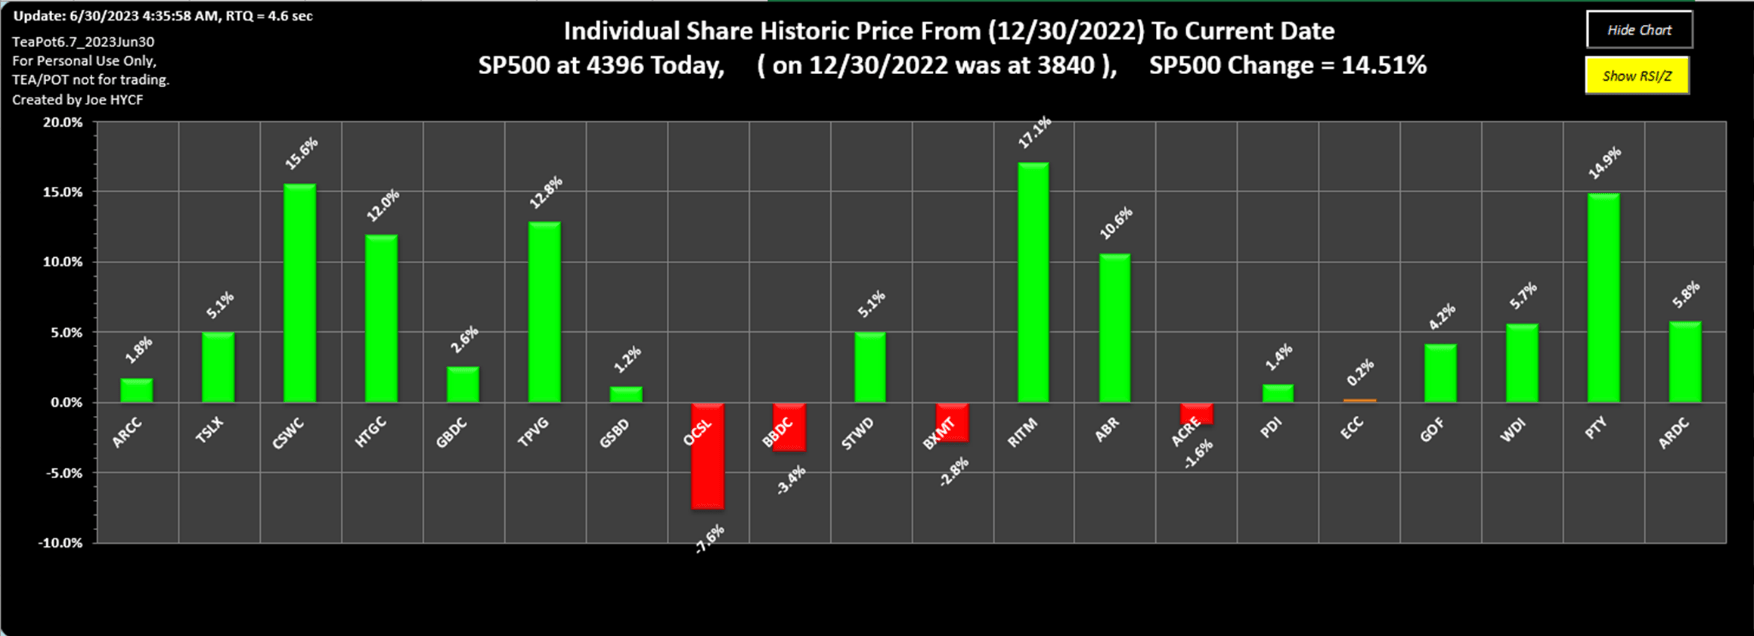
Chart-3; First 6 months YTD price change
The first 6 months of 2023 provided an example of what to expect from a previous declining year. Many of the stocks in my portfolio have positive price gains. This is typical and over the last 10 years my retirement portfolio has always provided a positive year following a declining year. There are no certainties this will continue for the rest of the year, but the buyers were back in June.
Recent purchase
I've been saying all along 50% of an investment strategy comes from fundamental analysis. The remaining 50% comes from technical analysis that requires a disciplined trading plan. As a high yield investor, my focus is increasing cash flow year after year. The price of an investment is no more than an illusion of confusion to manipulate investors emotional responses.
To that end, the following describes the metrics I follow in acquiring additional income producing shares. The Relative Strength Index ((RSI)) and the price Z-score are two indicators that help me determine trading price levels.
- The RSI is a momentum oscillator that measures the speed and magnitude of price changes. It ranges from 0 to 100, with values above 70 indicating overbought conditions and values below 30 indicating oversold conditions.
- The price Z-score is a statistical measure using a years' worth of price data. It provides the standard deviation of price from its mean. A positive Z-score means the price is above its mean, while a negative Z-score means the price is below its mean.
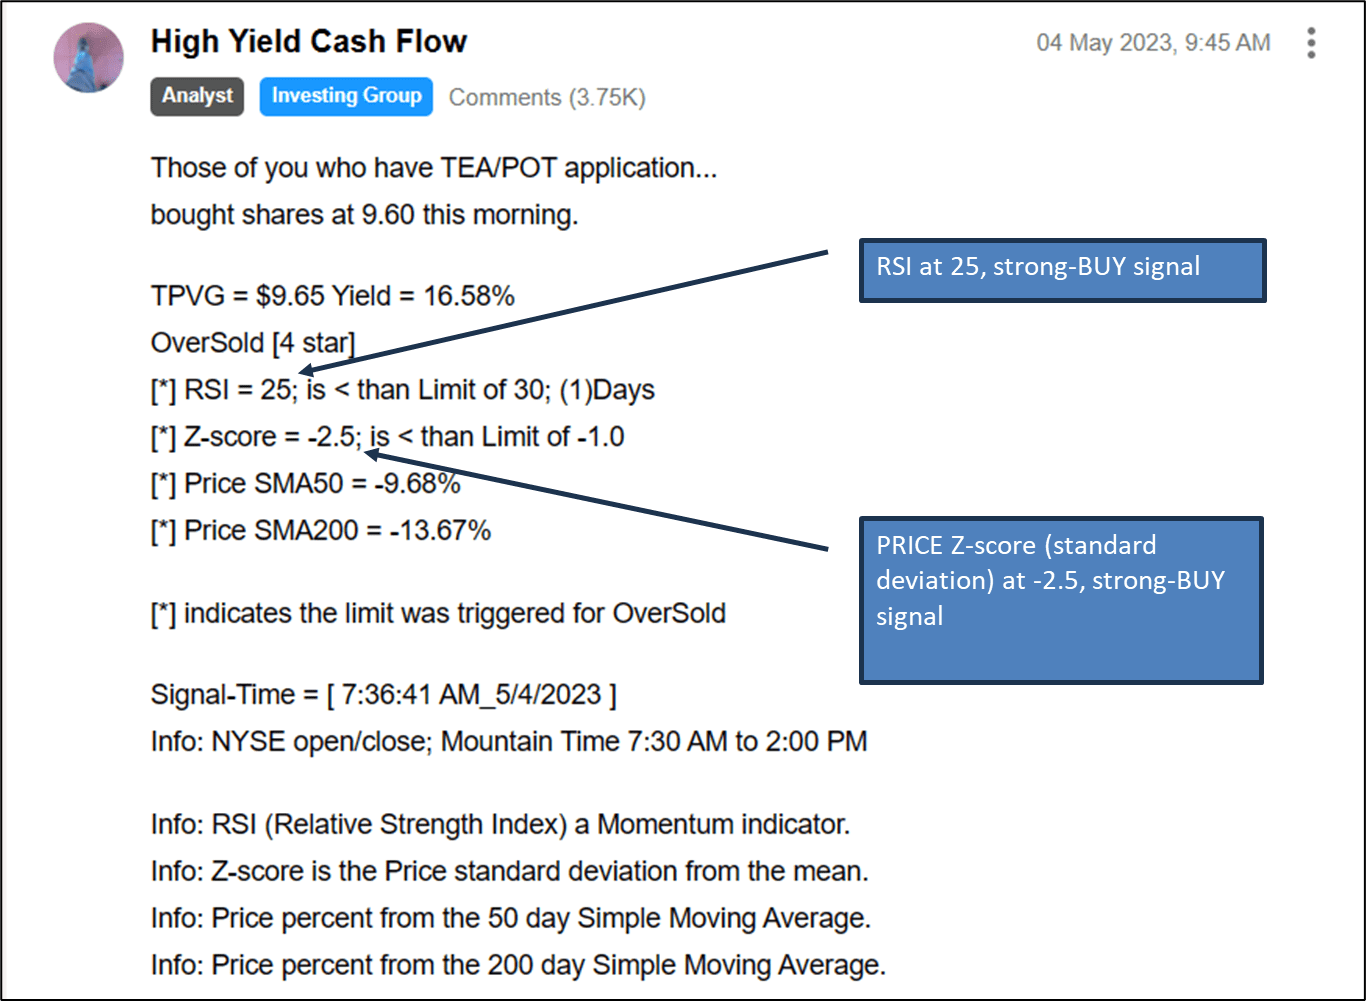
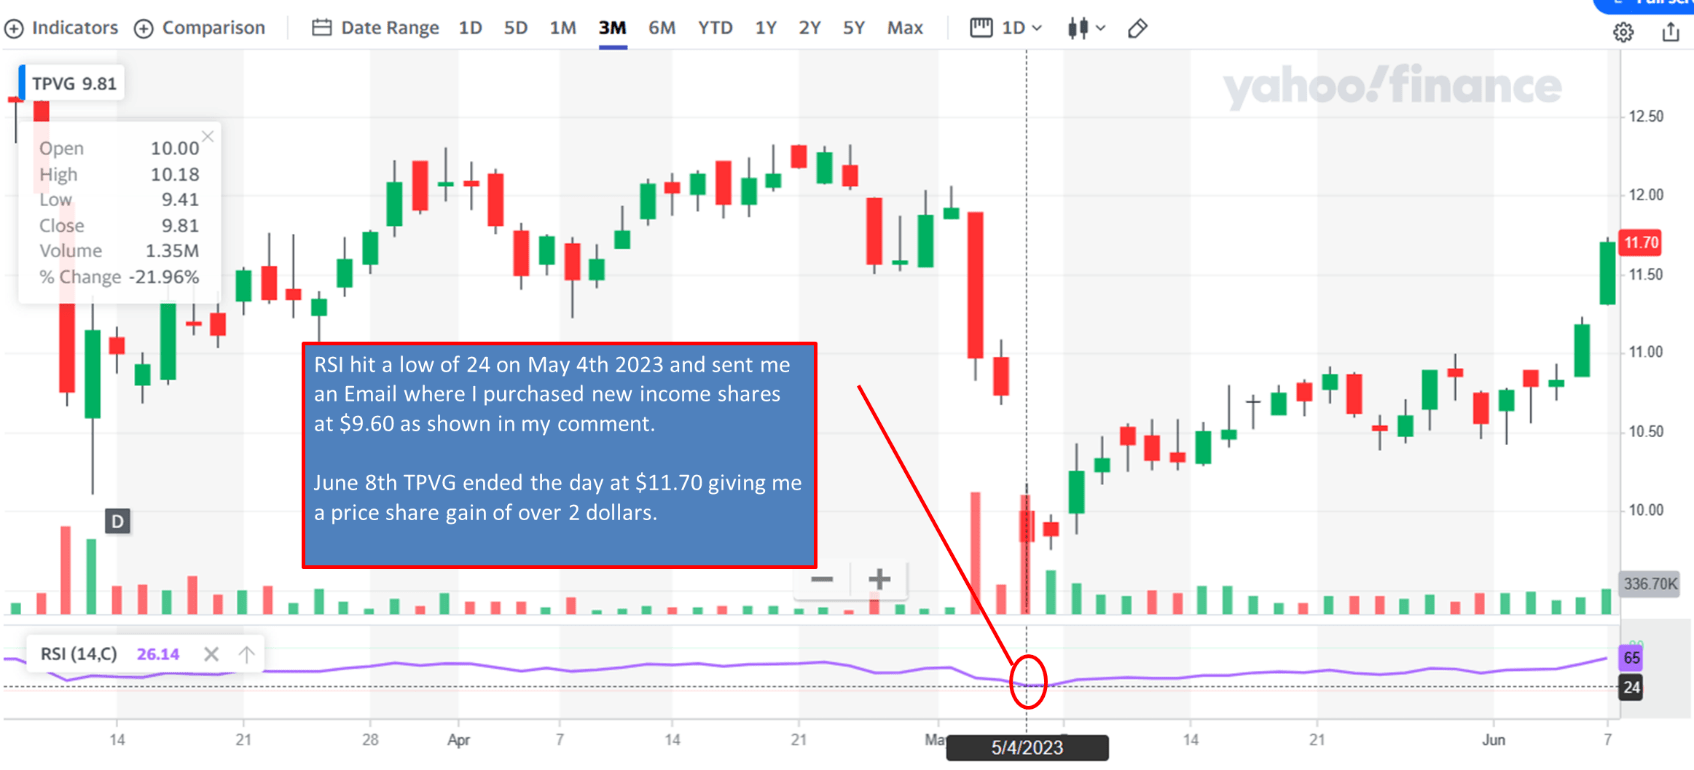
This is an example of a purchase made when I received a real-time Email for TriplePoint Venture Growth ( TPVG ). The comment below was submitted May 4th 2023 . The stock is currently about two dollars above my purchase price of $9.60. Having a method to determine oversold portfolio investments is key to reducing cost over time and increasing cash flow.
From the news event listed below, the TPVG stock took a massive hit where the RSI went to a value of 25, price Z-score (standard deviation) substantially declined, and price was well below both the 50-day and 200-day moving average. All 4 technical analysis values converged to indicate an extreme oversold condition. A simple decision was made to purchase additional shares.
The following chart confirms the price and RSI value being extremely oversold.
Chart-4; TPVG
There was news surrounding TPVG May 4th that caused investors to dump shares out of short-term fear. From the news report "TriplePoint Venture Growth (NYSE:TPVG) fell as much as 12.3% to a near three-year low on Thursday after the venture capital firm reported Q1 results, prompting Wells Fargo to downgrade the stock to Equal Weight from Overweight given portfolio headwinds."
It must be noted TPVG raised their dividend 8% March 15th to $0.40 a share. It seems to me the company is looking past any headwinds this year and looking forward to the future. My investment timeline is measured in years and not any short-term analysis.
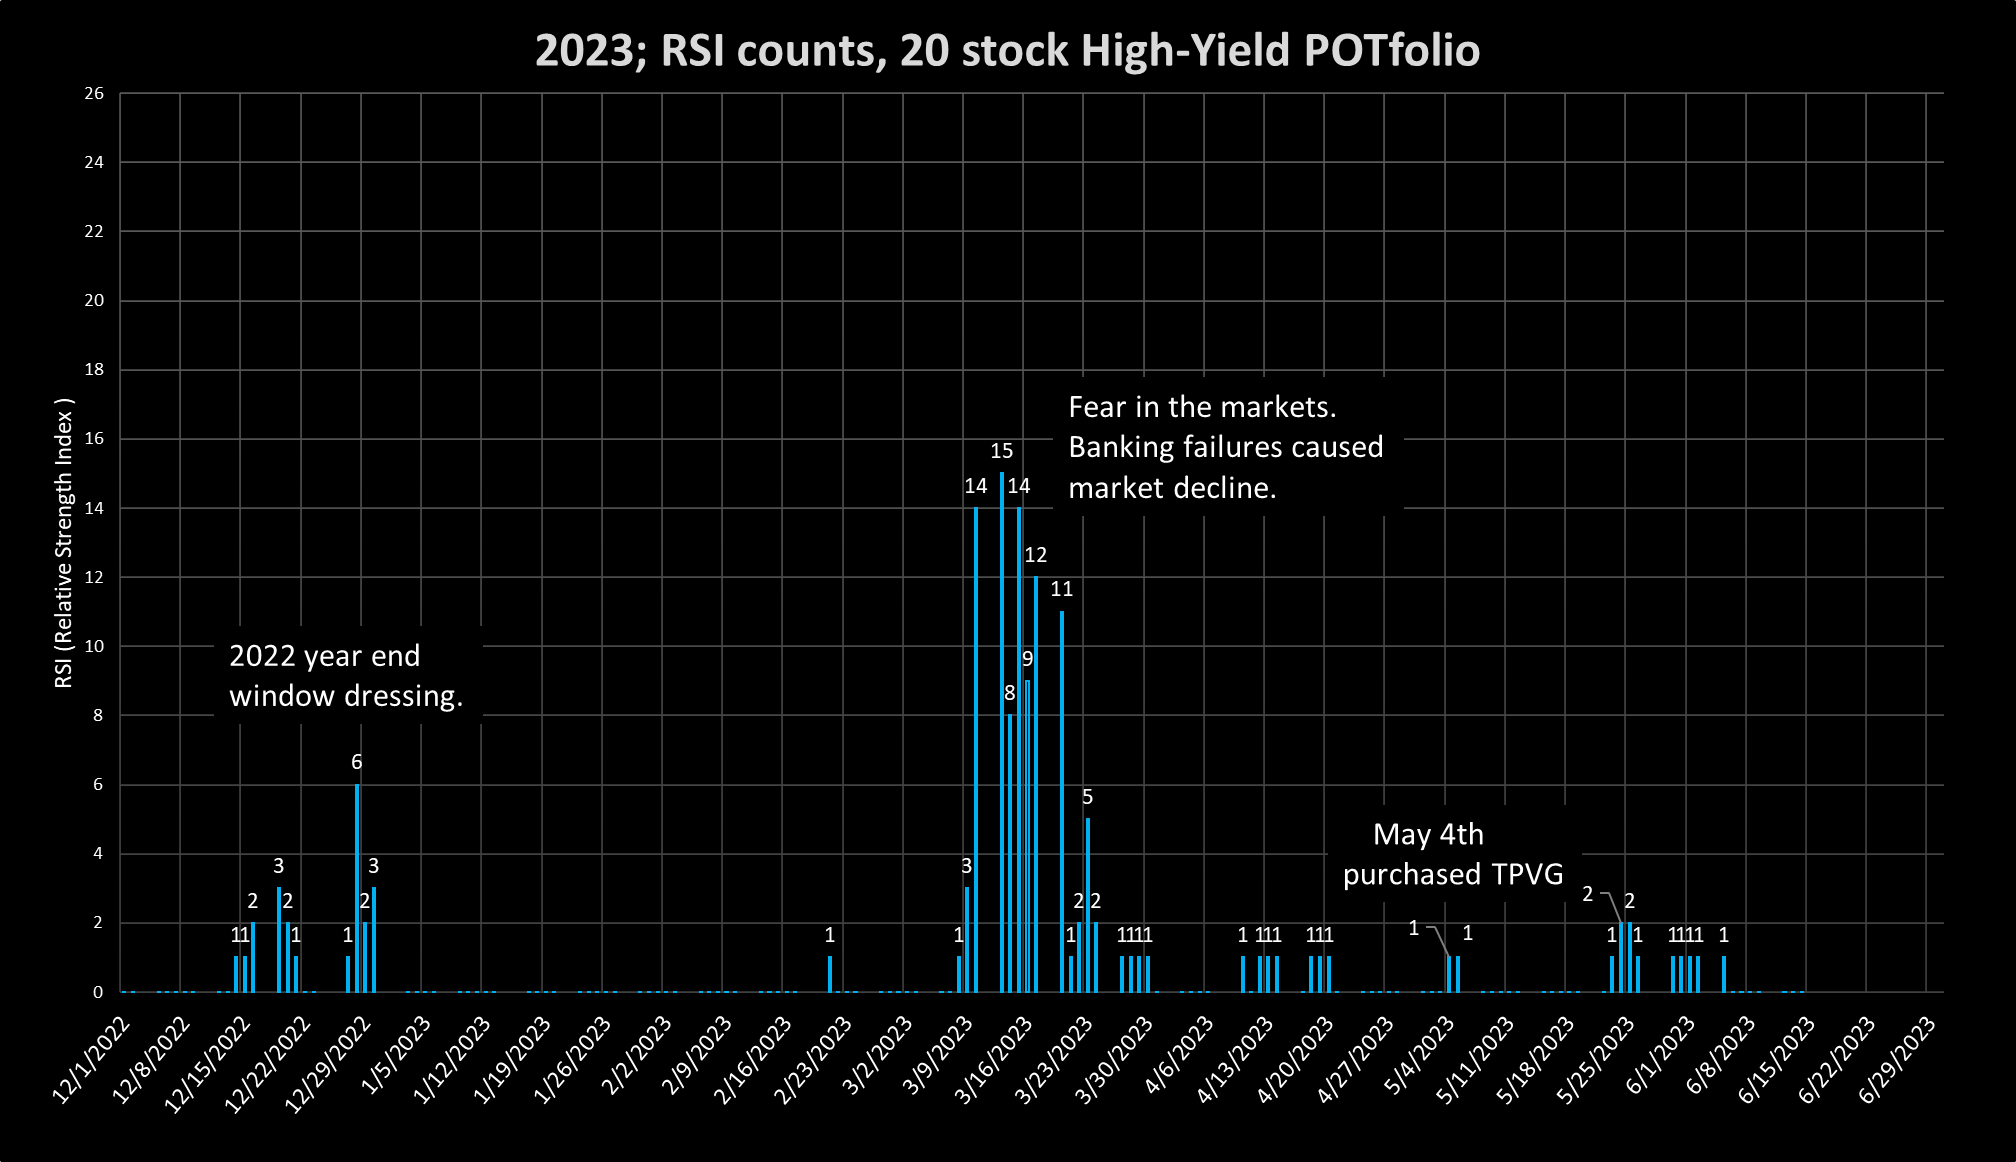
RSI observations
The RSI counts shown in the following chart indicate the severity of a market decline. Most of my purchases listed in Table-1 were in the March time frame. I receive portfolio analysis every day of such events that help navigate price anomalies.
Chart-5; Infrequent Trade Alerts
Chart-5 illustrates the infrequent market selloff events during the first half of the 2023 year. The numbers attached to each blue bar are the RSI values I received on my 20-stock portfolio.
What I noticed over time is the market becomes increasingly fearful just a few times each year where many stocks become oversold. The following quote describes these rare events.
"Opportunities come infrequently. When it rains gold, put out the bucket, not the thimble." Warren Buffett
I provide evidence of the rare events in the chart above. The rest of the time stocks stay in the neutral zone (RSI between 70 and 30) and no action is taken.
This is how I apply my purchase strategy during rare market events. Every day when the market is open, I receive a list of stocks in my portfolio providing real-time RSI and price Z-scores. I have the option to purchase new shares when I receive Email notifications of strong buy signals. Having a system to monitor real-time events creates the best option in picking up additional shares.
Conclusion
This article demonstrates the increased price gain YTD from the last trading day of 2022. There were two primary areas where I took advantage of oversold events. The last few days of 2022 and in March 2023. Starting in June, price gains have pushed the TEA/POT signals I use for purchasing shares back into the neutral zone. At this point I'll accumulate cash to get ready for Sept/Oct possible pullback or when an unexpected event causes a market decline. I'm a buy-low-hold investor. I typically concentrate on the buying side of an investment.
It is my belief as a high yield income investor, stock price is an illusion because at times it does not reflect the true value of a company. Stock prices are influenced by many factors, such as supply and demand, investor psychology, and market manipulation. This is why I focus on the dividend that represents the tangible side of an investment.
As presented in this article I have removed the emotional behavior concerning stock prices by implementing a trading plan that uses technical analysis. I have accomplished this by using indicators to buy stocks when they have both low RSI and low Z-score values indicating an oversold event.
For further details see:
12% Portfolio Yield And 10% Income Growth With Oversold Purchase Strategy