TWO - 16% Dividend Yield Slash Incoming
Summary
- Slash to 11% or 12% incoming.
- Shares already dipped some, though many investors don’t know about the cut yet.
- Looking at the financials, it was clear the dividend would get whacked this year.
- Some peers are also poised to cut for 2023.
- Disagree with my techniques for analysis? The board doesn't.
Get ready for charts, images, and tables because they are better than words. The ratings and outlooks we highlight here come after Scott Kennedy’s weekly updates in the REIT Forum. Your continued feedback is greatly appreciated, so please leave a comment with suggestions.
First topic today is Annaly Capital Management ( NLY ). There were a few factors to update subscribers on.
Annaly Capital Management Earnings
NLY reported Q4 results. Scott Kennedy provided a rapid response to the quarterly report for subscribers of The REIT Forum. I’ll share the first part of it here:
Hi subscribers. I was able to review NLY's Q4 2022 earnings results. NLY reported a BV as of 12/31/2022 of $20.79 per common share (4.2% increase) versus my prior projection of $20.70 per common share (3.8% increase). I consider this basically an exact match (less than a 0.5% variance) and was well within my $20.05 - $21.35 per common share range. I would point out the intra-quarter volatility, especially for the general mREIT model, during the fourth quarter of 2022. In my personal opinion, any quarterly BV variance within 3.0% this particular quarter should really be considered a pretty accurate estimate (slightly larger “cone” per se).
When reviewing NLY’s MBS/investment sub-portfolio, there really were no notable surprises that “sprung up”. Similar to a couple other fixed-rate agency mREIT peers that have already reported preliminary earnings/earnings for the fourth quarter of 2022, NLY basically let the company’s on-balance sheet fixed-rate agency MBS sub-portfolio “roll-off” while making some changes to the company’s net long “to-be-announced” (“TBA”) MBS positive by quarter end. As anticipated, when considering residential credit securitizations, NLY continued to gradually increase the company’s non-agency MBS/residential whole loan/securitized sub-portfolios. NLY also continued to expand the company’s mortgage servicing rights (“MSR”) sub-portfolio (although it is still a fairly small portion of its total investment portfolio). All these strategies were generally correctly anticipated; hence no notable deviation in quarterly valuation fluctuations. NLY’s total on-balance sheet MBS/investment portfolio decreased (1%) during the fourth quarter of 2022 when based on fair market value (“FMV”) fluctuations. In comparison, knowing NLY performed a bulk equity offering in August 2022, I projected a total on-balance sheet MBS/investment portfolio increase of (2.5%) – 7.5% (mean increase of 2.5%). As such, a pretty accurate projection.
At the time, we considered NLY overvalued. That was because shares closed at $23.11 on 02/08/2023. The price resulted in a material premium to our book value estimate for 02/03/2022, which was $22.35. That was a premium of 3.4%.
Annaly Capital Management Dividend Cut
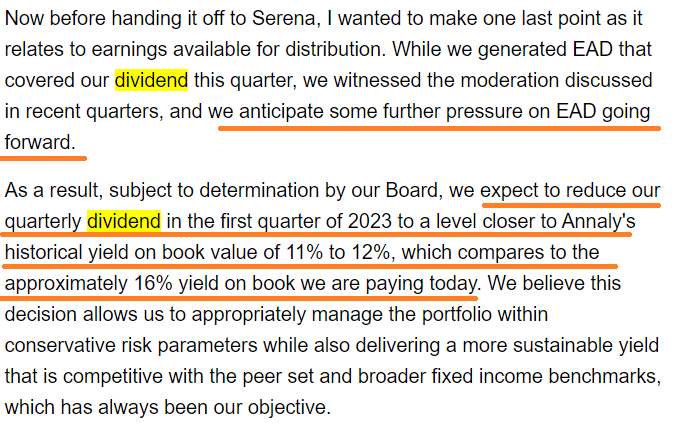
Annaly was actually trading slightly higher after the Q4 2022 results were announced. Then the earnings call changed the game. NLY telegraphed plans to reduce the dividend. Currently, the annualized trailing dividend rate of $3.52 (that’s $0.88 per quarter) represents a nearly 16% yield on book value. Per management, they want to reduce the dividend to around 11% to 12% of book value.
Here we have David Finkelstein (CEO and CIO) explaining the decision in Annaly’s Q4 2022 earnings call transcript :
Seeking Alpha
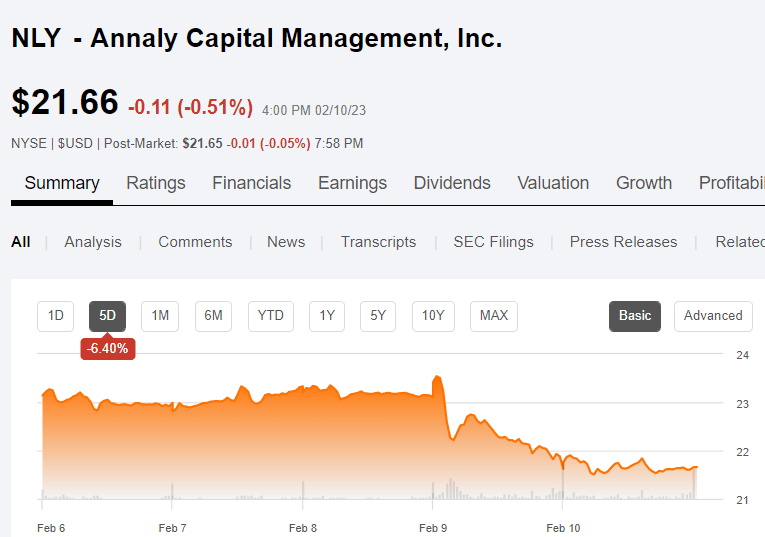
We’ve told investors before that book value is critical to the ability of any mortgage REIT to generate earnings. There are techniques to keep earnings looking strong, at least for a while, but eventually book value takes the wheel. The problem is that even with today’s wide spreads between current MBS yields and LIBOR or Treasury rates, it isn’t feasible to generate 16% on book value indefinitely . Going down to a ratio of 11% to 12% on book value is much more reasonable. However, management is foreshadowing a dividend cut of about 25% and that has a clear impact on the share price. Following the announcement, prices tanked:
Seeking Alpha
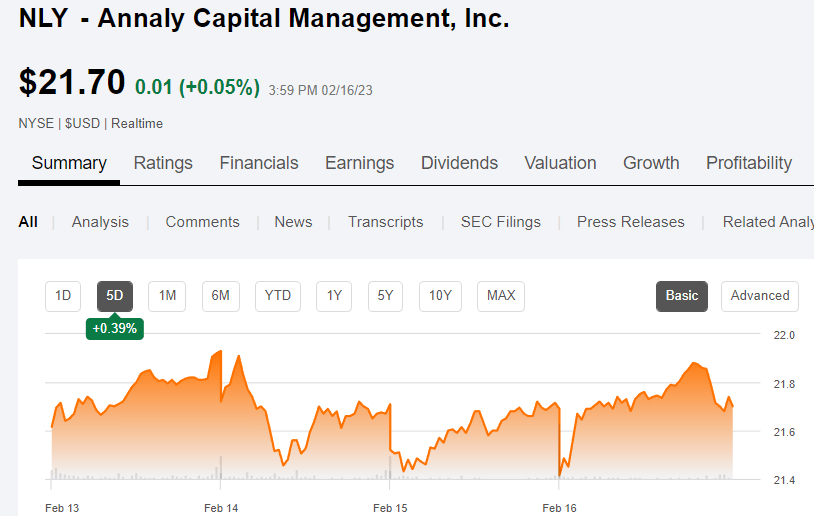
You can see the bump in the first bit of trading on 02/09/2023, followed by a sharp plunge. Since then, shares have been roughly flat.
Seeking Alpha
To be fair, this dividend cut came slightly sooner than expected. A cut in 2023 is not surprising at all. The cut coming in Q1 2023 may be a bit early.
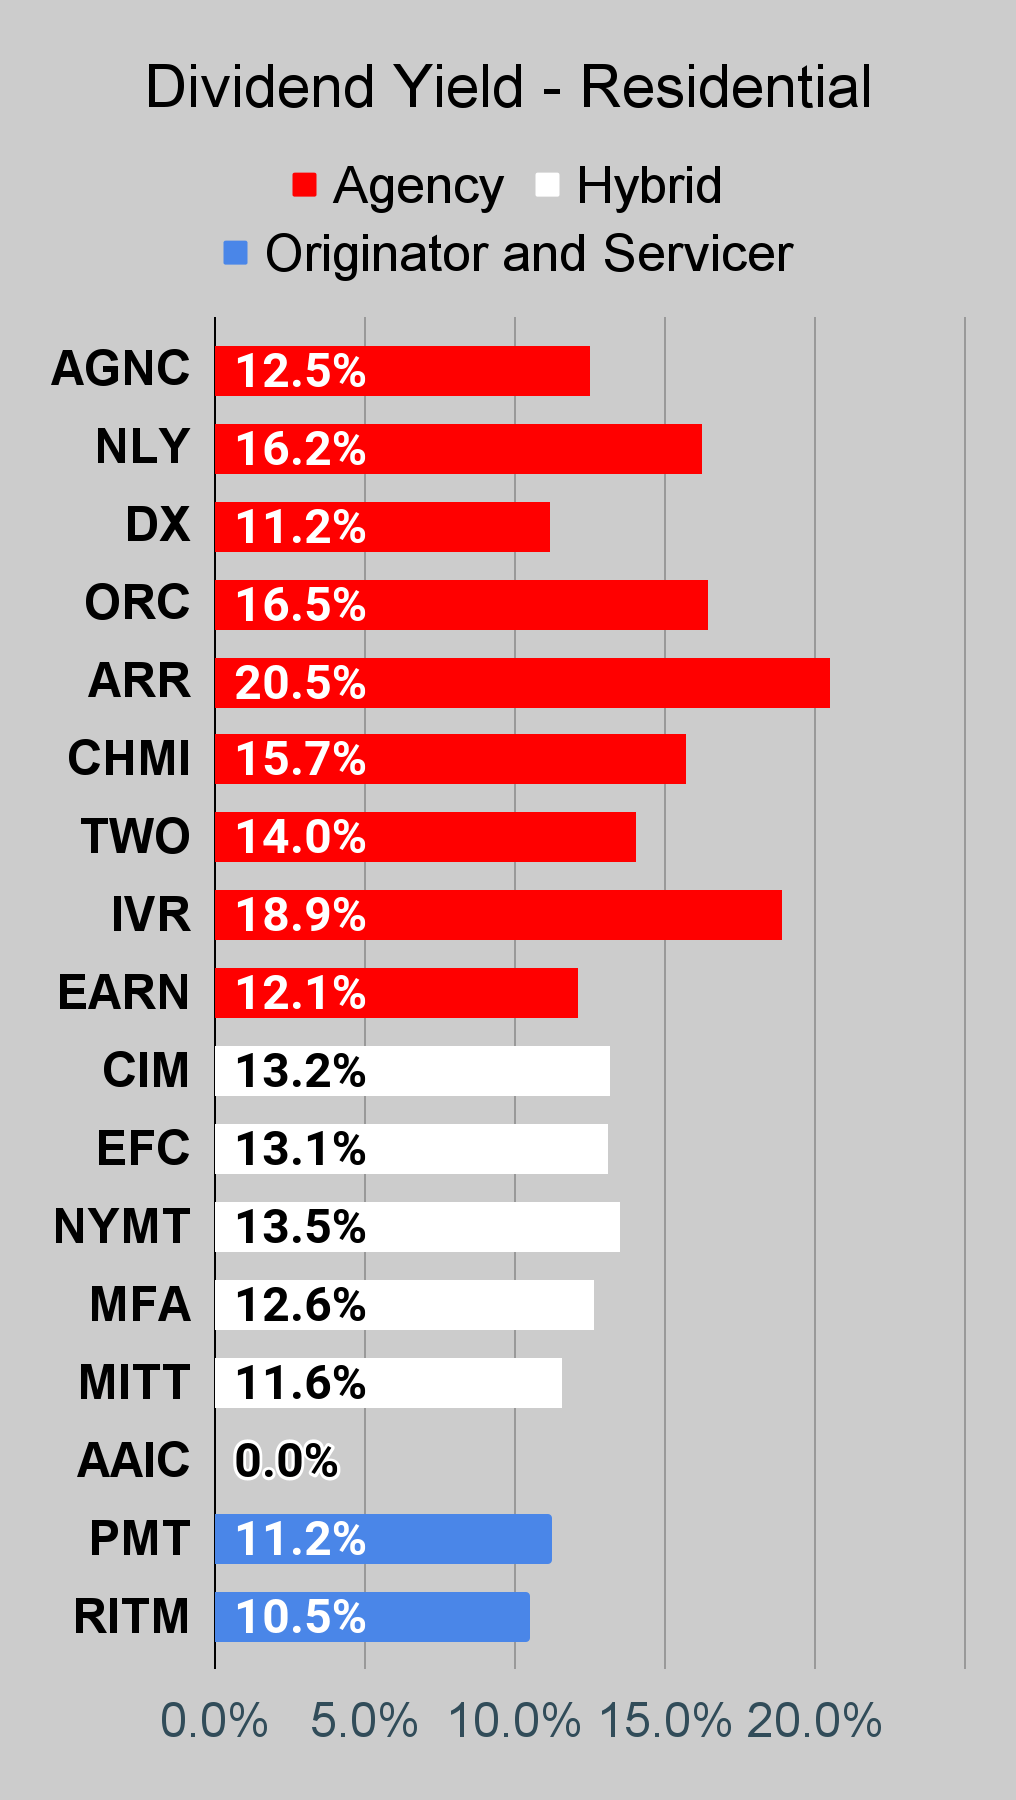
Dividend Yield on Book Value
One of the columns on our spreadsheet tracks dividend yield on net asset value (which is the same as book value for mortgage REITs).
It serves as a very early warning sign for pressure on the dividend. However, the actual timing of changes can be impacted for core EPS or EAD (earnings available for distribution) as NLY has been referring to the metric.
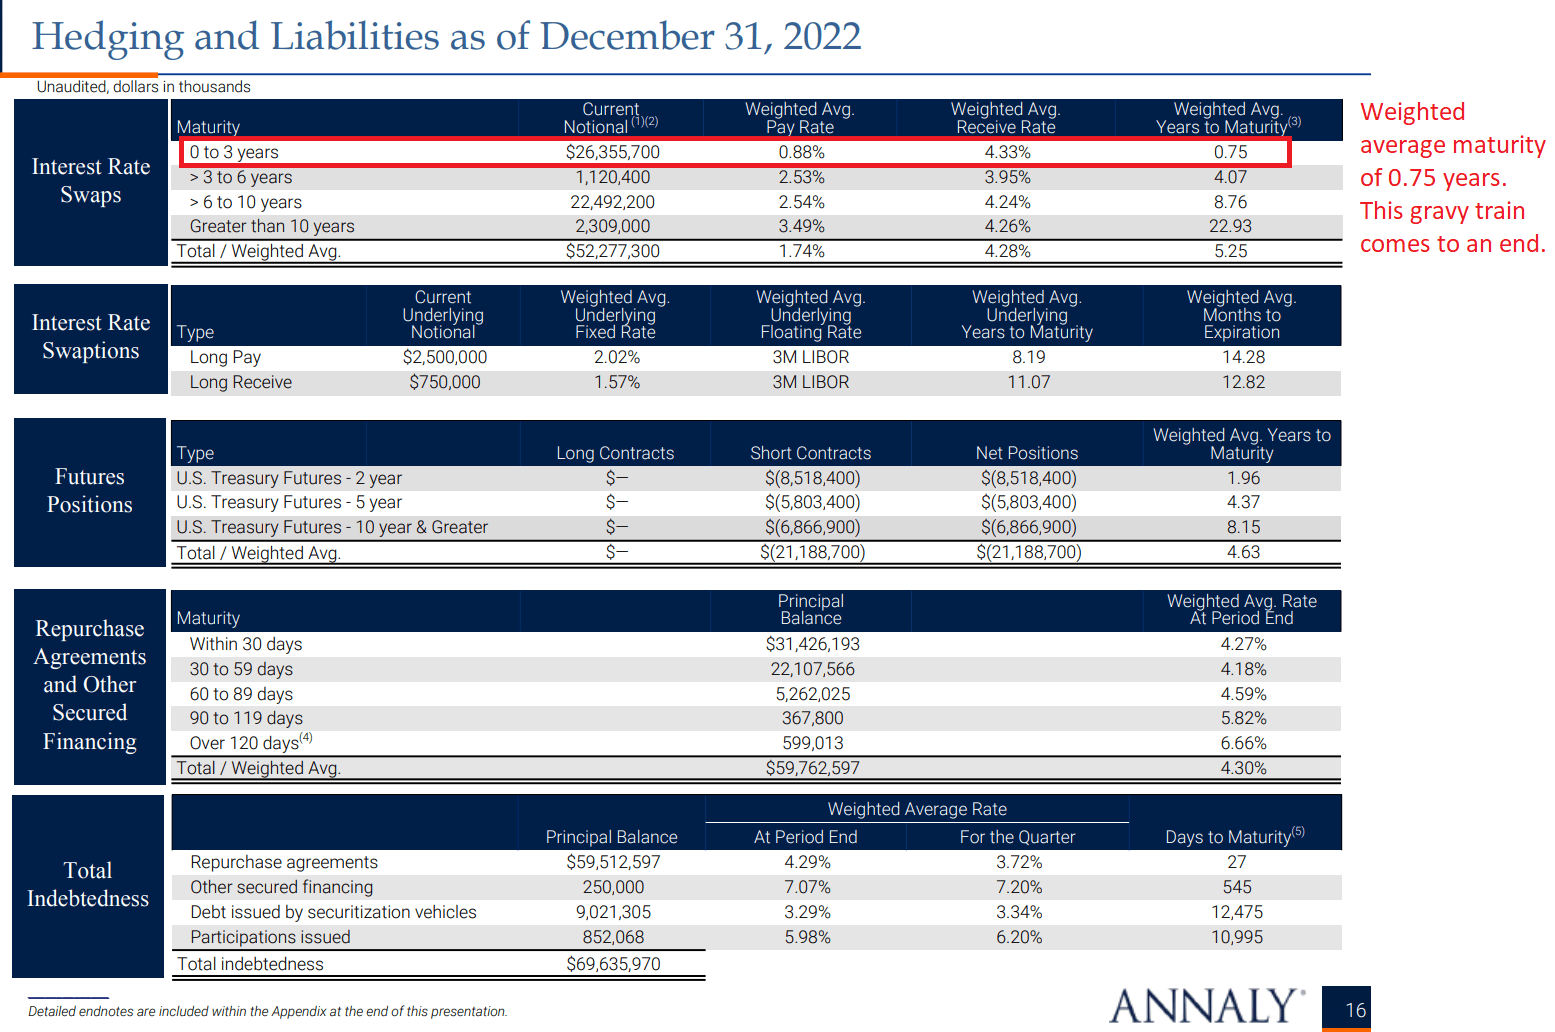
Why would the earnings be under pressure? Because a bunch of swaps are going to expire:
NLY
The thing about swaps is that they expire. That’s how they work. The bulk of these swaps are going to expire in 2023. That’s a problem for NLY’s earnings metric, because on an annualized basis those short-term swaps would’ve generated $909 million. Here’s the math:
The REIT Forum
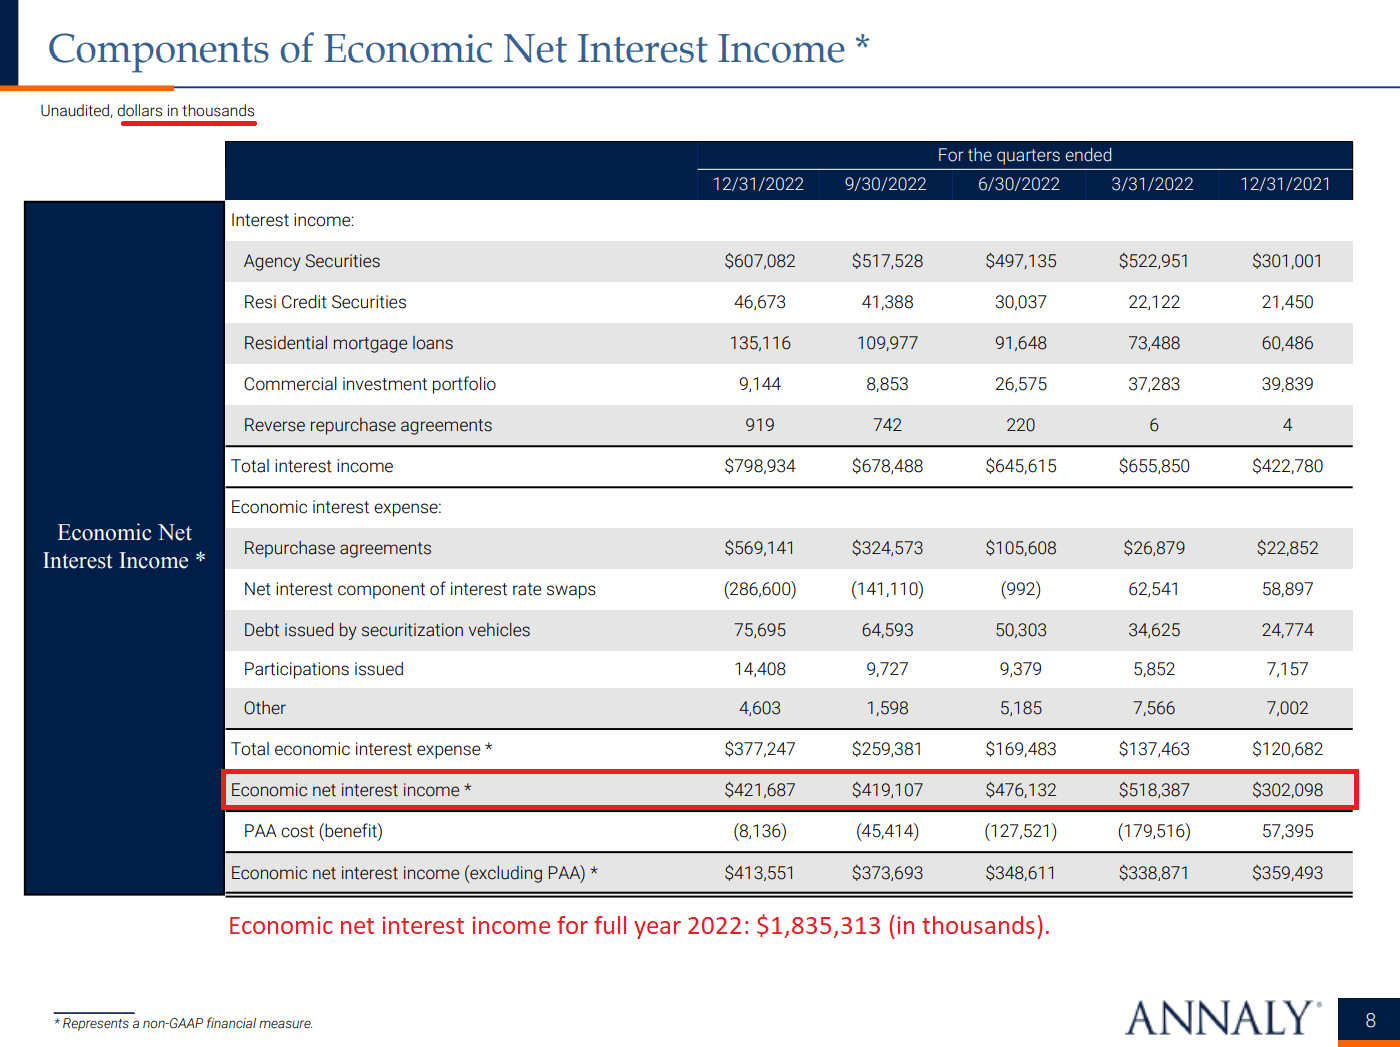
How much is $909 million per year to Annaly Capital Management? Well, we can look at the economic net interest income to get a feel for it:
NLY
When economic net interest income for the year is $1.835 billion, the savings from those swaps was huge. To be fair, during 2021 the annualized net interest income on the swaps wasn’t as high as it is today. The savings were lower before because the receive rate was materially lower for much of 2022. Why was the receive rate so much lower? Because short-term rates were so much lower. The receive rate on the swaps (4.33% at the end) was largely offsetting the cost of using repurchase agreements to fund the portfolio. As short-term rates went up, the receive rate increased and the rate paid on repurchase agreements went up. The goal of the swap, from an income perspective, was to lock in a large chunk of financing at 0.88%.
As those swaps expire, NLY should expect to face short term rates in the high 4% to low 5% range.
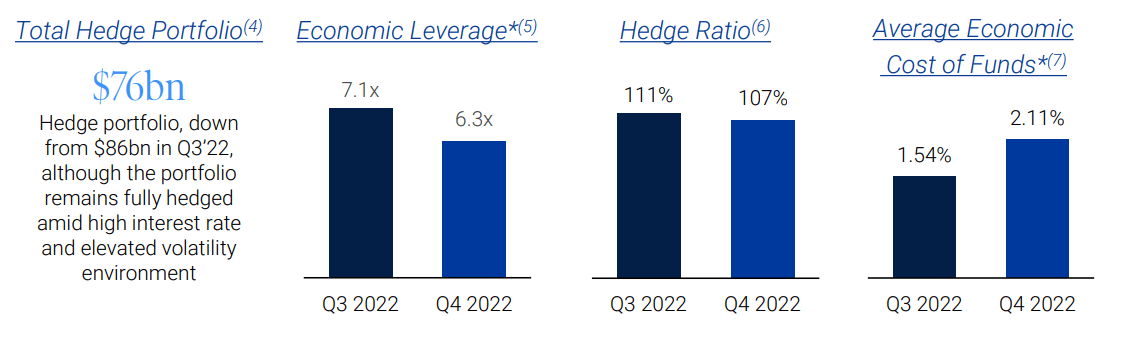
Therefore, the economic cost of funds goes up. That process is already happening:
NLY
NLY could enter new swaps, but the rate on the new swaps won’t be remotely close to 0.88%. Entering a new five-year LIBOR swap today would carry a fixed-pay rate of 4.03% to 4.14%. That’s materially different than 0.88%.
The Truth
This is the hard truth. Some investors may try to deny it, but this is how it goes. If NLY had more book value, they could generate additional earnings. They don’t. It was a matter of time until the hedges ran down.
ARMOUR Residential REIT
ARMOUR Residential REIT ( ARR ) has an annualized yield on book value of 19%. Who wants to predict that ARR will maintain that big dividend throughout the year? Not me.
Other Doubtful Dividends
Want a couple more that look particularly dangerous? Cherry Hill Mortgage ( CHMI ) is yielding about 16.7% on book value (more than NLY before the planned cut) and Invesco Mortgage Capital ( IVR ) is yielding about 17.9% on book value. That’s using our estimates for book value as of 02/10/2023.
Bashing on CHMI Again
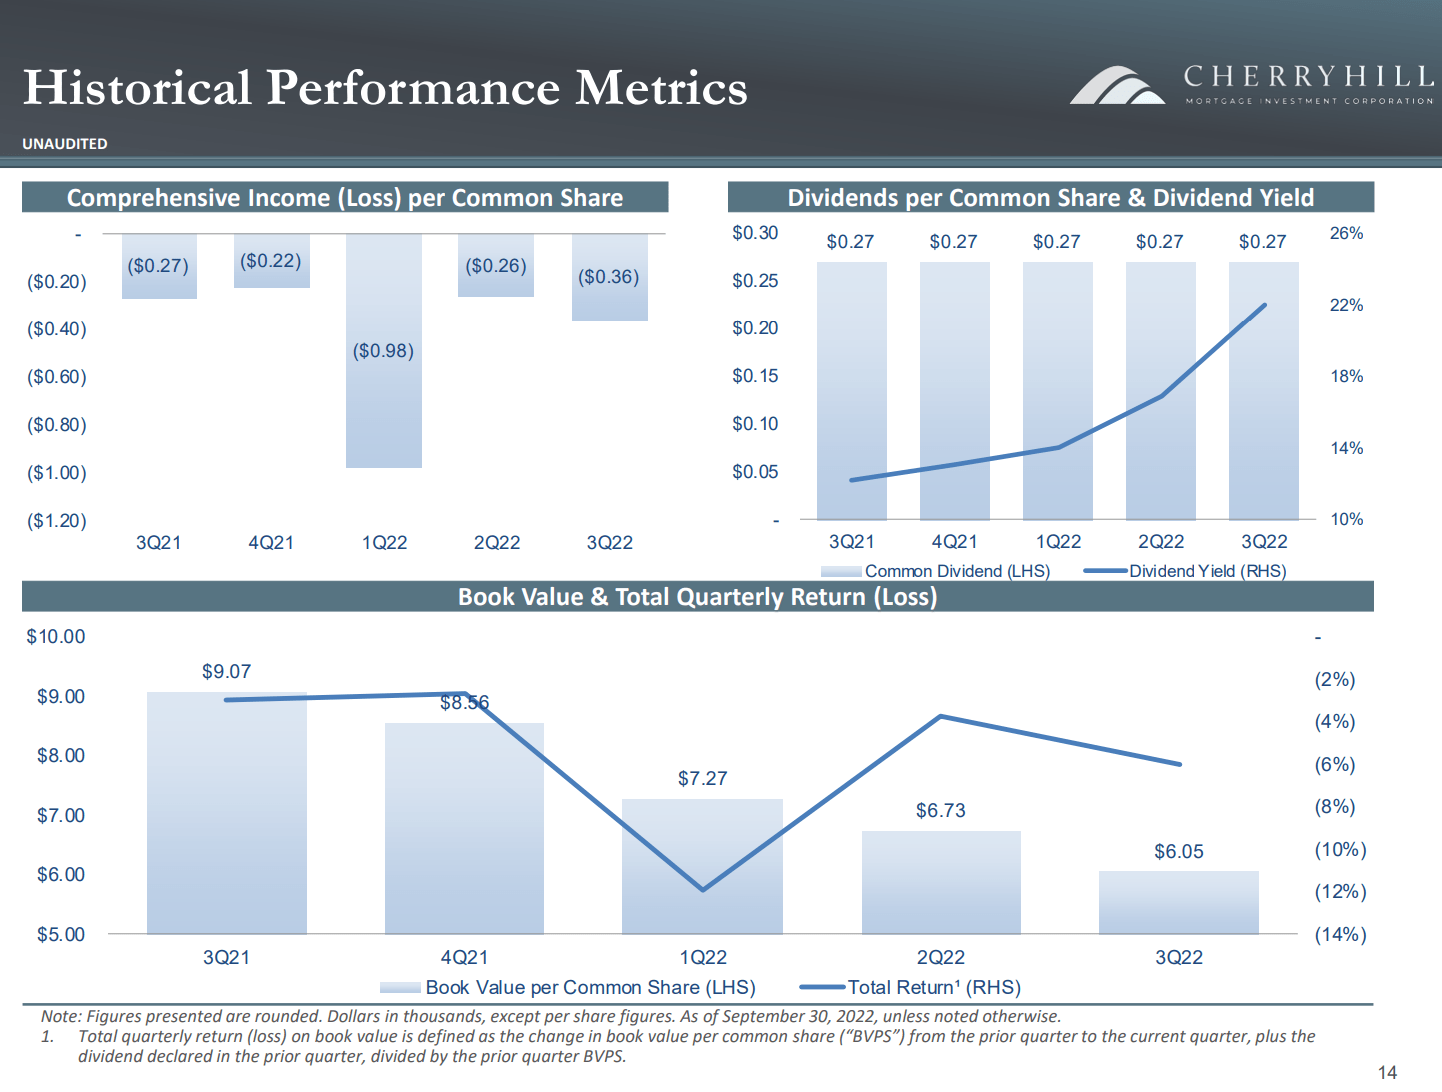
It’s been a couple days since we took a swing at CHMI. The price is down by $.12, which is a small fraction of the decline necessary to make shares attractive. It’s like Rithm Capital ( RITM ) if RITM didn’t have a good long-term record, didn’t have an origination business, and didn’t trade at a large discount to book value. What do investors get for giving up those three features? The ability to see a huge trailing dividend yield. Here are some important metrics, as presented in CHMI’s Q3 2022 presentation:
CHMI
Near 33% of book value trashed from Q3 2021 to Q3 2022? Cool and normal. But hey at least the dividend was maintained while producing comprehensive losses in every quarter. At least Q4 2022 was a far easier quarter for most mortgage REITs. Fingers crossed for a modest gain in BV to break the streak. We think this could actually be the quarter (Q4 2022) where CHMI reports a modest gain.
Stock Table
We will close out the rest of the article with the tables and charts we provide for readers to help them track the sector for both common shares and preferred shares.
We’re including a quick table for the common shares that will be shown in our tables:
| Type of REIT or BDC |
| Residential Agency |
| Residential Hybrid |
| Residential Originator and Servicer |
| Commercial |
| BDC |
Let the images begin!
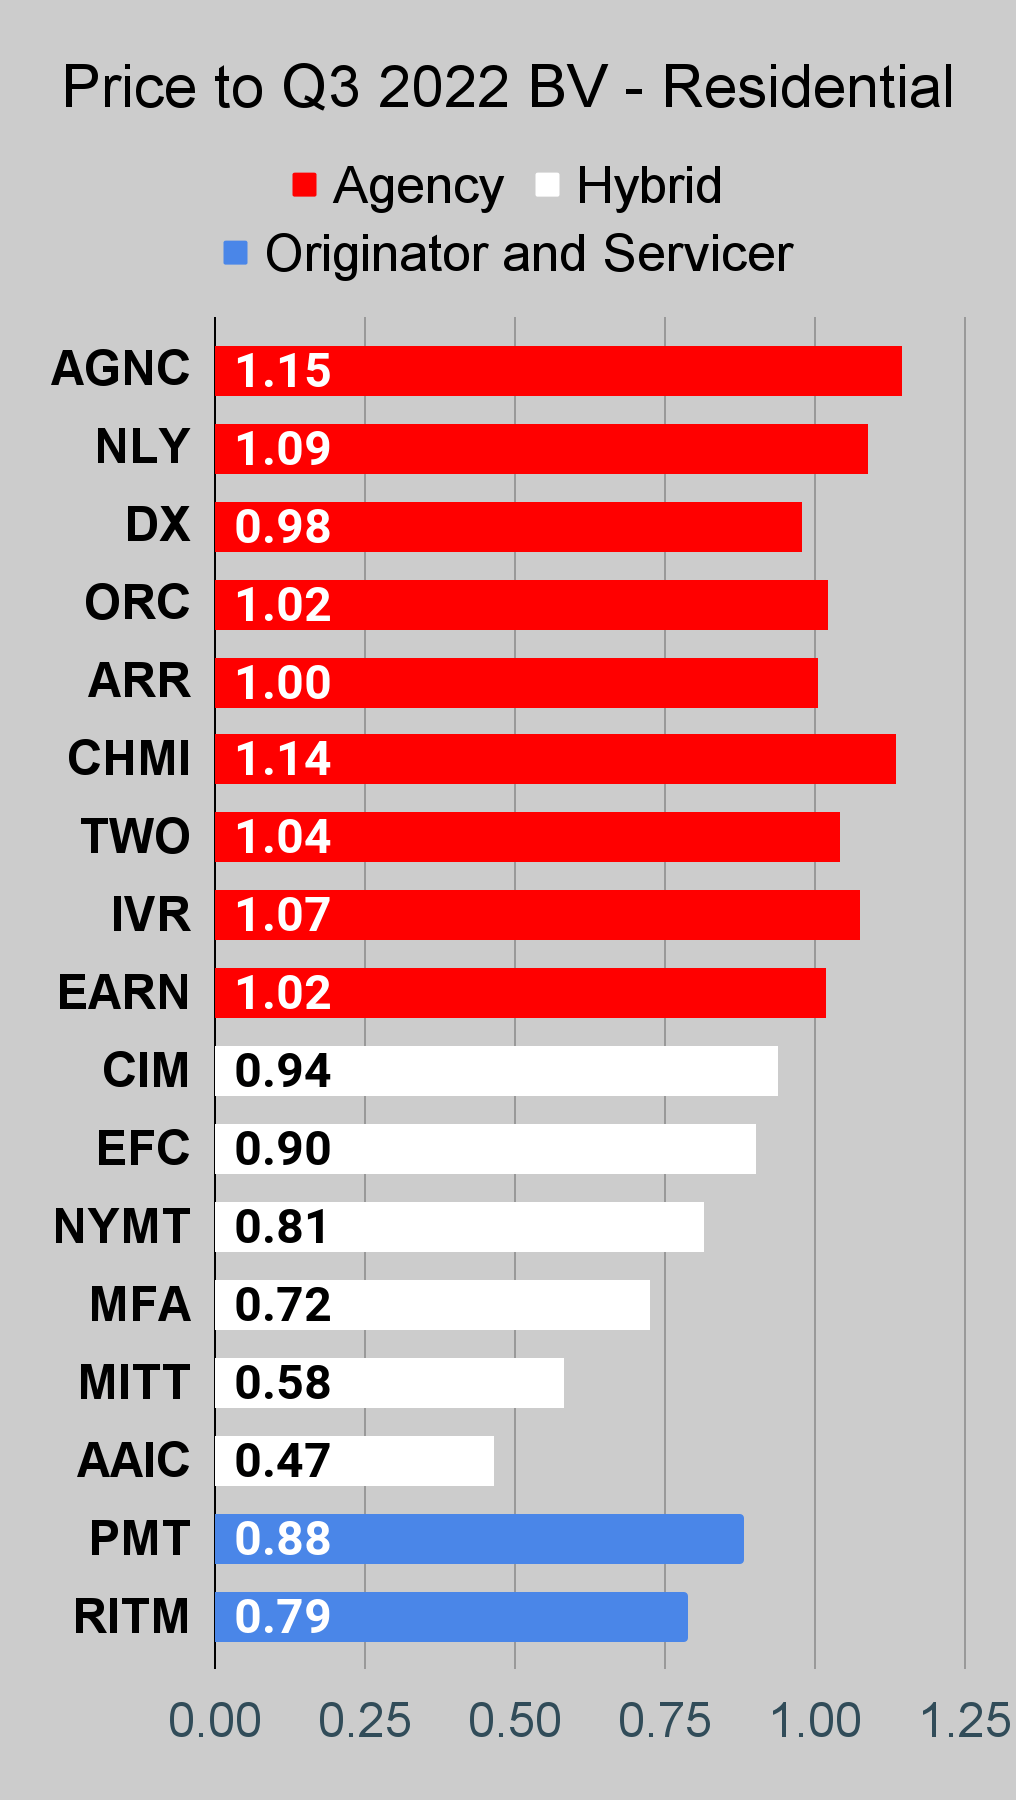
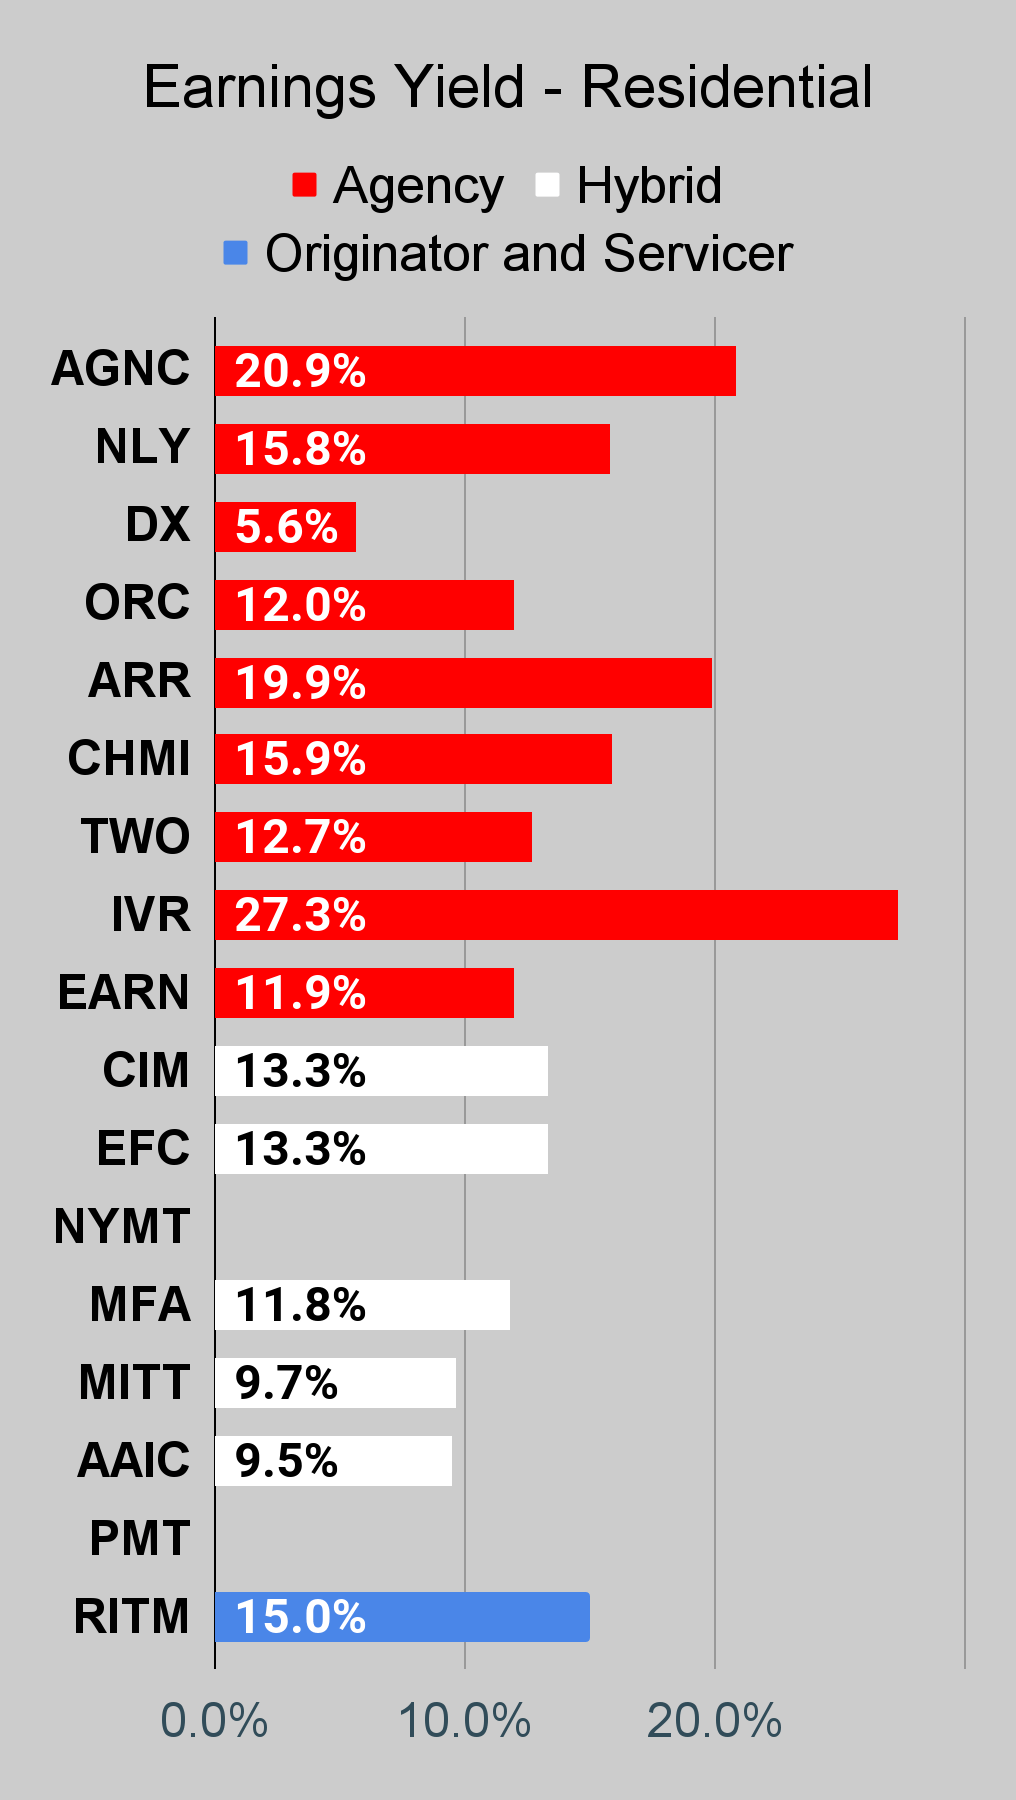
Residential Mortgage REIT Charts
Note: The chart for our public articles uses the book value per share from the latest earnings release. Current estimated book value per share is used in reaching our targets and trading decisions. It is available in our service, but those estimates are not included in the charts below. PMT and NYMT are not showing an earnings yield metric as neither REIT provides a quarterly “Core EPS” metric.
Second Note: Due to the way historical amortized cost and hedging is factored into the earnings metrics, it's possible for two mortgage REITs with similar portfolios to post materially different metrics for earnings. I would be very cautious about putting much emphasis on the consensus analyst estimate (which is used to determine the earnings yield). In particular, throughout late 2022 the earnings metric became less comparable for many REITs.
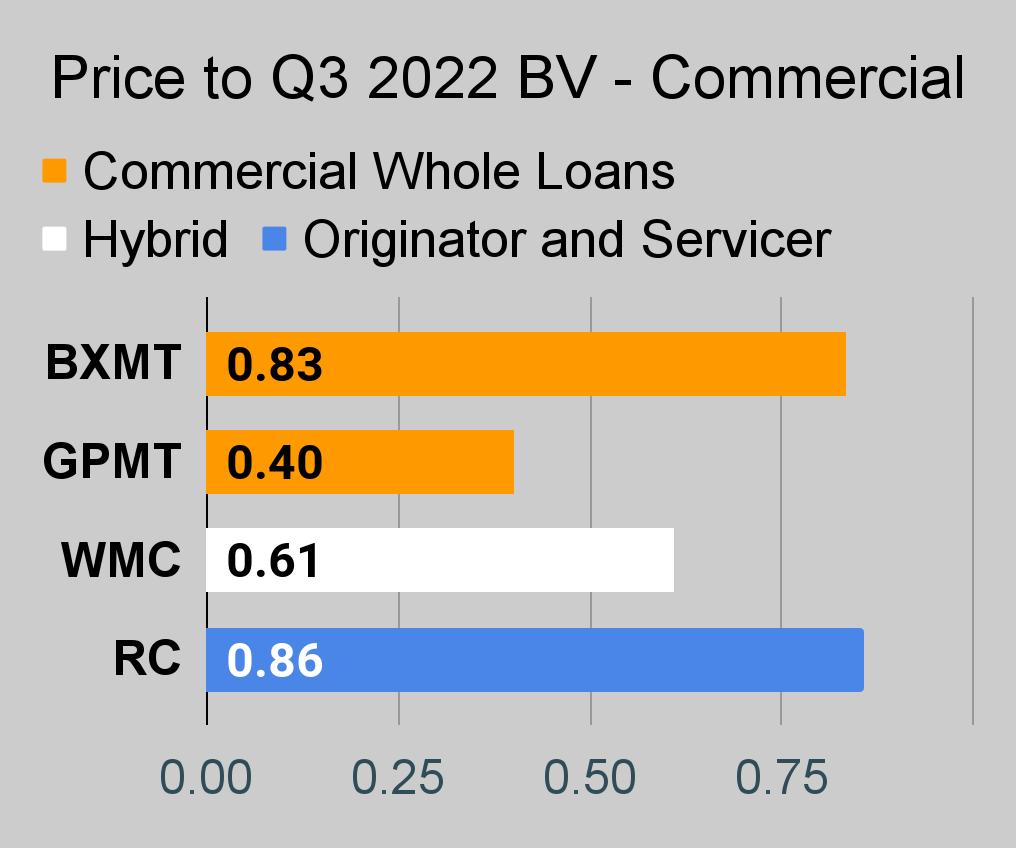
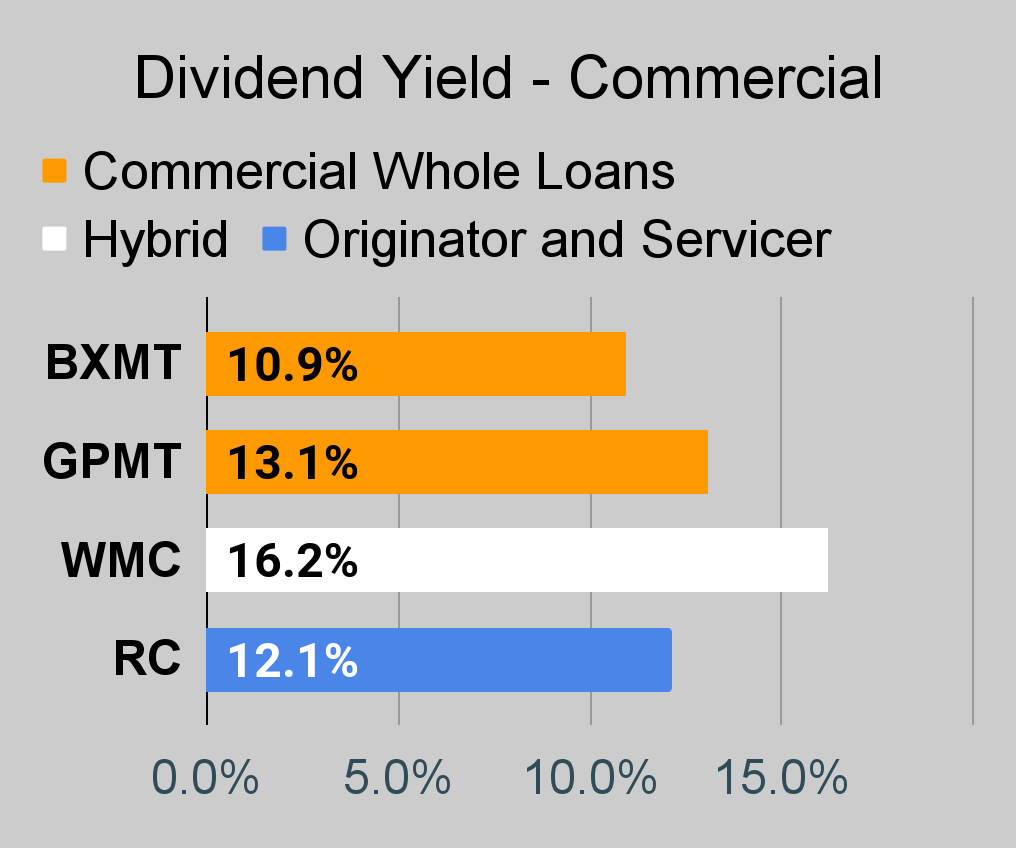
Commercial Mortgage REIT Charts
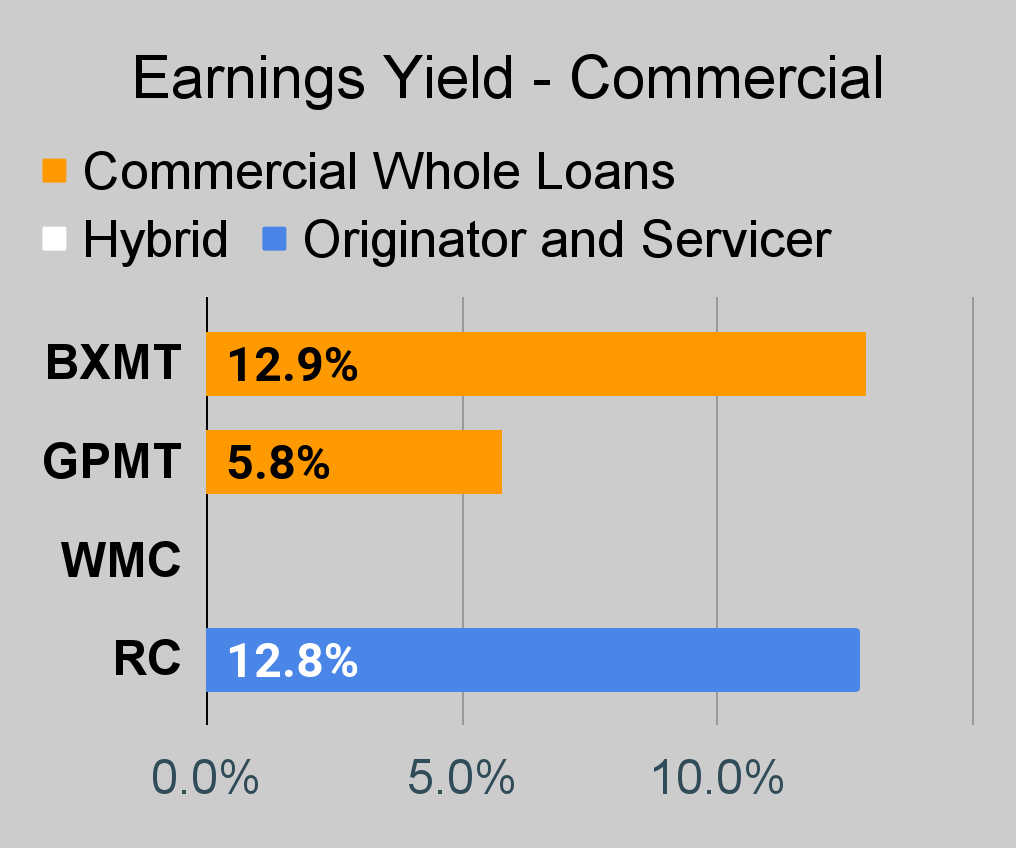
BDC Charts
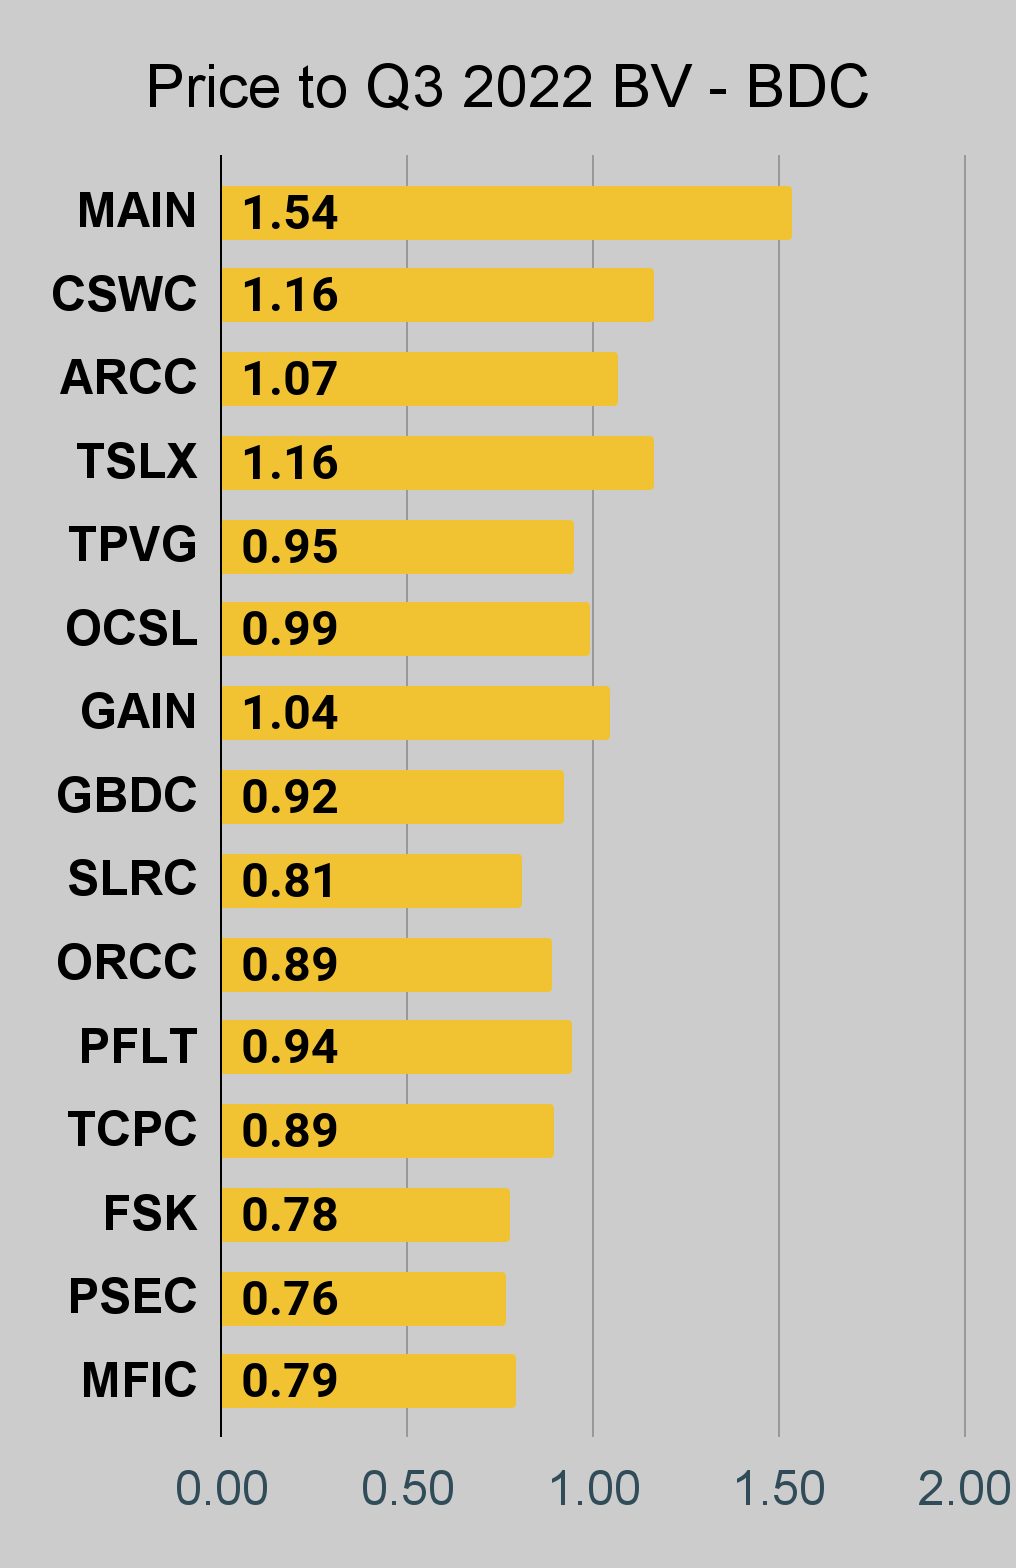
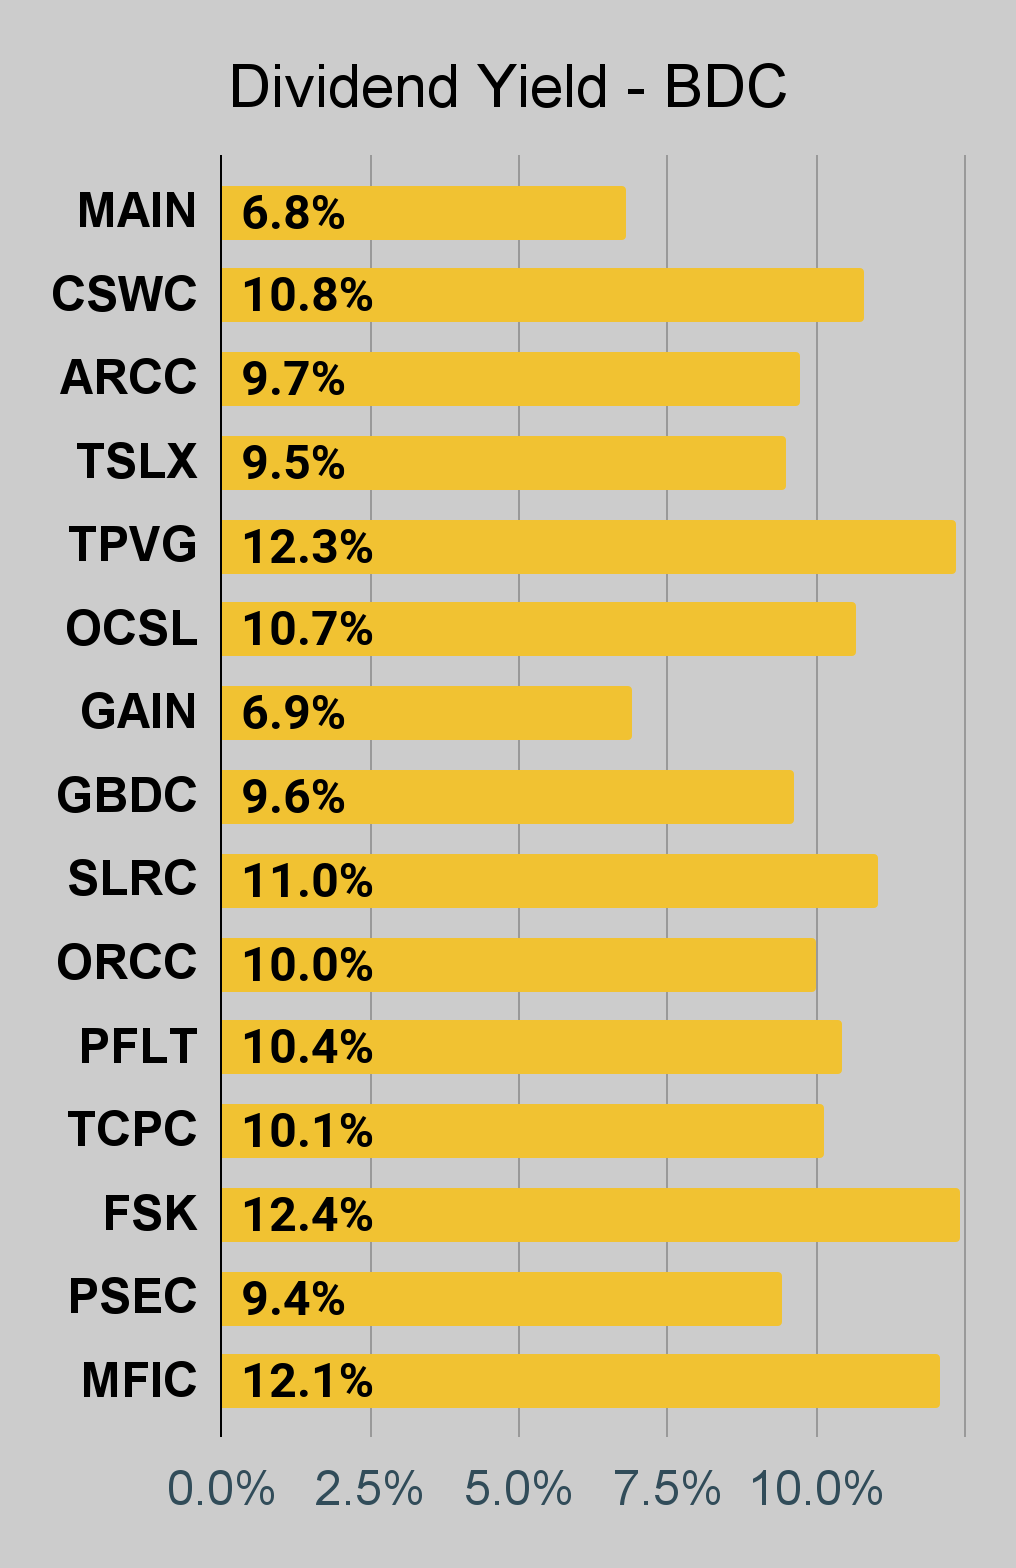
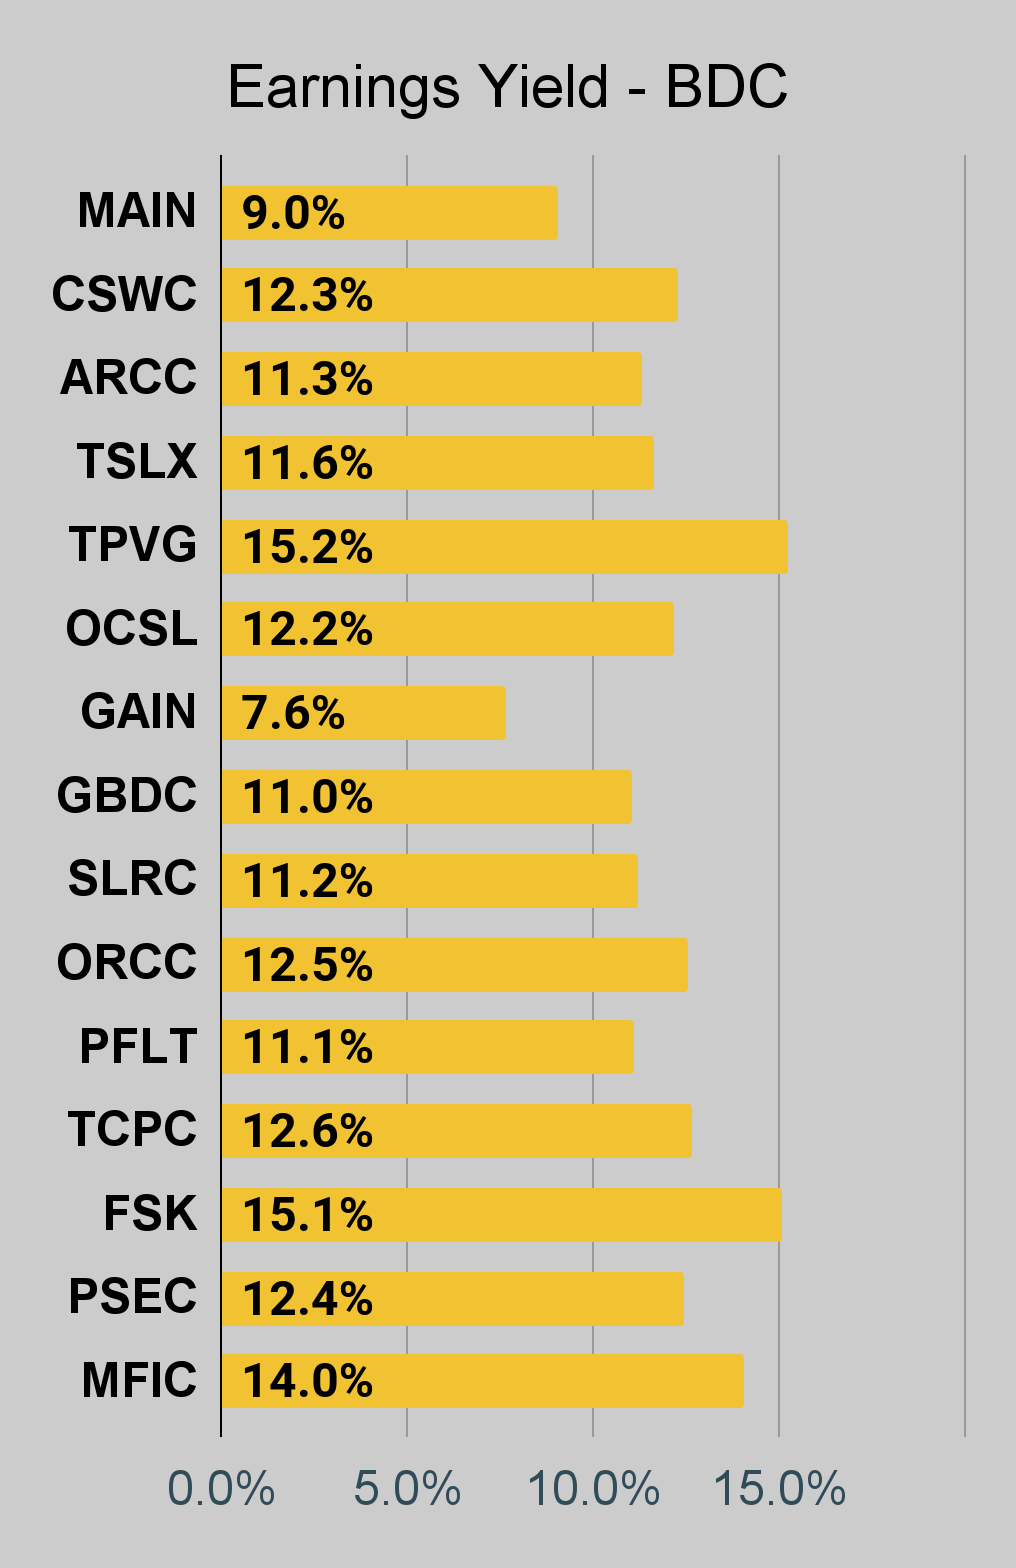
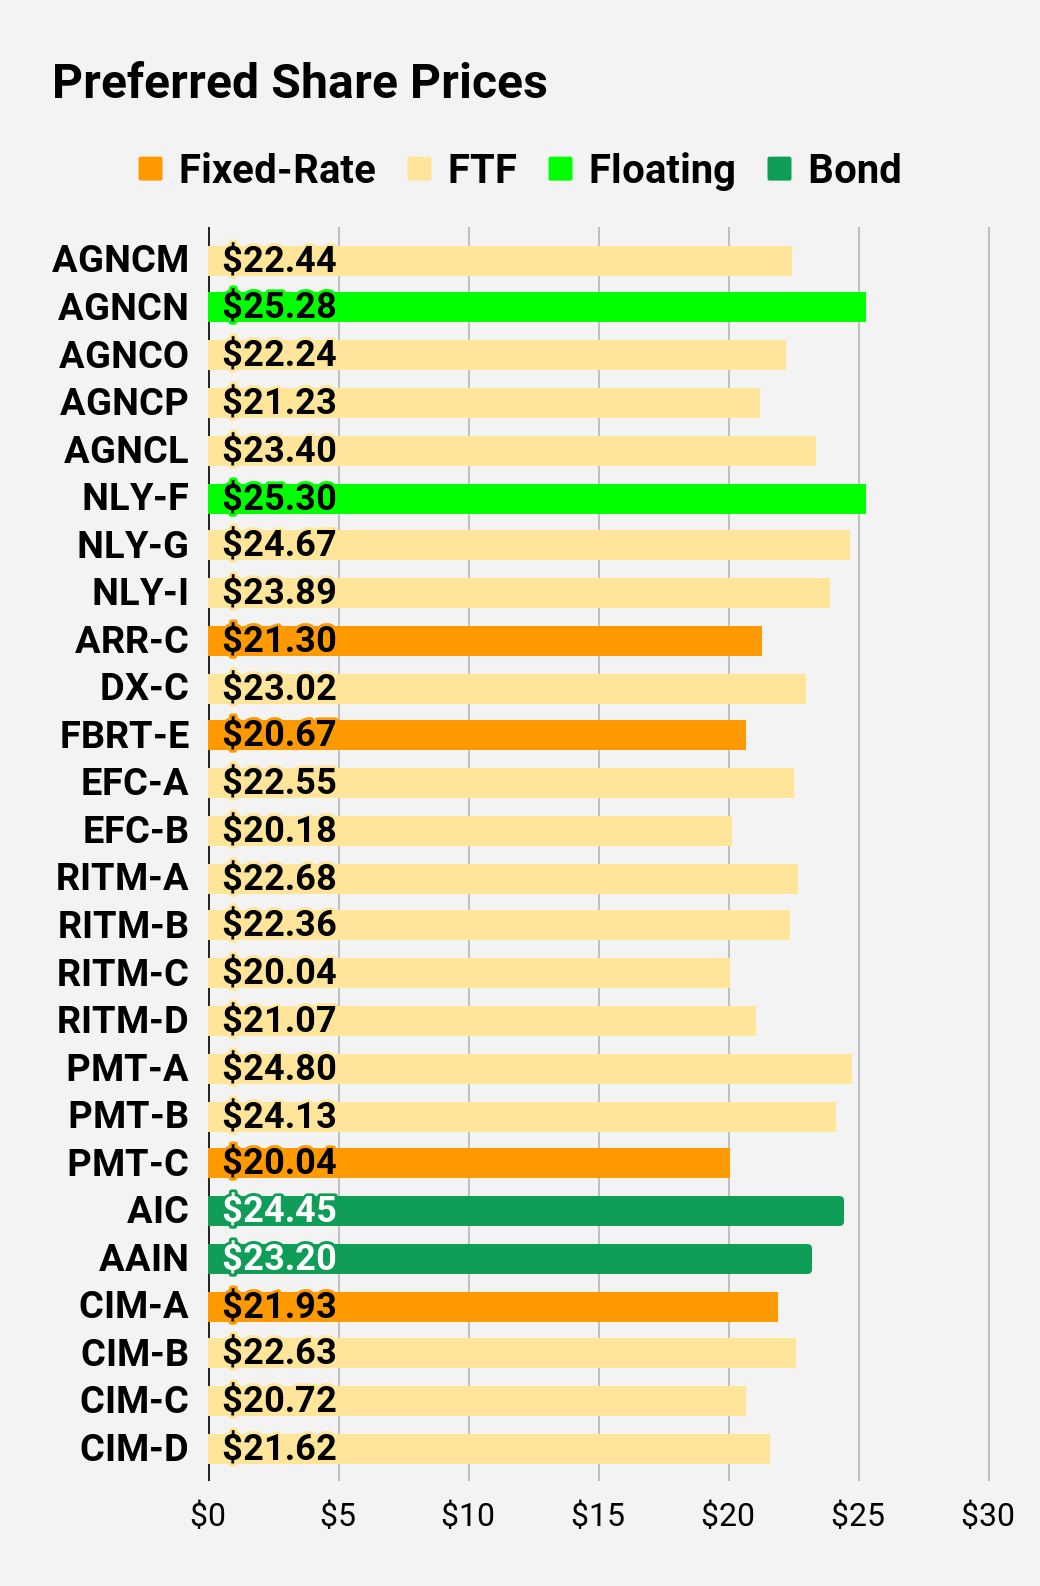
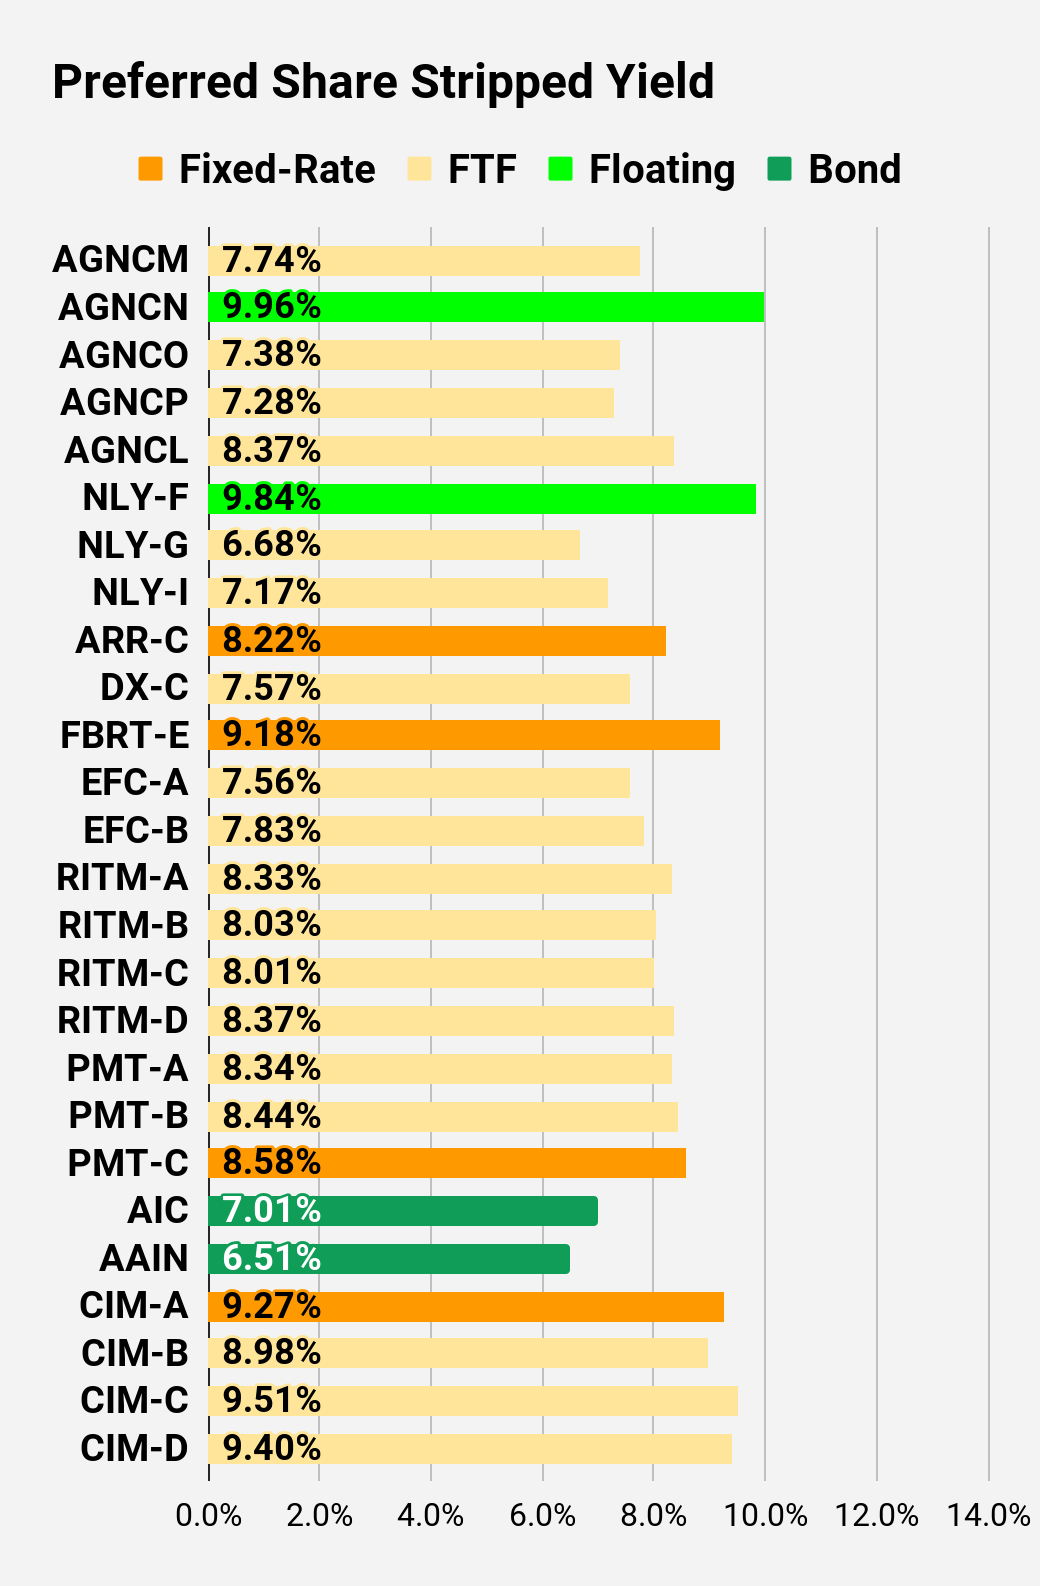
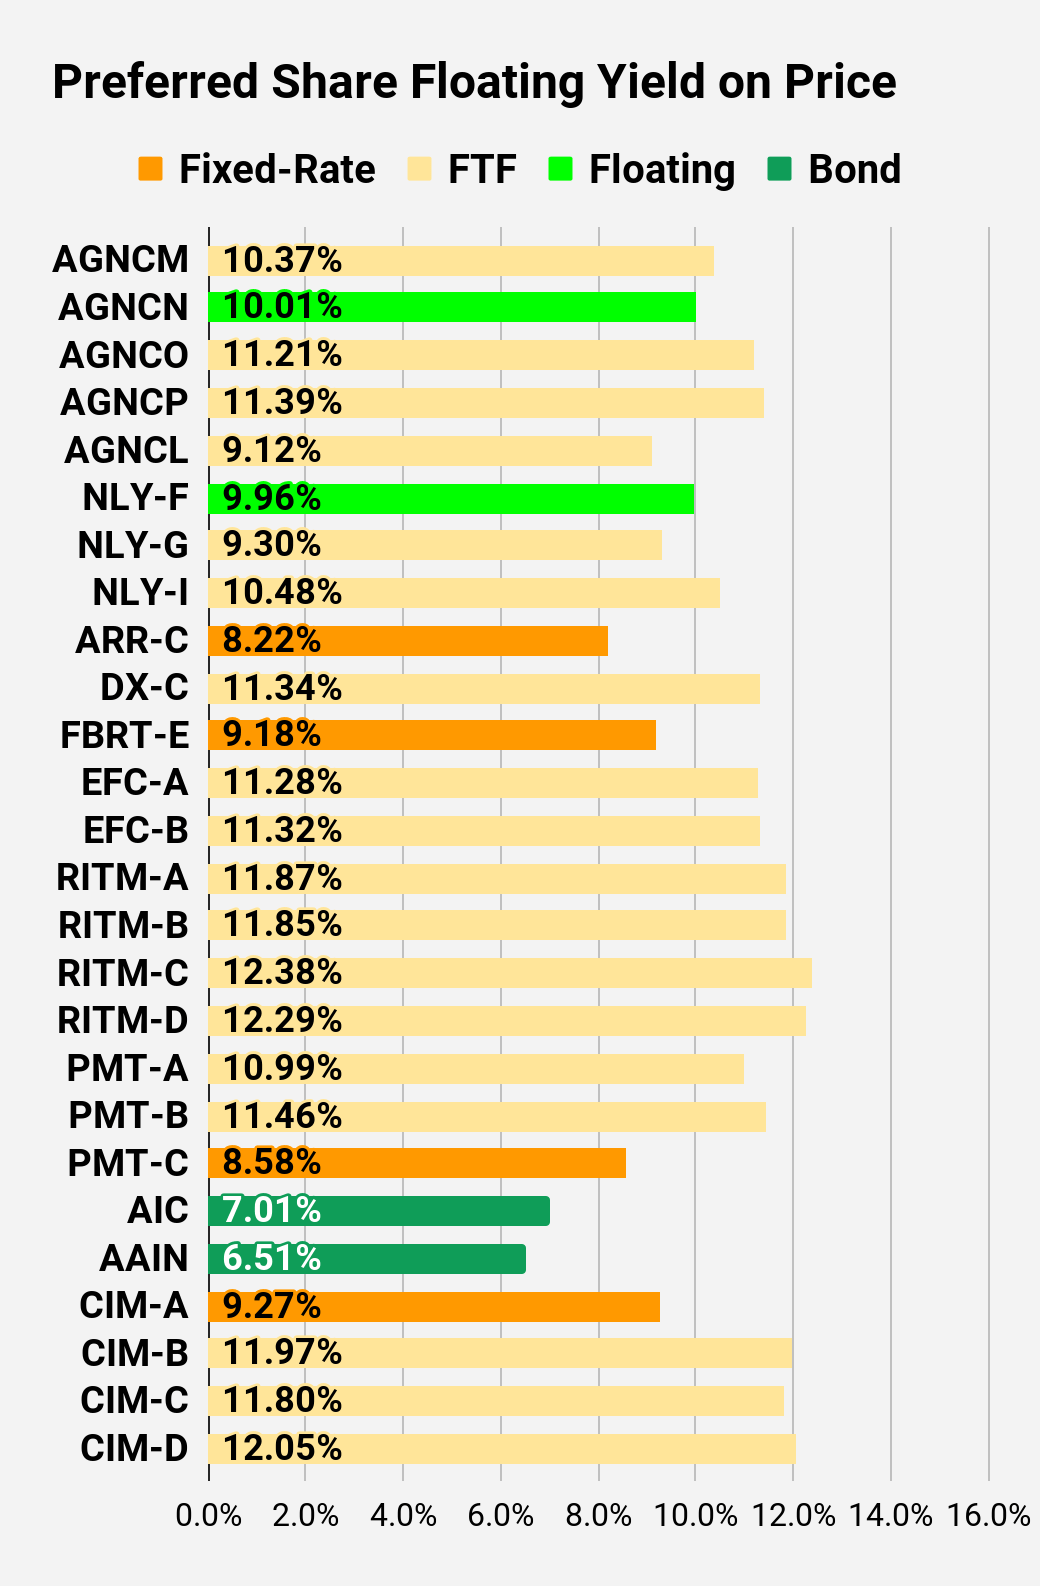
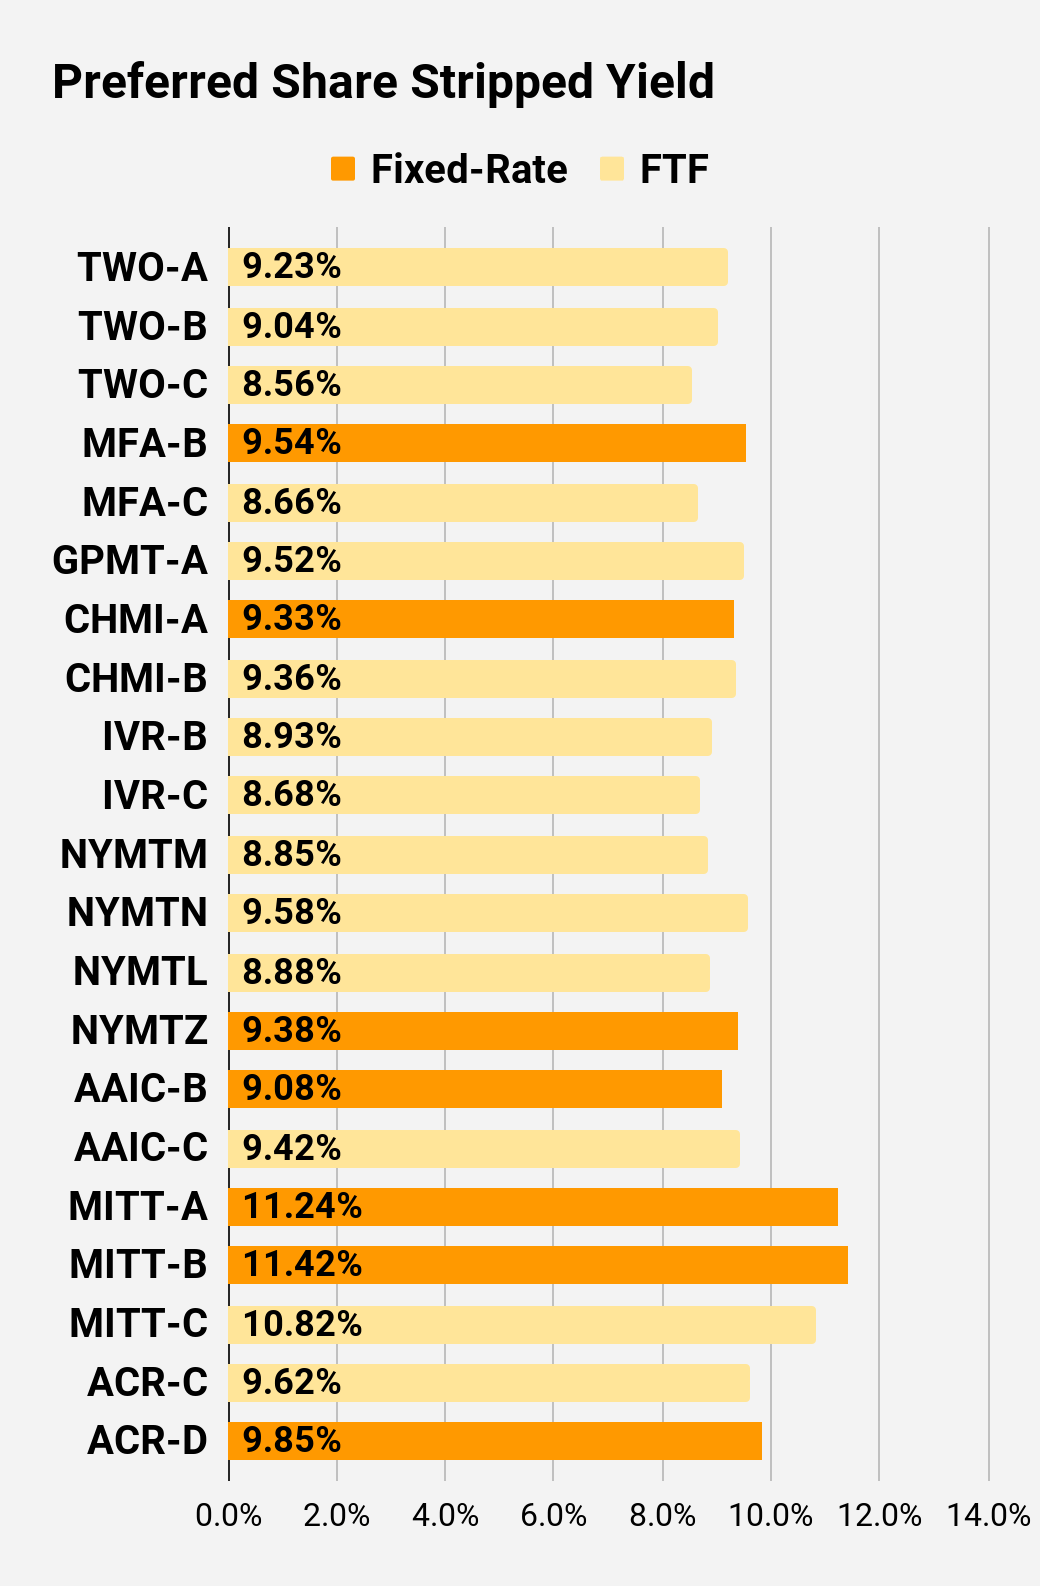
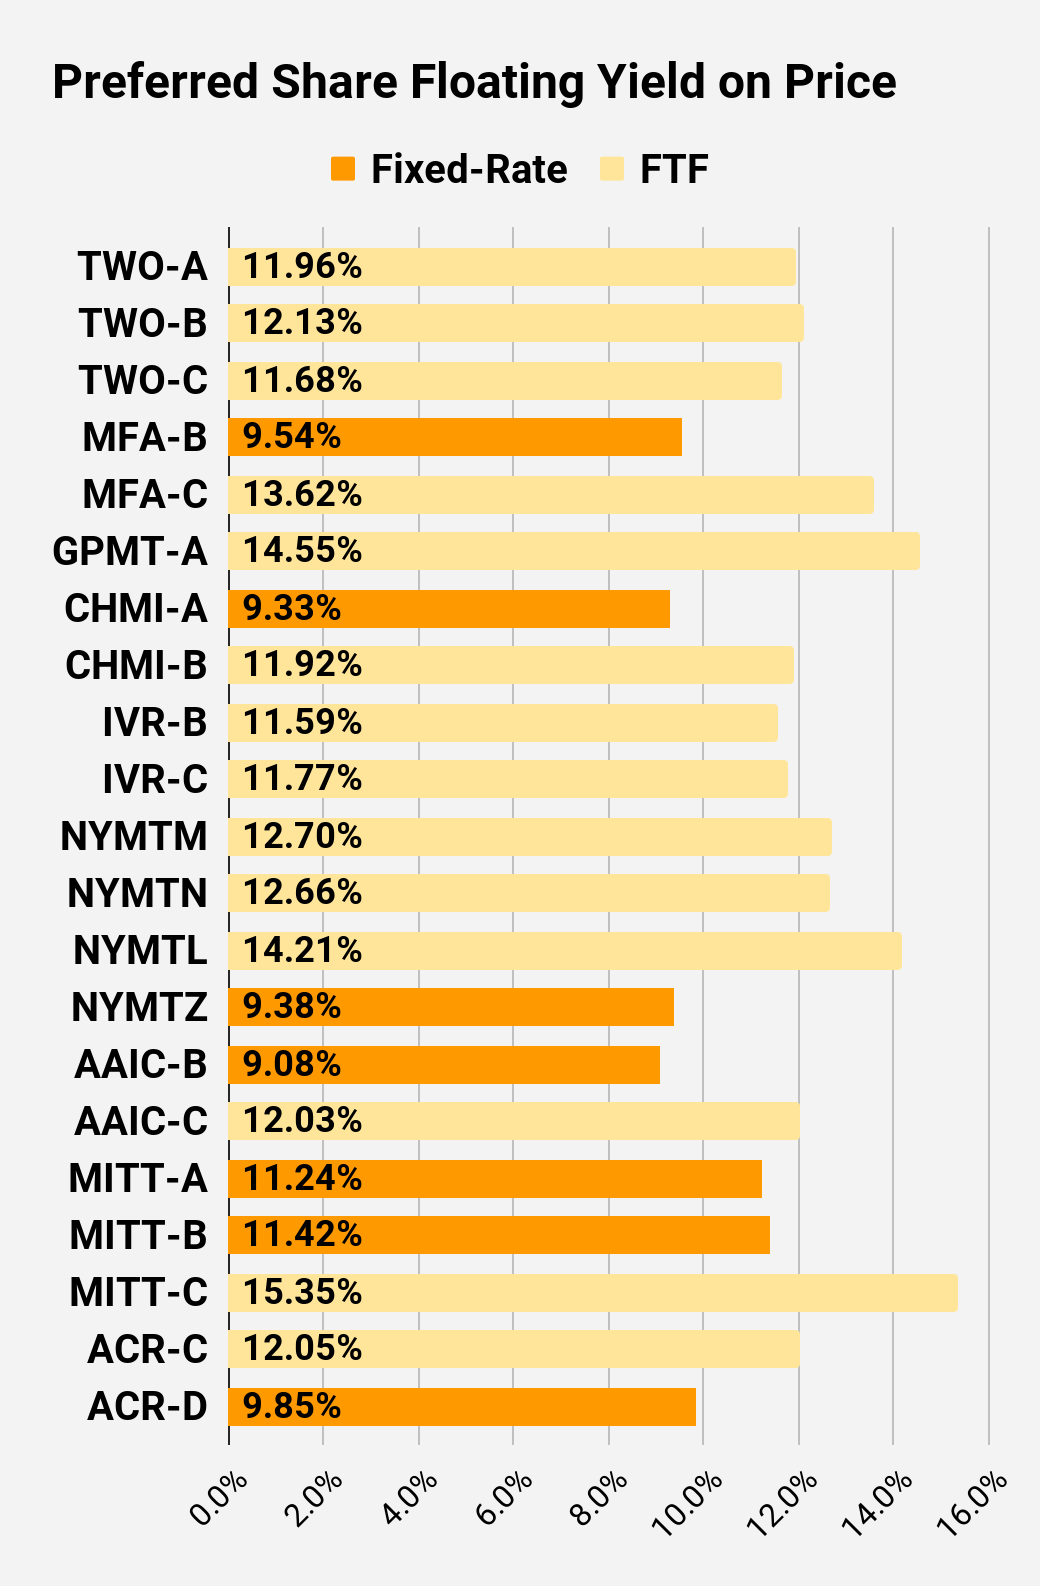
Preferred Share Charts
I changed the coloring a bit. We needed to adjust to include that the first fixed-to-floating shares have transitioned over to floating rates. When a share already is floating, the stripped yield may be different from the “Floating Yield on Price” due to changes in interest rates. For instance, NLY-F already has a floating rate. However, the rate is only reset once per three months. The stripped yield is calculated using the upcoming projected dividend payment and the “Floating Yield on Price” is based on where the dividend would be if the rate reset today. In my opinion, for these shares the “Floating Yield on Price” is clearly the more important metric.
Preferred Share Data
Beyond the charts, we’re also providing our readers with access to several other metrics for the preferred shares.
After testing out a series on preferred shares, we decided to try merging it into the series on common shares. After all, we're still talking about positions in mortgage REITs. We don’t have any desire to cover preferred shares without cumulative dividends, so any preferred shares you see in our column will have cumulative dividends. You can verify that by using Quantum Online. We’ve included the links in the table below.
To better organize the table, we needed to abbreviate column names as follows:
- Price = Recent Share Price - Shown in Charts
- BoF = Bond or FTF (Fixed-to-Floating)
- S-Yield = Stripped Yield - Shown in Charts
- Coupon = Initial Fixed-Rate Coupon
- FYoP = Floating Yield on Price - Shown in Charts
- NCD = Next Call Date (the soonest shares could be called)
- Note: For all FTF issues, the floating rate would start on NCD.
- WCC = Worst Cash to Call (lowest net cash return possible from a call)
- QO Link = Link to Quantum Online Page
| Ticker |
| Price |
| BoF |
| S-Yield |
| Coupon |
| FYoP |
| NCD |
| WCC |
| QO Link |
| P-Link |
| $22.44 |
| FTF |
| 7.74% |
| 6.88% |
| 10.37% |
| 4/15/2024 |
| $4.72 |
| $25.28 |
| Floating |
| 9.96% |
| 9.94% |
| 10.01% |
| 3/18/2023 |
| $0.16 |
| $22.24 |
| FTF |
| 7.38% |
| 6.50% |
| 11.21% |
| 10/15/2024 |
| $5.62 |
| $21.23 |
| FTF |
| 7.28% |
| 6.13% |
| 11.39% |
| 4/15/2025 |
| $7.22 |
| $23.40 |
| FTF |
| 8.37% |
| 7.75% |
| 9.12% |
| 10/15/2027 |
| $10.82 |
| $25.30 |
| Floating |
| 9.84% |
| 9.75% |
| 9.96% |
| 3/18/2023 |
| $0.23 |
| $24.67 |
| FTF |
| 6.68% |
| 6.50% |
| 9.30% |
| 3/31/2023 |
| $0.74 |
| $23.89 |
| FTF |
| 7.17% |
| 6.75% |
| 10.48% |
| 6/30/2024 |
| $3.65 |
| $21.30 |
| 8.22% |
| 7.00% |
| 8.22% |
| 1/28/2025 |
| $7.05 |
| $23.02 |
| FTF |
| 7.57% |
| 6.90% |
| 11.34% |
| 4/15/2025 |
| $5.86 |
| $20.67 |
| 9.18% |
| 7.50% |
| 9.18% |
| 3/18/2023 |
| $4.65 |
| $22.55 |
| FTF |
| 7.56% |
| 6.75% |
| 11.28% |
| 10/30/2024 |
| $5.41 |
| $20.18 |
| FTF |
| 7.83% |
| 6.25% |
| 11.32% |
| 1/30/2027 |
| $11.08 |
| $22.68 |
| FTF |
| 8.33% |
| 7.50% |
| 11.87% |
| 8/15/2024 |
| $5.15 |
| $22.36 |
| FTF |
| 8.03% |
| 7.13% |
| 11.85% |
| 8/15/2024 |
| $5.33 |
| $20.04 |
| FTF |
| 8.01% |
| 6.38% |
| 12.38% |
| 2/15/2025 |
| $8.17 |
| $21.07 |
| FTF |
| 8.37% |
| 7.00% |
| 12.29% |
| 11/15/2026 |
| $10.51 |
| $24.80 |
| FTF |
| 8.34% |
| 8.13% |
| 10.99% |
| 3/15/2024 |
| $2.74 |
| $24.13 |
| FTF |
| 8.44% |
| 8.00% |
| 11.46% |
| 6/15/2024 |
| $3.88 |
| $20.04 |
| 8.58% |
| 6.75% |
| 8.58% |
| 8/24/2026 |
| $11.20 |
| $24.45 |
| Bond |
| 7.01% |
| 6.75% |
| 7.01% |
| 3/18/2023 |
| $0.97 |
| $23.20 |
| Bond |
| 6.51% |
| 6.00% |
| 6.51% |
| 8/1/2023 |
| $2.54 |
| $21.93 |
| 9.27% |
| 8.00% |
| 9.27% |
| 3/18/2023 |
| $3.50 |
| $22.63 |
| FTF |
| 8.98% |
| 8.00% |
| 11.97% |
| 3/30/2024 |
| $4.87 |
| $20.72 |
| FTF |
| 9.51% |
| 7.75% |
| 11.80% |
| 9/30/2025 |
| $9.62 |
| $21.62 |
| FTF |
| 9.40% |
| 8.00% |
| 12.05% |
| 03/30/2024 |
| $5.88 |
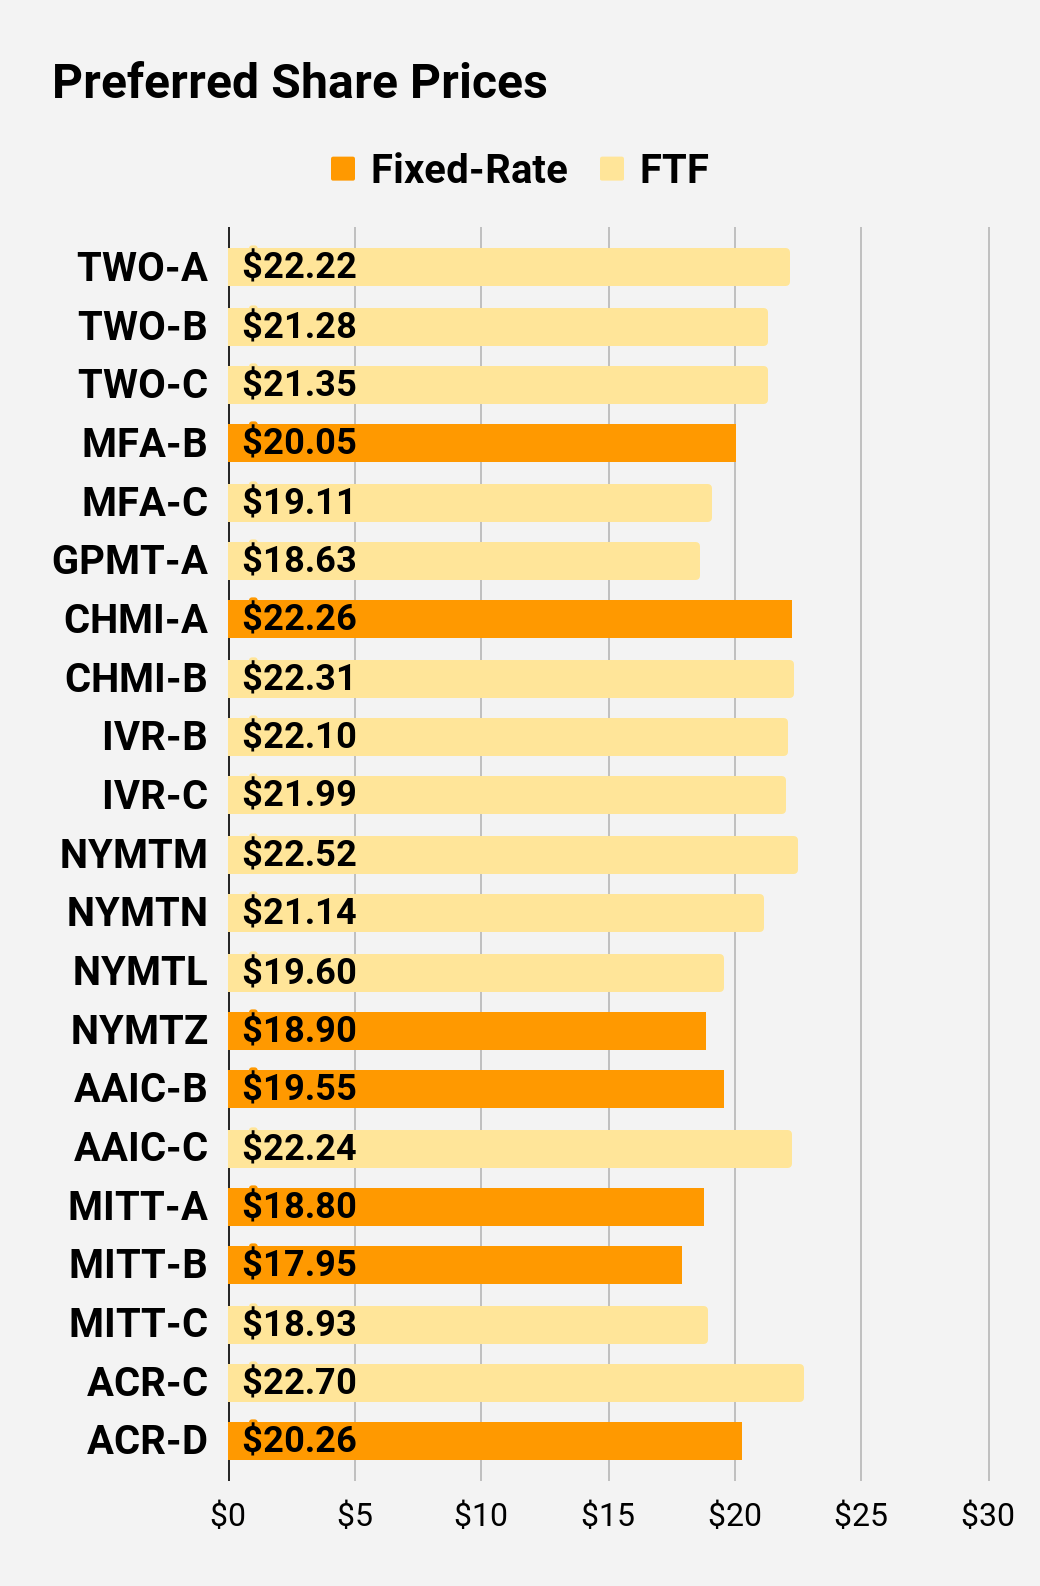
Second Batch:
| Ticker |
| Price |
| BoF |
| S-Yield |
| Coupon |
| FYoP |
| NCD |
| WCC |
| QO Link |
| P-Link |
| $22.22 |
| FTF |
| 9.23% |
| 8.13% |
| 11.96% |
| 04/27/2027 |
| $11.41 |
| $21.28 |
| FTF |
| 9.04% |
| 7.63% |
| 12.13% |
| 07/27/2027 |
| $12.29 |
| $21.35 |
| FTF |
| 8.56% |
| 7.25% |
| 11.68% |
| 1/27/2025 |
| $7.28 |
| $20.05 |
| 9.54% |
| 7.50% |
| 9.54% |
| 3/18/2023 |
| $5.35 |
| $19.11 |
| FTF |
| 8.66% |
| 6.50% |
| 13.62% |
| 3/31/2025 |
| $9.55 |
| $18.63 |
| FTF |
| 9.52% |
| 7.00% |
| 14.55% |
| 11/30/2026 |
| $13.15 |
| $22.26 |
| 9.33% |
| 8.20% |
| 9.33% |
| 3/18/2023 |
| $3.02 |
| $22.31 |
| FTF |
| 9.36% |
| 8.25% |
| 11.92% |
| 4/15/2024 |
| $5.19 |
| $22.10 |
| FTF |
| 8.93% |
| 7.75% |
| 11.59% |
| 12/27/2024 |
| $6.80 |
| $21.99 |
| FTF |
| 8.68% |
| 7.50% |
| 11.77% |
| 9/27/2027 |
| $11.94 |
| $22.52 |
| FTF |
| 8.85% |
| 7.88% |
| 12.70% |
| 1/15/2025 |
| $6.43 |
| $21.14 |
| FTF |
| 9.58% |
| 8.00% |
| 12.66% |
| 10/15/2027 |
| $13.36 |
| $19.60 |
| FTF |
| 8.88% |
| 6.88% |
| 14.21% |
| 10/15/2026 |
| $11.85 |
| $18.90 |
| 9.38% |
| 7.00% |
| 9.38% |
| 1/15/2027 |
| $13.11 |
| $19.55 |
| 9.08% |
| 7.00% |
| 9.08% |
| 3/18/2023 |
| $5.73 |
| $22.24 |
| FTF |
| 9.42% |
| 8.25% |
| 12.03% |
| 3/30/2024 |
| $5.23 |
| $18.80 |
| 11.24% |
| 8.25% |
| 11.24% |
| 3/18/2023 |
| $6.68 |
| $17.95 |
| 11.42% |
| 8.00% |
| 11.42% |
| 3/18/2023 |
| $7.51 |
| $18.93 |
| FTF |
| 10.82% |
| 8.00% |
| 15.35% |
| 9/17/2024 |
| $9.54 |
| $22.70 |
| FTF |
| 9.62% |
| 8.63% |
| 12.05% |
| 7/30/2024 |
| $5.54 |
| $20.26 |
| 9.85% |
| 7.88% |
| 9.85% |
| 5/21/2026 |
| $11.26 |
Strategy
Our goal is to maximize total returns . We achieve those most effectively by including “trading” strategies. We regularly trade positions in the mortgage REIT common shares and BDCs because:
- Prices are inefficient.
- Long term, share prices generally revolve around book value.
- Short term, price-to-book ratios can deviate materially.
- Book value isn’t the only step in analysis, but it is the cornerstone.
We also allocate to preferred shares and equity REITs. We encourage buy-and-hold investors to consider using more preferred shares and equity REITs.
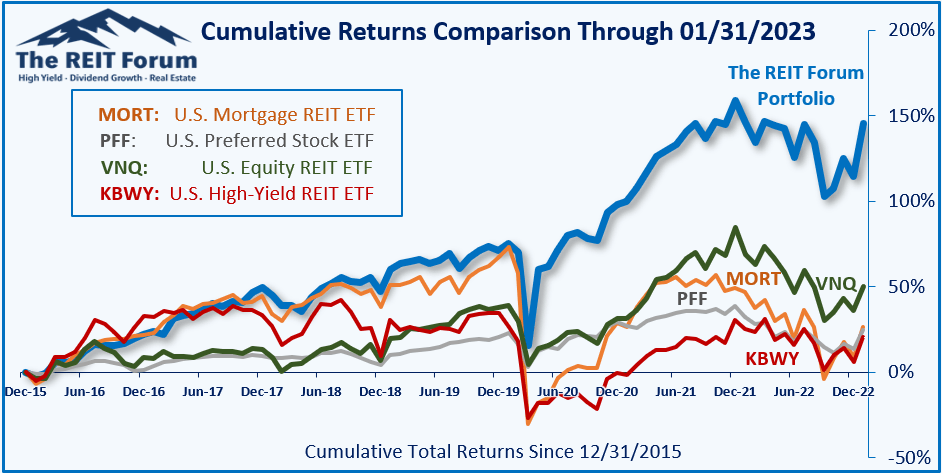
Performance
We compare our performance against four ETFs that investors might use for exposure to our sectors:
The REIT Forum
The four ETFs we use for comparison are:
| Ticker |
| Exposure |
| One of the largest mortgage REIT ETFs |
| One of the largest preferred share ETFs |
| Largest equity REIT ETF |
| The high-yield equity REIT ETF. Yes, it has been dreadful. |
When investors think it isn’t possible to earn solid returns in preferred shares or mortgage REITs, we politely disagree. The sector has plenty of opportunities, but investors still need to be wary of the risks. We can’t simply reach for yield and hope for the best. When it comes to common shares, we need to be even more vigilant to protect our principal by regularly watching prices and updating estimates for book value and price targets.
Ratings: Bearish on CHM I. Again. That's it. We are not posting, changing, or reiterating ratings on NLY in this article as I want to wait for further price movements or book value movements to post an update.
For further details see:
16% Dividend Yield Slash Incoming