SPGP - 18 World-Beater Blue Chips For The Ultimate High-Yield Retirement Portfolio
2023-04-01 08:00:00 ET
Summary
- World-beater blue chips are the best way for regular people like you and me to achieve our financials dreams.
- Over 50 years of market data shows there is an optimal asset allocation for earning good to great yield, great returns, and minimizing volatility during recessions and bear markets.
- My family's hedge fund is what our medical bills, and future hopes and philanthropic dreams, rest upon.
- That's why I've invested my life savings into 18 world-beater blue chips that make the Dividend Kings ZEUS Income Growth portfolio.
- This 4.2% yielding portfolio has 14.2% long-term historical and expected future returns. And its average peak decline during bear markets is 12%, 66% less than the S&P 500. All while delivering 2X the yield of a 60/40 and delivering an 85% chance of beating the S&P over the next 50 years, but with a 173X smaller chance of a bear market in any given year.
The Original Special Video Report Version Of This Article Was Published On Dividend Kings (Preparing For Recession Part 34) On November 9th, 2022. The data has been updated for March 30th.
It's part of the Dividend Kings 75 Part Preparing For Recession Video Series.
This week I'm attending a work conference and thus publishing updated versions of these video articles.
—-------------------------------------------------------------------------
One of the most important goals is to help you prepare emotionally and financially for the market's inevitable downturns.
This includes helping you remain calm, rational, and disciplined throughout all market and economic cycles.
To paraphrase Napoleon, the definition of a stock market genius is
The investor who can do the average thing when everyone else around him/her is losing their mind."
Why?
After Market Hell, Market Heaven Follows...If You Can Ride Out The Short-Term Pain.
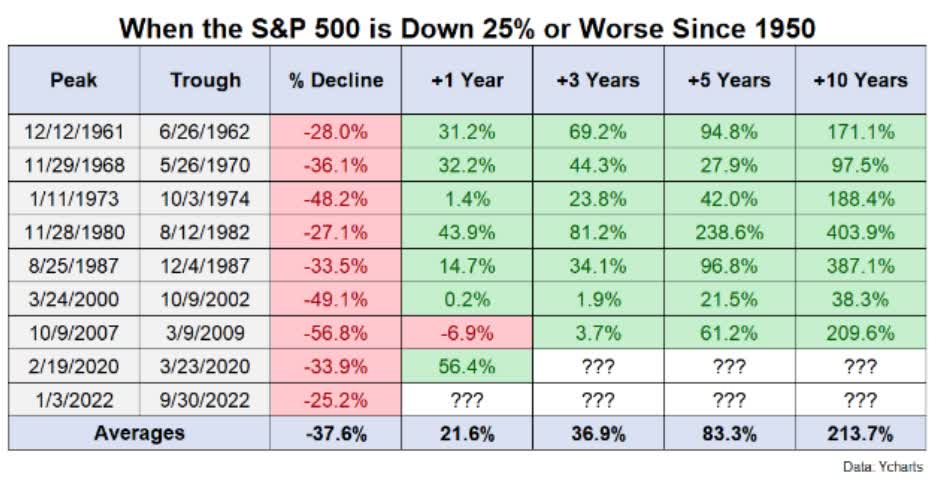
From the first time the market hits -25%, the average 12-month gain is +22%, and 10 years later, the average gain is 214%, with stocks more than tripling.
Even during the 1970s stagflation, stocks delivered solid 2X to 3X gains after 25% bear markets.
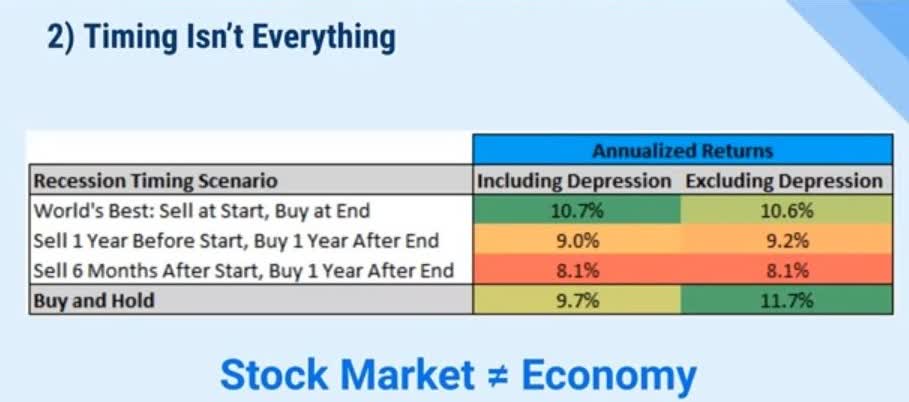
And even perfect economic timing isn't enough to beat buy-and-hold blue-chip investing over the long-term.
But of course, even 12 months in a bear market can feel like an eternity.
Thus, the reason for this 75-part series on how to emotionally and financially prepare for recessions and bear markets.
- Part 1: The Nature Of Corrections And Bear Markets
- Part 2: History’s Lessons For The Next Downturn
- Part 3: The Role Of Bonds In A Diversified Recession-Resistant Portfolio
- Part 4: How The Fed Plans To Beat Inflation While Avoiding Recession
- Part 5: How Recessions Affect Corporate Fundamentals And Dividends
- Part 6: How The Yield Curve Predicts Recessions
- Part 7: The Economic Fundamentals That Predict Recessions
- Part 8: Building A SWAN Retirement Portfolio, Determining Your Risk Profile
- Part 9: Building A SWAN Retirement Portfolio, Choosing The Right Asset Allocations
- Part 10: How To Optimize Your Asset Allocation
- Part 11: The Importance And Power Of Diversification
- Part 12: How Diversification Optimizes Long-Term Retirement Income
- Part 13: Great Dividend ETFs To Help You Achieve Your Financial Goals
- Part 14: Great Growth ETFs To Help You Achieve Your Financial Goals
- Part 15: Sector ETFs To Consider Part 1
- Part 16: Sector ETFs To Consider Part 2
- Part 17: Dividend Aristocrat ETFs To Consider
- Part 18: 4 International High-Yield ETFs To Consider
- Part 19: 4 More International High-Yield ETFs To Consider
- Part 20: Beware International Dividend Aristocrat ETFs
- Part 21: Global Dividend ETFs Are Great...But There's A Catch
- Part 22: 5 Safe High-Yield Monthly Paying CEFs To Consider
- Part 23: A Powerful Way To Hedge Against Stagflation
- Part 24: How To Avoid Dangerous CEFs and ETFs (With 4 Examples)
- Part 25: Introducing The DK Great ETF/CEF Database Tool
- Part 26: Building A SWAN Retirement Portfolio: How To Find The Safest Recession-Resistant Blue-Chips
- Part 27: How To Avoid Sucker Yield Traps
- Part 28: Building A SWAN Retirement Portfolio: Finding The Most Dependable Blue-Chips
- Part 29: Building A SWAN Retirement Portfolio: How To Find Attractively Valued Blue-Chips
- Part 30: Choosing The Blue Chips For Your Needs
- Part 31: When To Rebalance Your Portfolio
- Part 32: Guide To Tax Loss Harvesting
- Part 33: Superior Alternatives To A Traditional 60/40 Retirement Portfolio
- Part 34: The Long-Term Recession-Optimized Portfolio
- Part 35: Building A Zen Extraordinary Ultra SWAN (Z.E.U.S) High-Yield Portfolio
- Part 36: Building A Zen Extraordinary Ultra SWAN (Z.E.U.S) Growth Portfolio
- Part 37: Building A Zen Extraordinary Ultra SWAN Value Portfolio (Z.E.U.S)
- Part 38: How To Back Test And Stress Test Your Optimal Portfolio
- Part 39: Good Risk Management Can Save You From Catastrophe
- Part 40: Why Hedge Funds Are A Bad Deal And How To Build Your Own
- Part 41: ZEUS Income Growth Annual Rebalancing & New Rebalancing Tool
- Part 42: How To Rebalance A High-Yield Portfolio
- Part 43: Preparing For Recession Webinar Video
- Part 44: A Potentially Game-Changing 12.4% Yielding ETF For Your Ultra SWAN Portfolio
- Part 45: The Dangerous Way Most Investors Use Leverage
- Part 46: What You Need To Know About Stagflation
- Part 47: The Smart Way To Buy Stocks During A Bear Market
- Part 48: The ZEUS Dollar-Cost-Averaging Strategy
- Part 49: How To Sell Bonds To Buy Stocks During A Bear Market
- Part 50: Net Worth Diversification
- Part 51: How To Hedge Your Portfolio Against Stagflation
- Part 52: Preparing For The Potential Debt Ceiling Crisis
- Part 53: How Bad This Bear Market Is Likely To Get
- Part 54: Don't Fall Victim To Recession Doomsday Prophets
- Part 55: The Right And Wrong Way To Think About Forecasts
- Part 56: Ignore The Noise And Keep Buying
- Part 57: How To Hedge Against Recession
- Part 58: When Experts Fail
- Part 59: How To Rebalance A Value Portfolio
- Part 60: DK $1 Million Retirement Portfolio Rebalancing
- Part 61: DK High-Yield Blue-Chip Portfolio Rebalancing
- Part 62: DK Deep Value Blue-Chip Portfolio Rebalancing
- Part 63: DK Fortress Portfolio Rebalancing
- Part 64: DK Phoenix Portfolio Rebalancing
- Part 65: DK Zen Retirement Portfolio Rebalancing
- Part 66: DK Zen Yield Portfolio Rebalancing
- Part 66: DK Zen Value Portfolio Rebalancing
- Part 67: DK Zen Quality Portfolio Rebalancing
- Part 68: DK Zen Growth Portfolio Rebalancing
- Part 69: The Power Of "Strategic Mediocrity."
- Part 70: Using The Right Benchmark Is Important
- Part 71: Useful Tools For Portfolio Planning, Management, and Recession Monitoring
- Part 72: Why Smart Investors Should Look Forward To Bear Markets
- Part 73: Build Your Financial Future On Facts, Not Fantasies
- Part 74: Ways Of Emotionally Dealing With This Bear Market
- Part 75: The Zen Of Bear Market Investing During Recessions
Today, I want to explain how I designed the DK ZEUS portfolio strategy and used it to create an 18-stock portfolio that's so amazing I entrust my entire life savings and $2 million family investment fund to it.
How To Build The Ultimate Recession-Optimized Dream Retirement Portfolio
You don't want to have to change portfolio strategies based on short-term economic conditions. Successful long-term investing requires a portfolio that can withstand anything likely to happen in the coming decades." - Ben Carlson .
I couldn't have said it better myself; you want a bunker sleep-well-at-night ("SWAN") retirement portfolio that is 90+% likely to handle anything the economy or stock market can throw at us in the future.
And that's the optimal asset allocation for long-term income, returns, and volatility you can withstand.
- Preparing For Recession Part 9, Choosing The Right Asset Allocation
- Preparing For Recession Part 10: How To Optimize Your Asset Allocation
Nick Maggiulli, Chief Data Scientist for Ritholtz Wealth Management, has studied optimal long-term asset allocation. In his new book "Just Keep Buying," he concludes that 67% stocks and 33% bonds/alternatives/hedges are the optimal allocations.
What exactly does "optimal" mean? Doesn't everyone have different risk profiles?
Indeed, most people agree that downside volatility is bad, and we want to maximize long-term returns while minimizing the downside.
This is where volatility-adjusted returns or "risk-adjusted" returns come in.
- Buffett doesn't define volatility as risk; fundamental risk is "the chance of a permanent capital impairment."
Hedge funds try to optimize for the Sharpe ratio.
- Total returns/annual volatility.
But a better metric is what Nick Maggiulli was optimizing in his study for his book, the Sortino ratio.
Think of the Sortino ratio as the "SWAN ratio."
- excess total return/negative volatility.
Excess total returns are total returns - the risk-free 10-year treasury return.
Negative volatility is the only kind anyone fears. If stocks are ripping higher at 1% to 3% per day? Most people don't tend to mind that. ;)
My own studies confirm that 30% to 40% bonds/hedging allocation is optimal for most blue-chip portfolios.
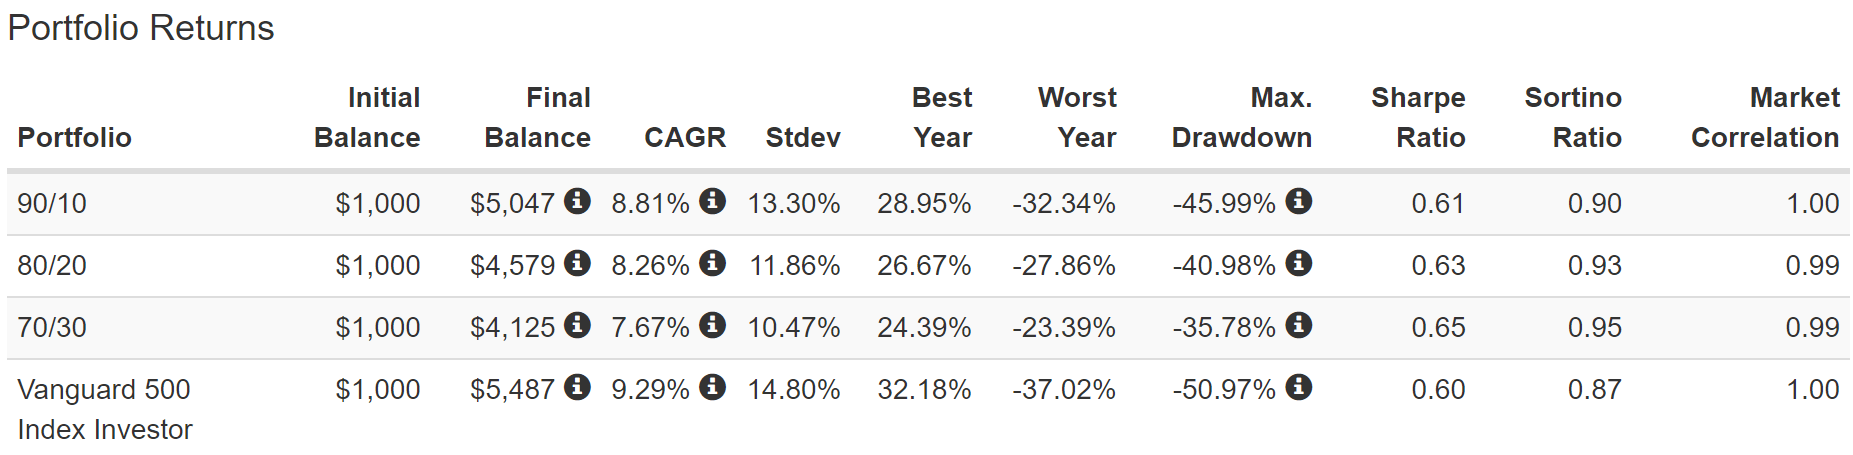
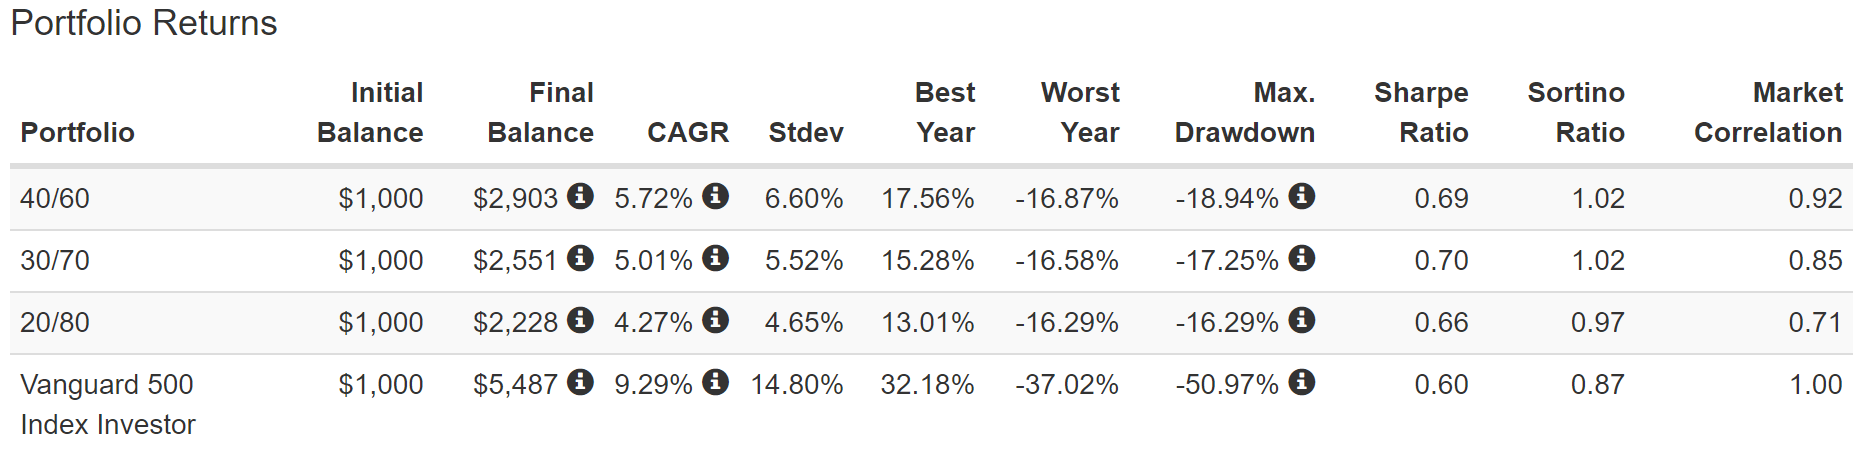
Here are some examples using the S&P 500 (SP500) and iShares Core U.S. Aggregate Bond ETF (AGG) (U.S. investment grade bonds) with various asset allocations.
Total Returns Since October 2003
A pure stock portfolio delivered slightly better returns than a balanced portfolio but with higher annual volatility and larger peak declines. Note how as our allocation to bonds is going up, the Sortino Ratio is steadily climbing.
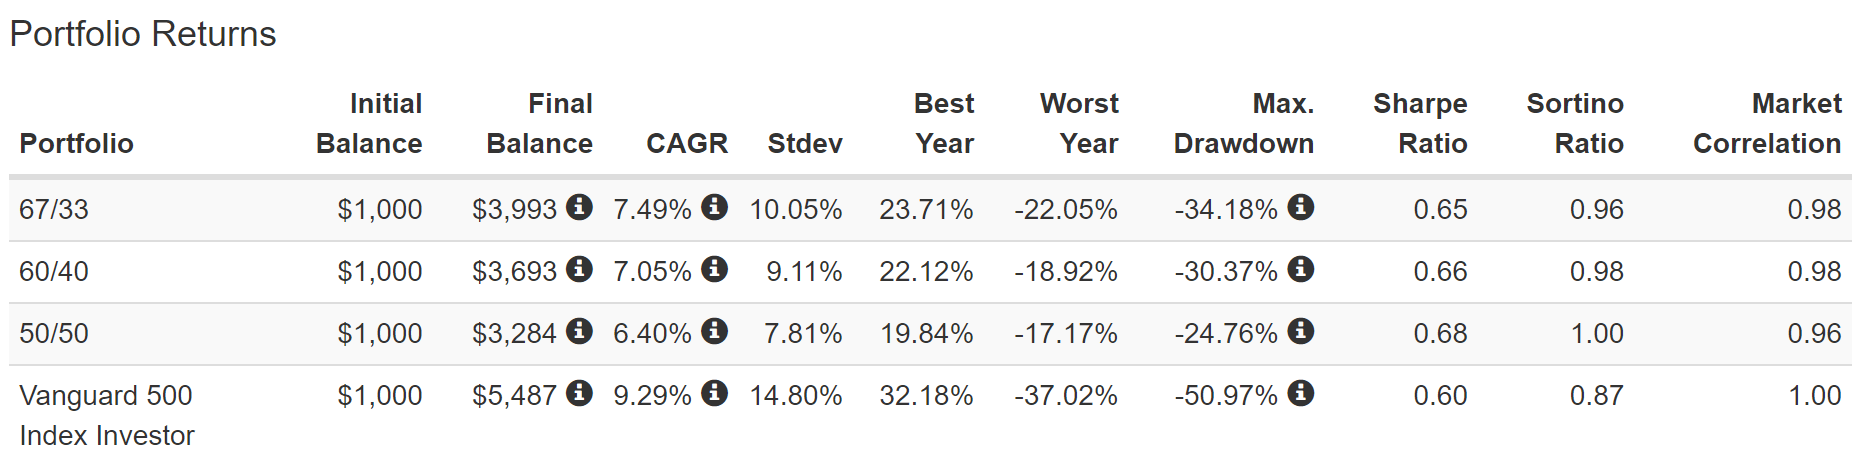
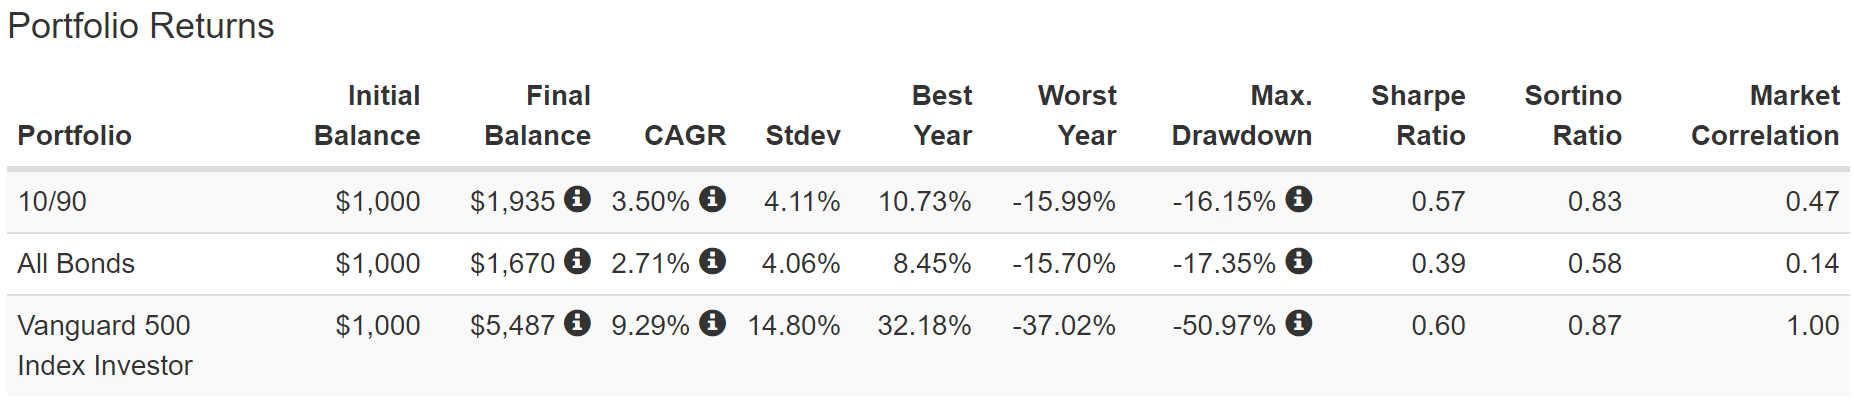
The more bonds we add to the portfolio, the lower the volatility. Still, the Sortino ratio is topping out because, eventually, the downside of too many bonds can't overcome the upside of smaller downside volatility.
Bonds have their own natural volatility, about 3% to 4% historically speaking.
And they deliver 3% to 4% long-term returns (97% of which is starting yield).
In the future, the bond market is estimating bond investors can expect about 2% inflation-adjusted returns.
- insufficient to retire on for most people
- unless you're very wealthy and can live off a 2% rule.
Now you'll notice how a 60% to 70% allocation to bonds is optimal for the maximum Sortino ratio using the S&P 500 and AGG.
But the 30% to 40% rule of thumb that Nick Maggiulli and I recommend is based on the simple fact that owning other assets is often optimal.
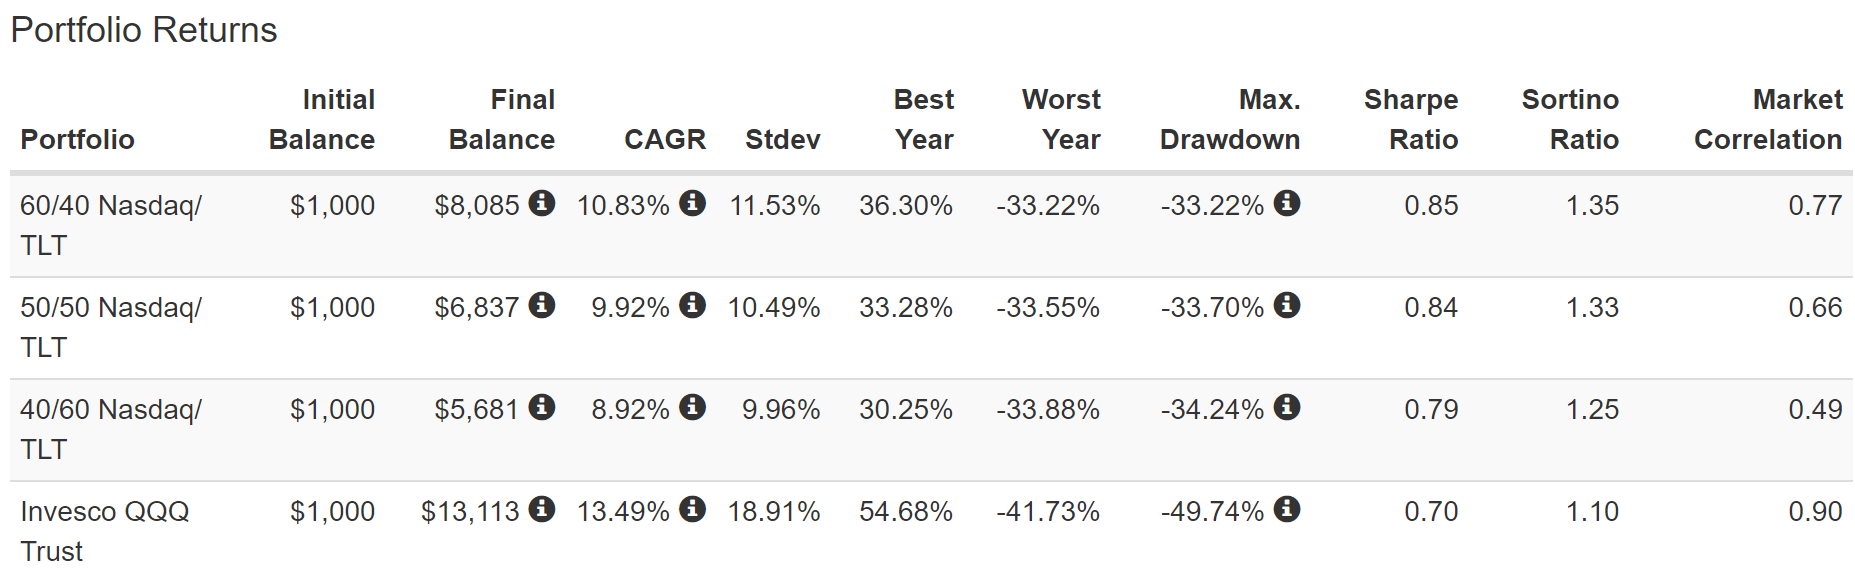
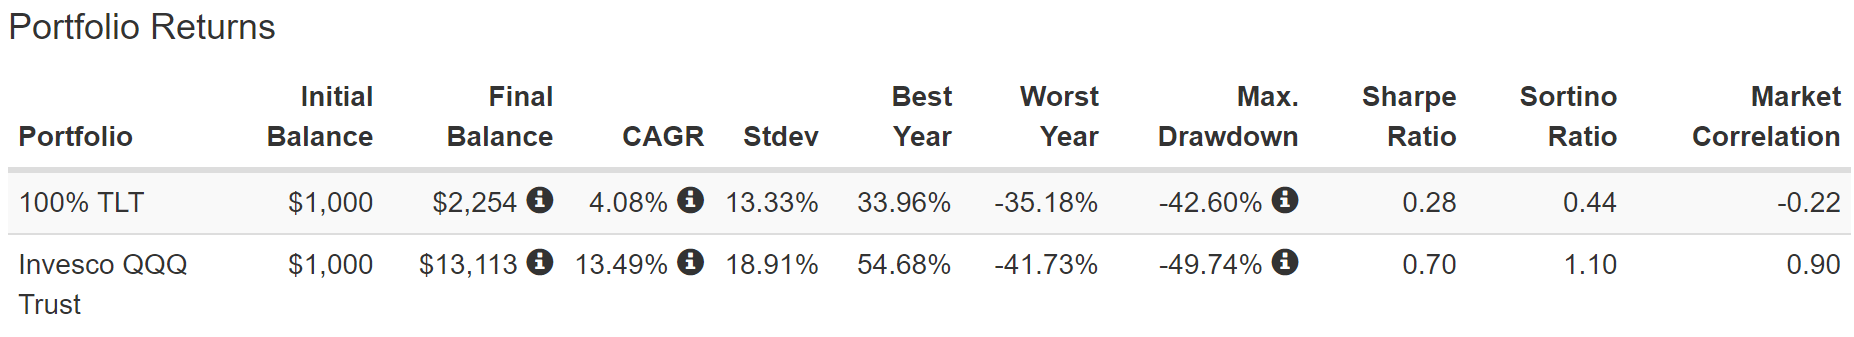
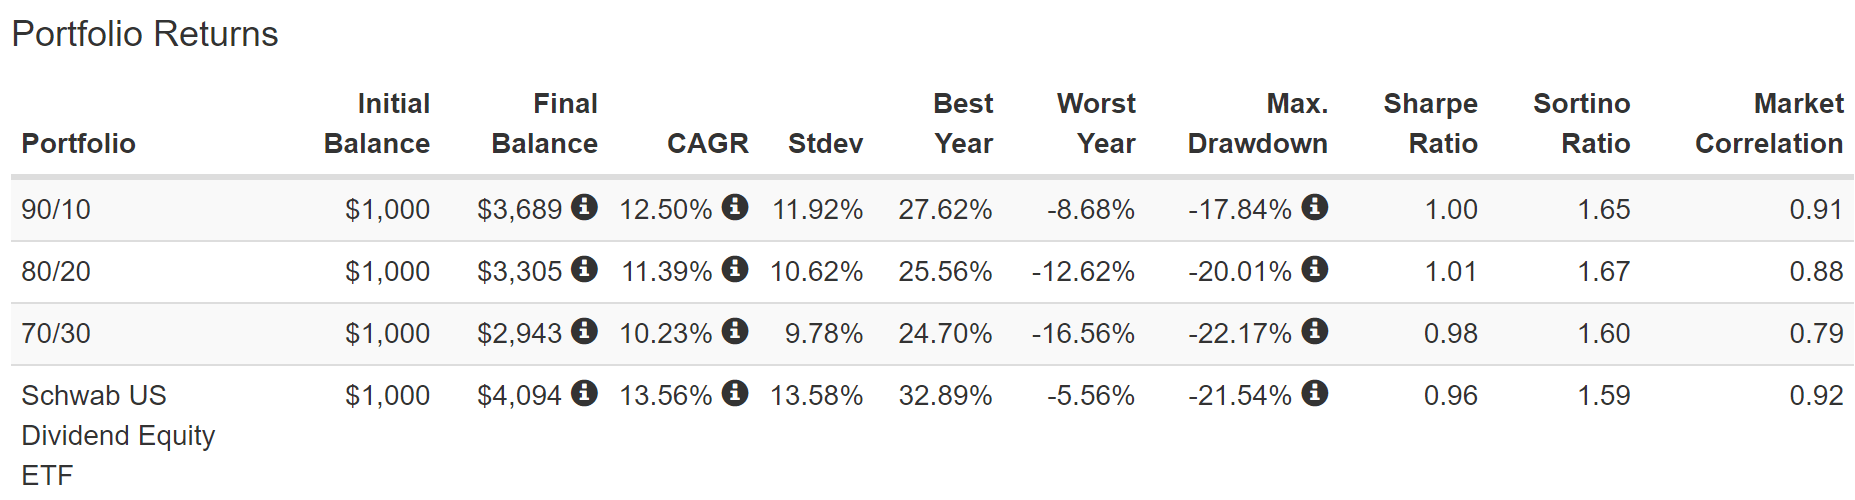
Let's consider what happens if we replace the S&P 500 with the Nasdaq ( QQQ ).
And replace AGG with iShares 20+ Year Treasury Bond ETF (TLT) (long-duration U.S. Treasuries), the best recession hedge in history, according to Duke University.
Total Returns Since August 2002
Because the Nasdaq has higher volatility than the S&P 500, you can see a significant benefit to diversifying with long-bonds, which negatively correlates with the stock market.
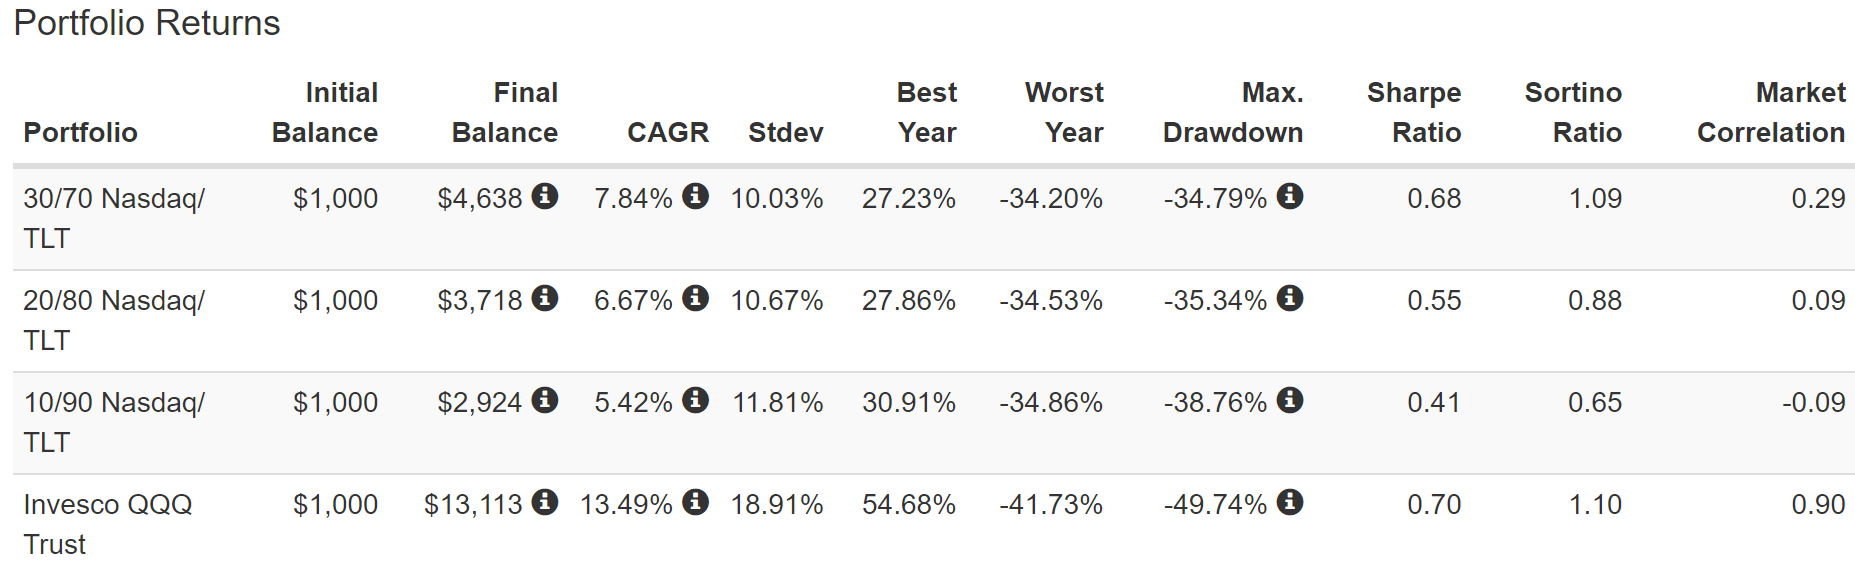
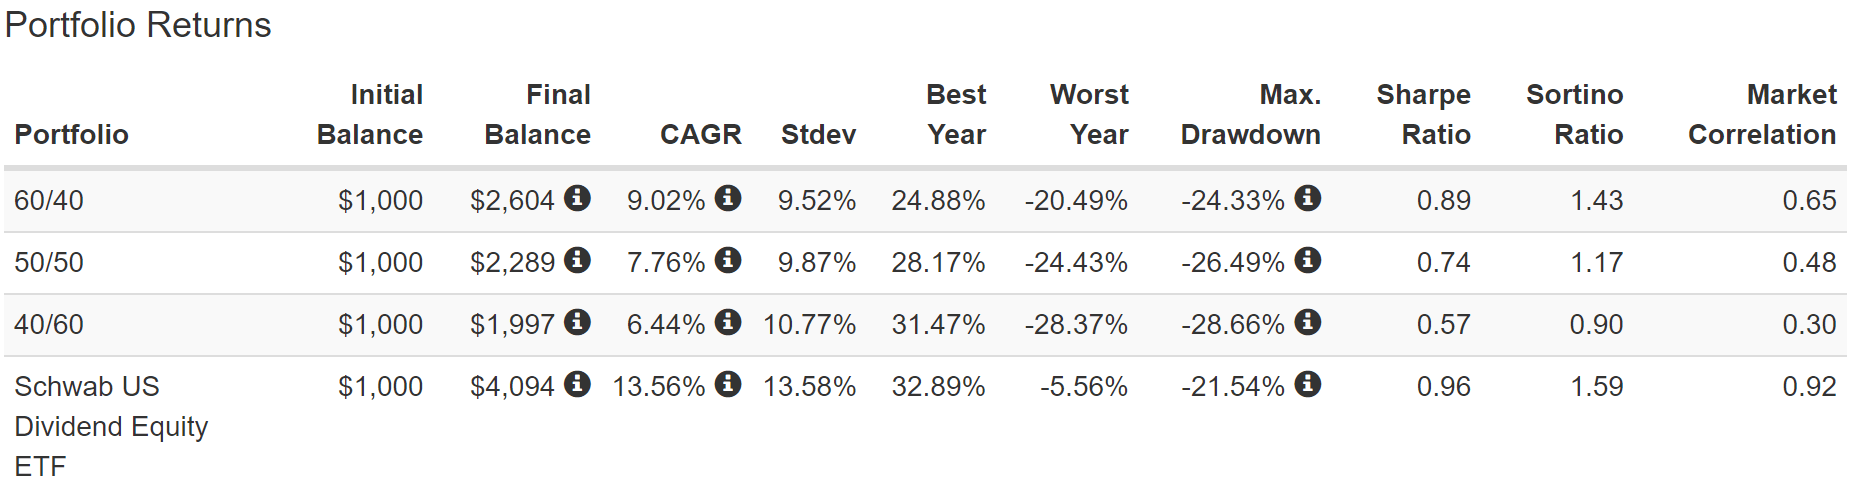
With the Nasdaq and TLT, 60/40 is the optimal allocation for maximizing the Sortino ratio.
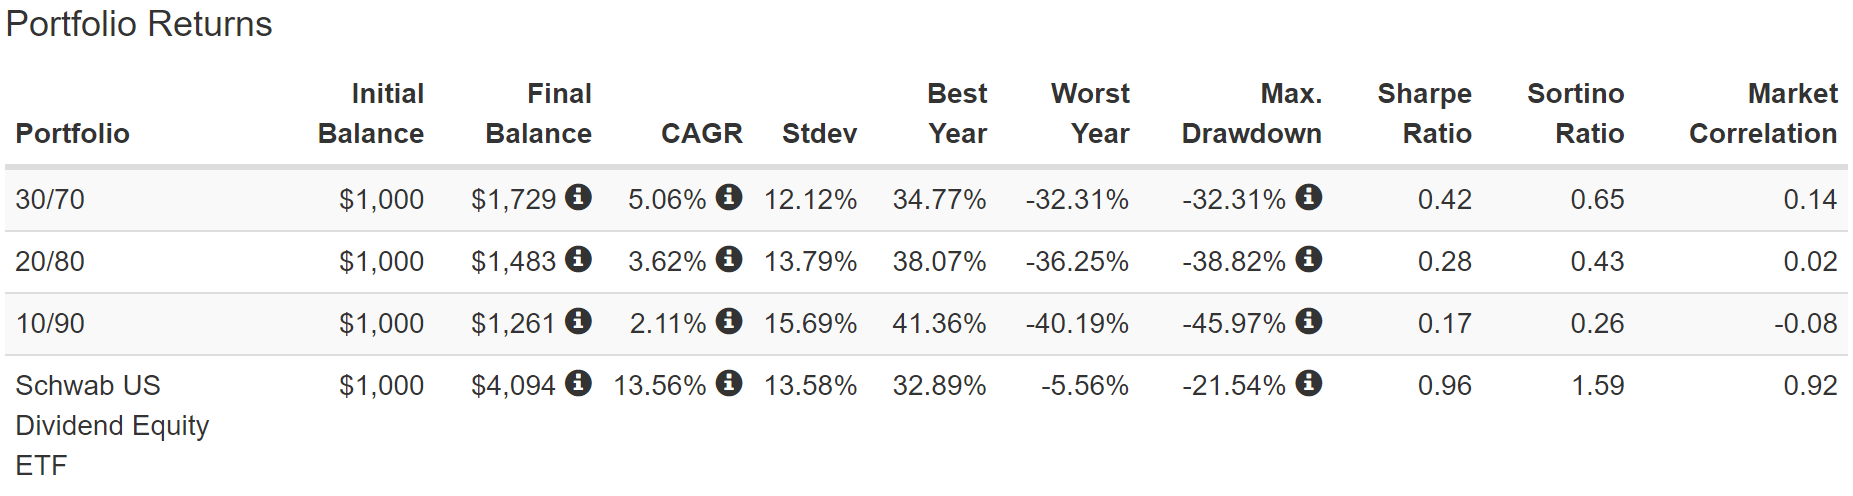
Long-duration bonds have volatility below the S&P 500 and 4% historical returns. The reason they work is their correction to the stock market is -0.22.
- if the S&P falls 20%, long bonds average a 4.4% gain.
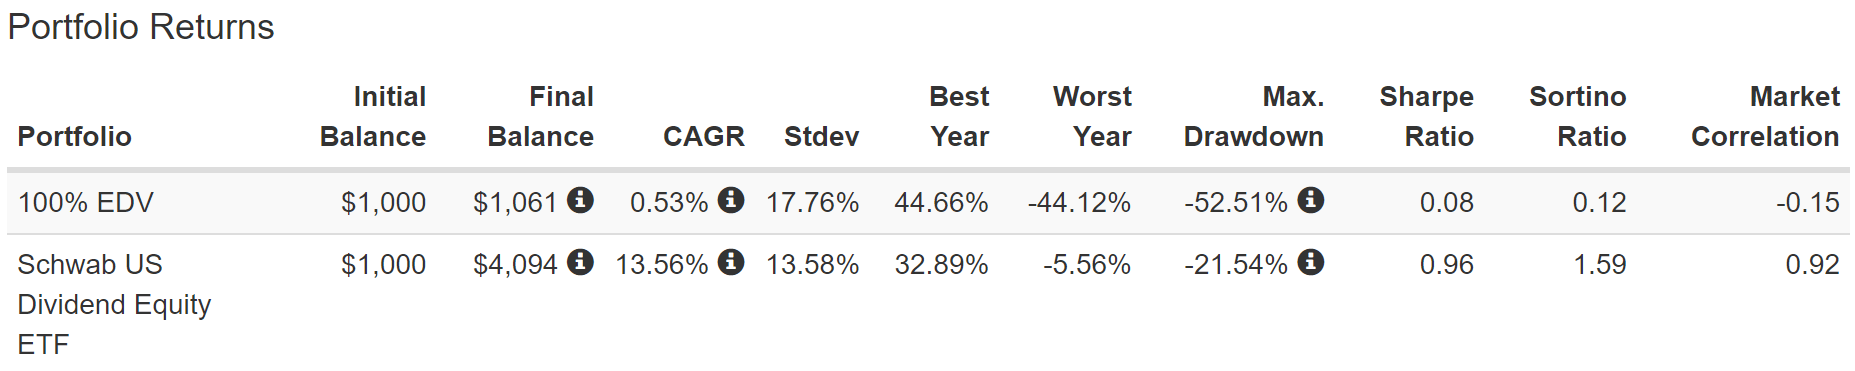
What about Schwab U.S. Dividend Equity ETF (SCHD) and Vanguard Extended Duration Treasury ETF (EDV)? My two favorite high-yield blue-chip ETFs and long-bond ETFs?
Total Returns Since November 2011
Because of the worst bond bear market in history in 2022, anyone owning 100% EDV would have had a rough decade. The only saving grace for EDV is that it is highly negatively correlated to the stock market.
- So it's been soaring during bear markets other than this stagflationary one.
Managed futures are also negatively correlated to stocks (bonds, too).
When stocks fall, they tend to go up, including during stagflation.
| Crisis Period |
| US Stocks |
| Bonds |
| Long Bonds |
| Cash |
| SG Trend Index |
| RSBT |
| DBMF |
| KMLM |
| December 2021 to September 2022 |
| -25% |
| -14.4% |
| -37.3% |
| 0.6% |
| 35.6% |
| 28.7% |
| 31.6% |
| 44.8% |
| January 2020 to March 2020 |
| -20% |
| -2.6% |
| 16.9% |
| 0.3% |
| 1.4% |
| 0.3% |
| -0.8% |
| 13.9% |
| October 2007 to February 2009 |
| -50% |
| 6.1% |
| 20.0% |
| 2.5% |
| 21.6% |
| 25.9% |
| 13.5% |
| 37.4% |
| August 2000 to December 2002 |
| -41% |
| 33.4% |
| 124.7% |
| 11.2% |
| 56.3% |
| 78.6% |
| 28.8% |
| 30.4% |
| Average |
| -34% |
| 5.6% |
| 31.1% |
| 3.6% |
| 28.7% |
| 33.4% |
| 18.3% |
| 31.6% |
(Sources: Soc Gen, Krane Shares, Charlie Bilello, Ycharts.)
When bonds fail (8% of the time), managed futures pick up the slack.
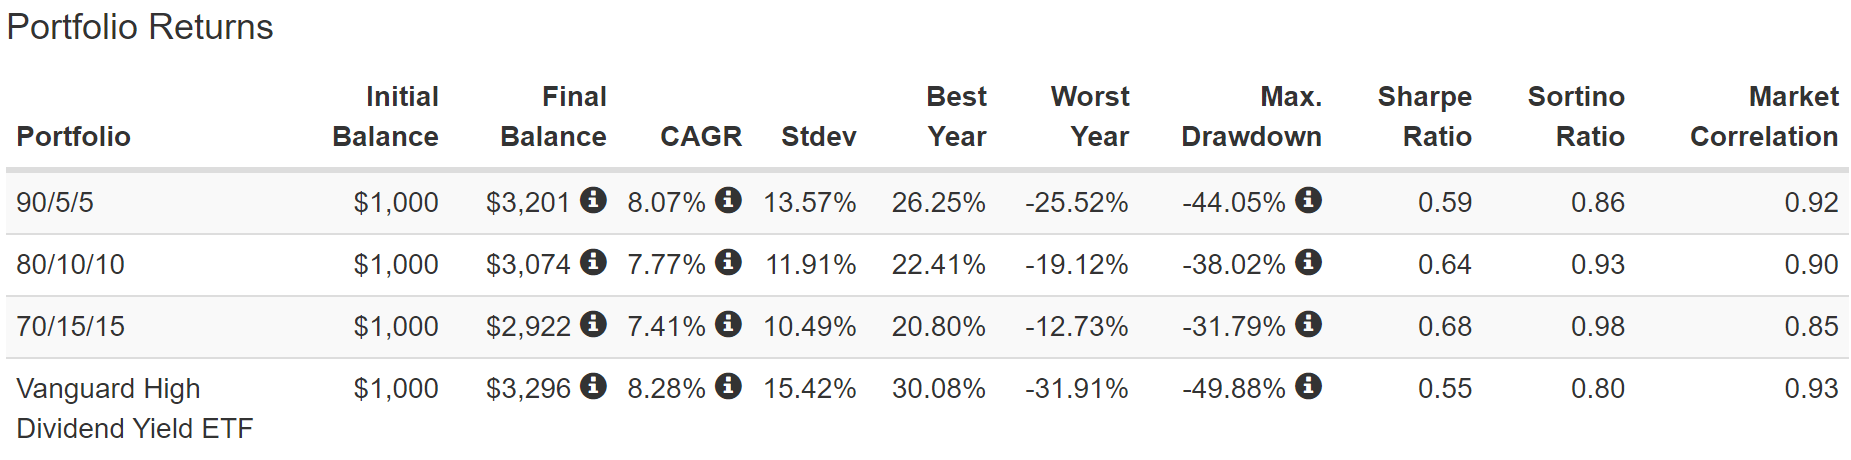
So, let's see what happens if we build a portfolio around:
- VYM (high-yield blue chips)
- half the hedging allocation into long bonds ( EDV )
- half into managed futures (DBMF, GIFMX, PQTAX, or AMFAX).
Total Returns Since December 2007 (Including The Great Recession)
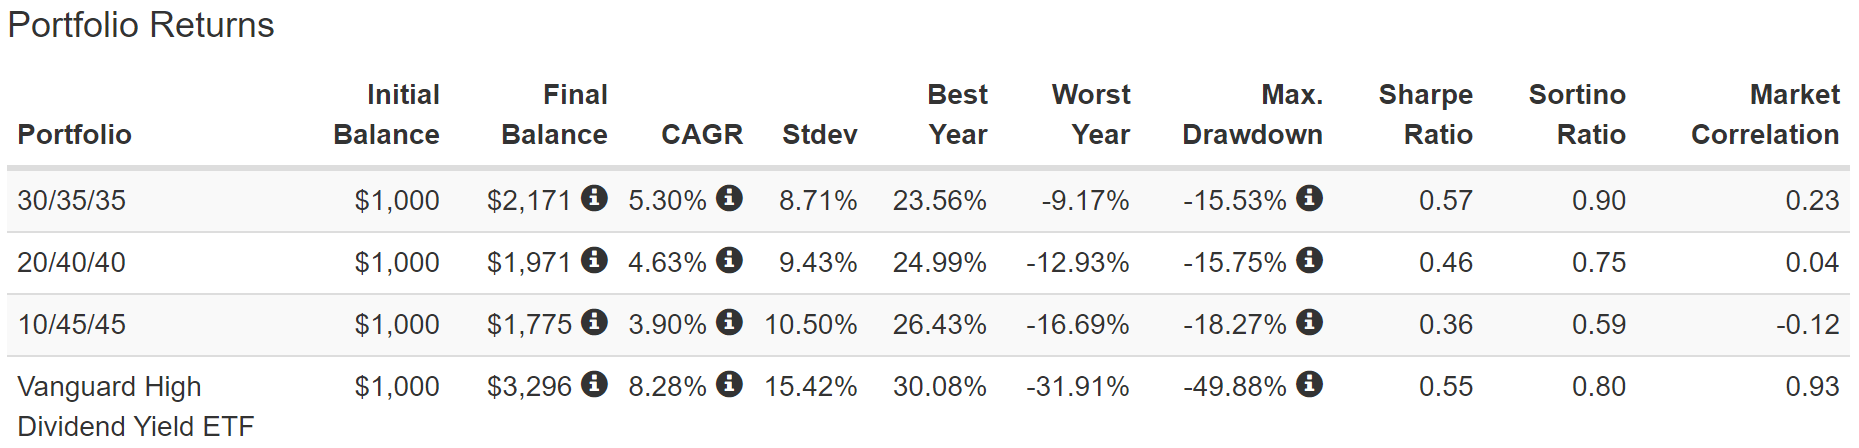
Notice how a 50/50 mix of long bonds and managed futures correlates more negatively than long bonds or managed futures on their own.
- very low volatility
- smaller peak decline
- the best Sortino ratio.
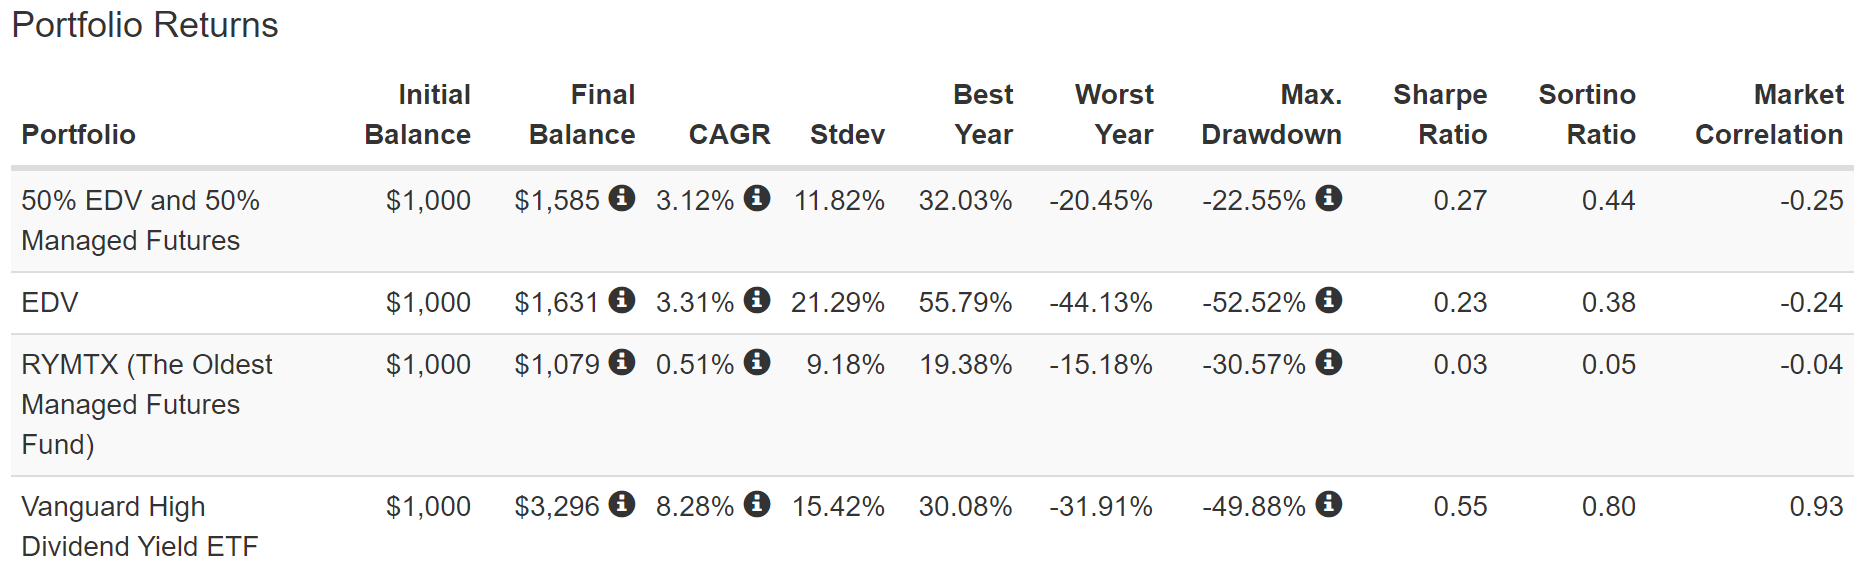
RYMTX is the oldest managed futures ETF.
- 2-star rated from Morningstar
- DO NOT BUY IT.
Managed futures and bonds are non-correlated, and that's why combining them together results in the best hedging combination I've ever seen.
Key Takeaways:
- your optimal recession asset allocation will depend on what you want to own
- which depends on your goals (what kind of yield and returns do you need).
The Dividend Kings ZEUS Strategy: The King Of SWAN Retirement Portfolios
The goal of asset allocation rules of thumb is to provide a strategy that works most of the time and never catastrophically fails.
- easy to remember
- easy to rebalance annually.
I created the ZEUS long-term optimized retirement portfolio strategy to help:
- maximize safe yield
- maximize long-term returns
- and minimize volatility
- especially peak declines during bear markets and crashes.
ZEUS = Zen Extraordinary Ultra SWAN portfolio strategy, and this is what it looks like.
- 33% stocks ETFs
- Preparing For Recession Part 25: Introducing The DK Great ETF/CEF Database
- 33% hedges (bonds, managed futures, cash, and alternatives)
- 33% individual blue-chips.
With this strategy, your long-term fundamental risk is effectively zero.
- blue-chip indexes and bonds can't go to zero
- so it's impossible to lose all your money with a ZEUS portfolio.
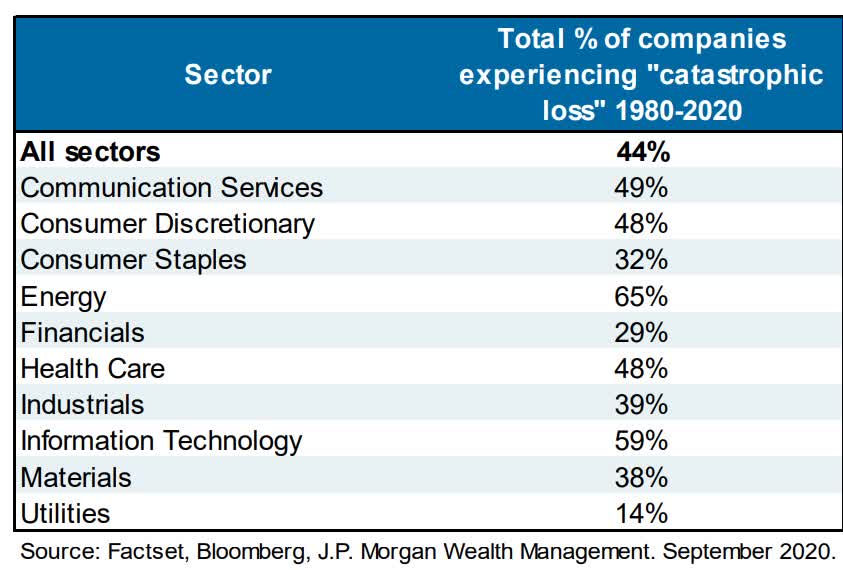
Only 33% of your portfolio in individual blue chips can go to zero, and if you own a diversified blue-chip bucket, then the fundamental risk also falls effectively to zero.
Owning ETFs, hedges, and individual stocks eliminates the risk of a few high-conviction companies imploding.
- General Electric (GE) was once a dividend aristocrat and the most valuable company on earth
- CenturyLink - now Lumen Technologies (LUMN) - was a dividend aristocrat and has cut its dividend three times in a decade and fallen 85% (it suspended its dividend permanently)
- K-Mart and Winn-Dixie were aristocrats that went bankrupt
- AT&T (T) is a failed aristocrat and value trap due to terrible management decisions for over a decade
The DK Zen Strategy is 50% ETFs and 50% individual blue-chips and similarly eliminates fundamental risk.
The difference between Zen and ZEUS is hedging.
Dividend Kings ZEUS Income Growth: My $2.2 Million Family Hedge Fund
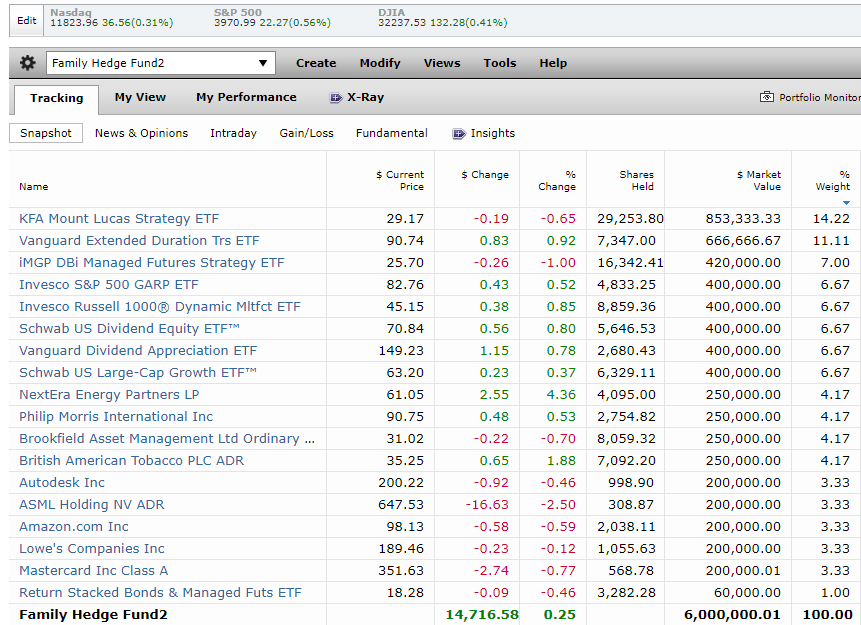
Here is what my family hedge fund is working towards in the future.
However, due to complex medical financial issues for my family, we can't afford this exact portfolio right now.
- this is what I'd buy immediately if we had a big slug of cash come in.
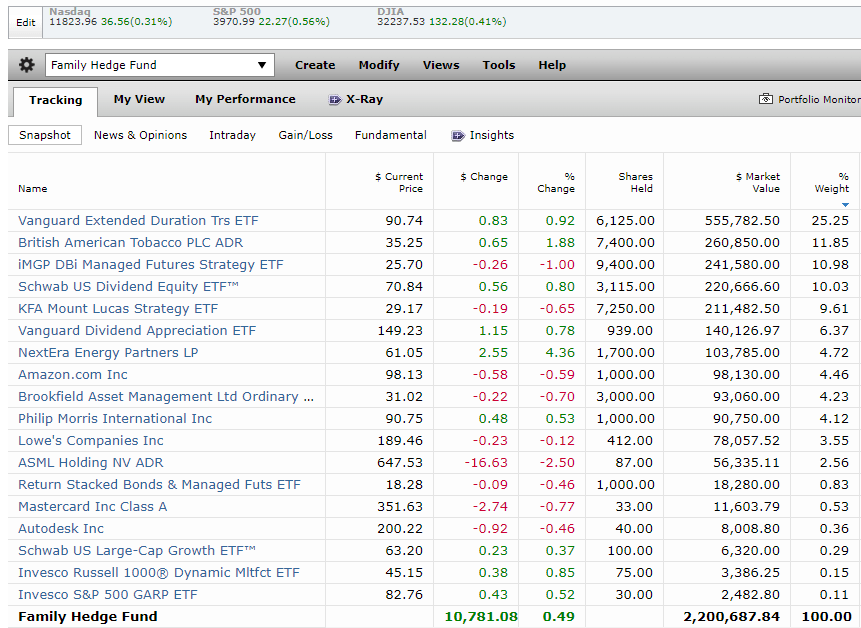
So this is what our family hedge fund looks like today.
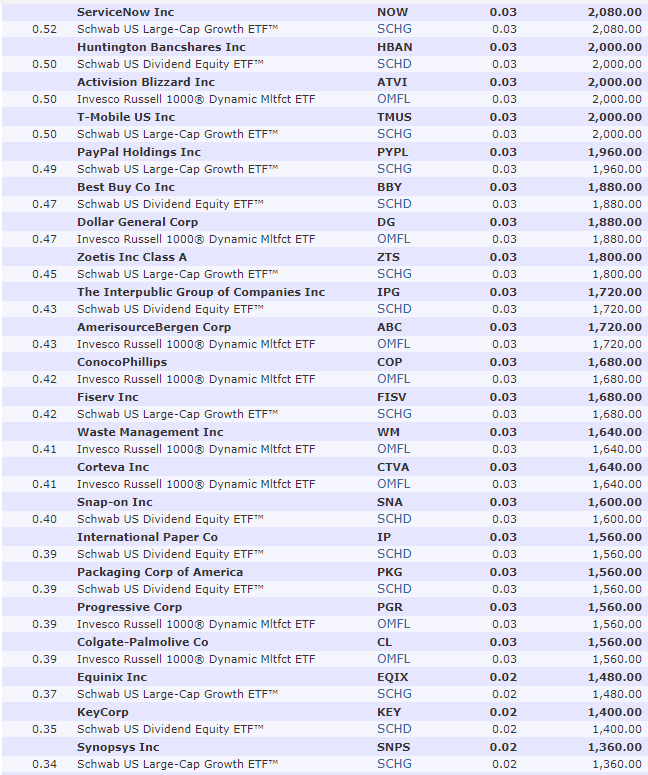
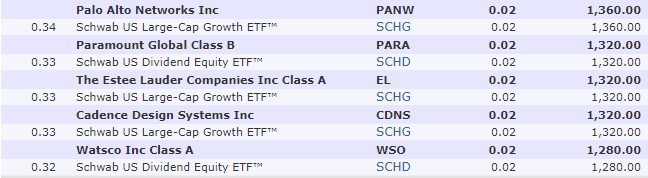
Here are the 18 stocks into which I've invested my life savings, including links to articles explaining why I own all of them.
- Vanguard Extended Duration Treasury ETF ( EDV )
- British American Tobacco ( BTI )
- Dynamic Beta Managed Futures ETF ( DBMF )
- Schwab US Dividend Equity ETF ( SCHD )
- KraneShares Mount Lucas Strategy ETF ( KMLM )
- Vanguard Dividend Appreciation ETF ( VIG )
- NextEra Energy Partners ( NEP )
- Amazon ( AMZN )
- Brookfield Asset Management ( BAM )
- Philip Morris International ( PM )
- Lowe's ( LOW )
- ASML Holding ( ASML )
- Return Stacked Bonds & Managed Futures ETF ( RSBT )
- Mastercard ( MA )
- Autodesk ( ADSK )
- Schwab US Large Cap Growth ETF ( SCHG )
- Invesco Russell 1000 Dynamic Multifactor ETF ( OMFL )
- Invesco S&P Growth At A Reasonable Price ETF ( SPGP ).
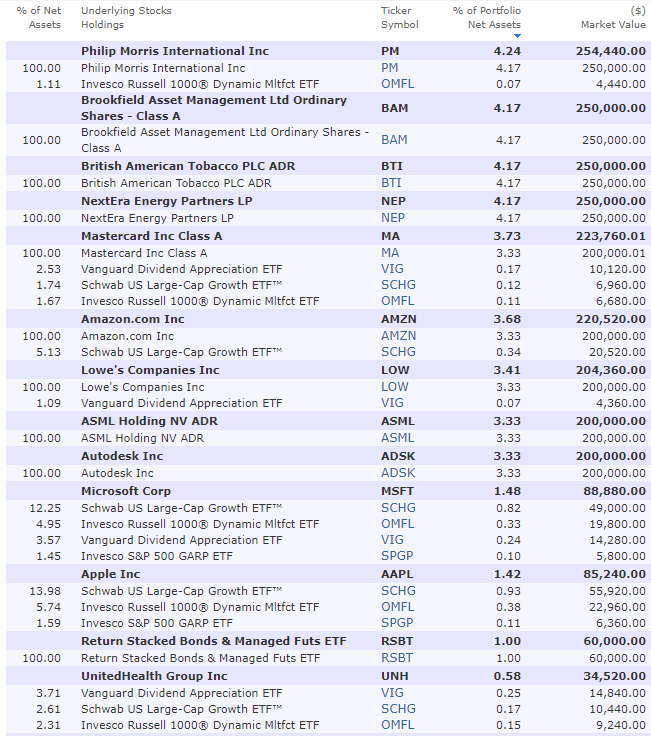
Here's an analysis of what the final hedge fund will look like once it's completed.
- it will take approximately $6 million to complete it
- 2 to 4 years depending on what bonds do in the coming recession and how my business goes.
What My Family's Hedge Will Look Like When Finished
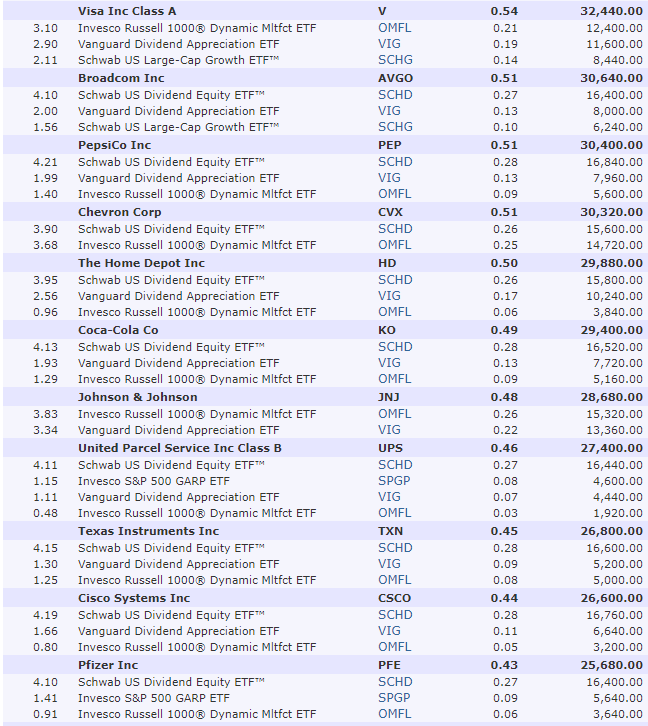
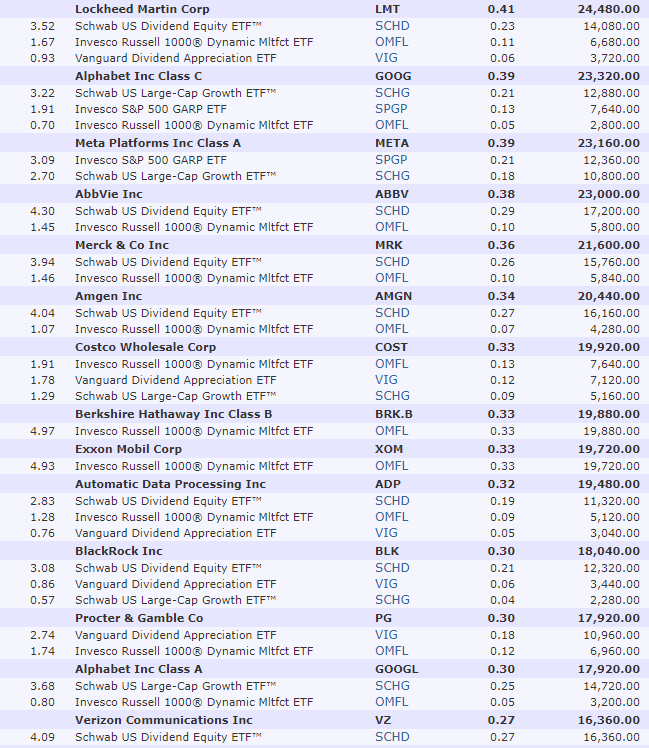
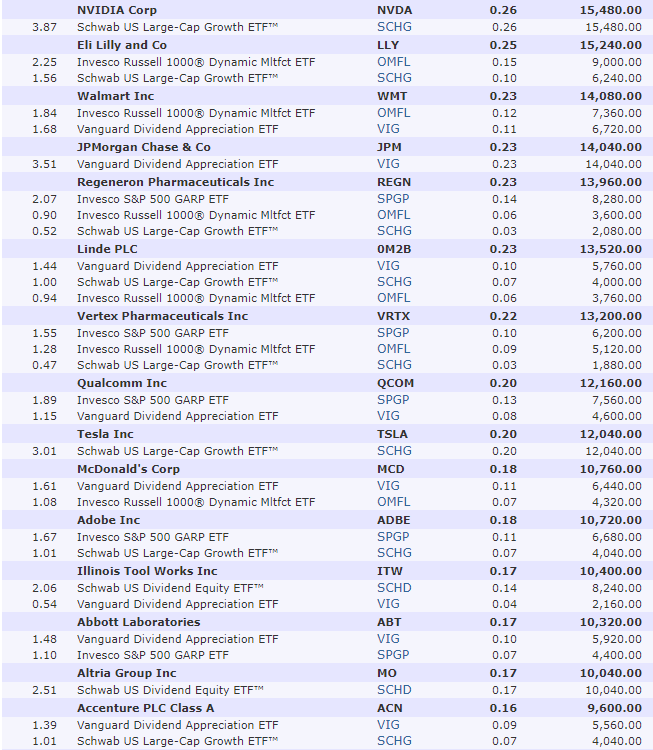
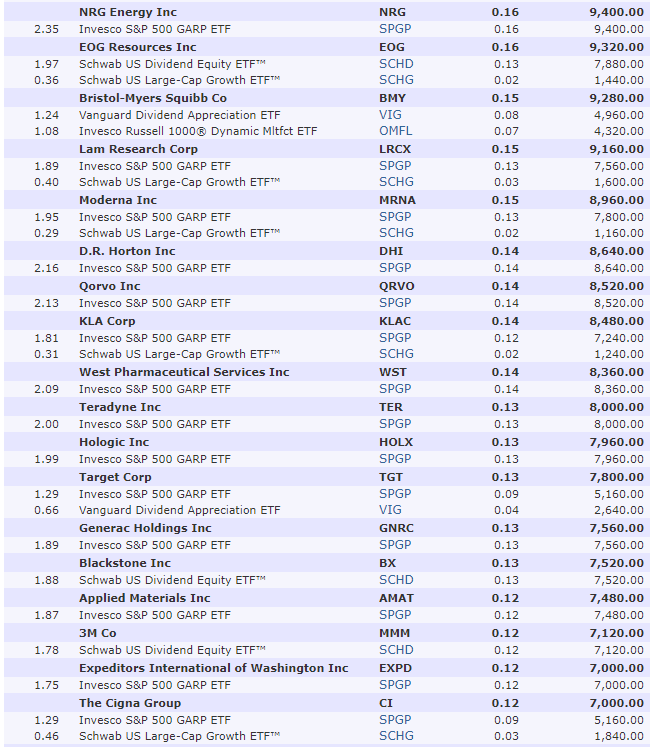
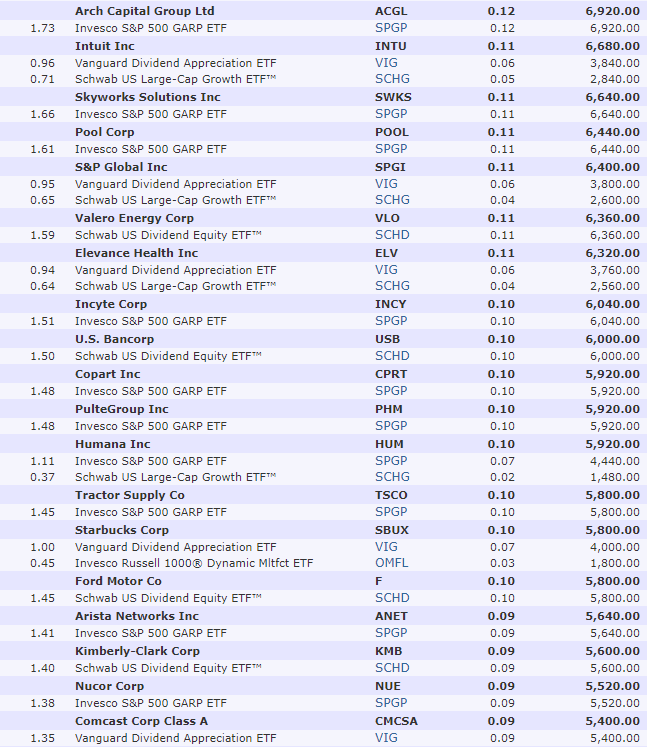
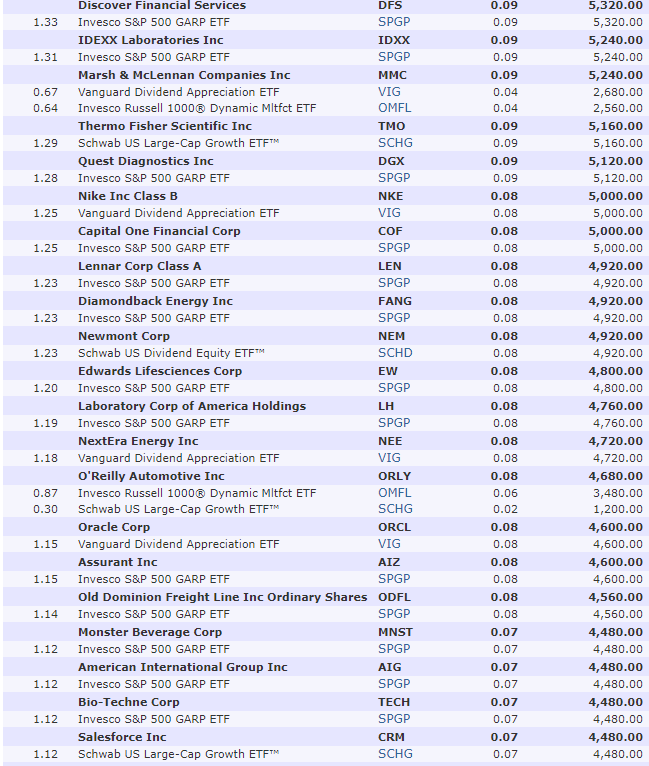
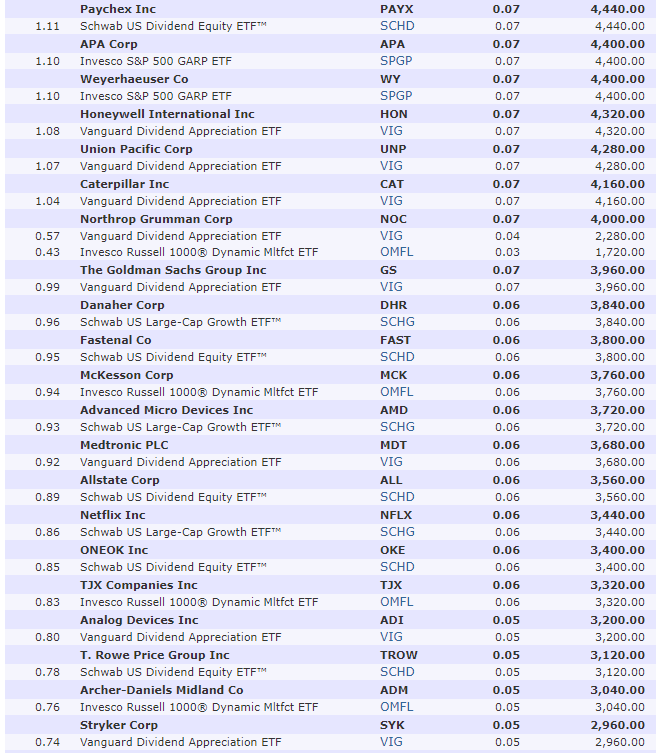
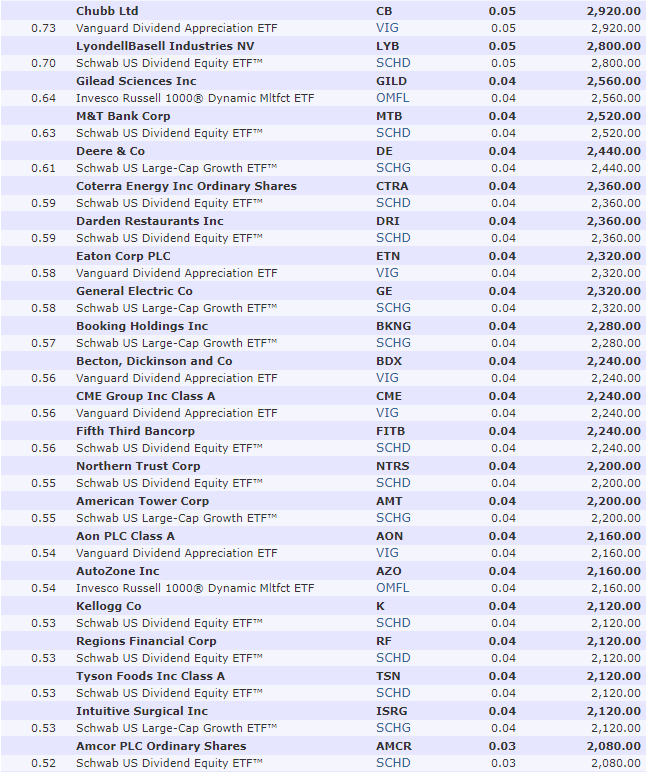
950 Of The World's Best Blue-Chips (And Just 1 Hour Per Year To Manage Them All)
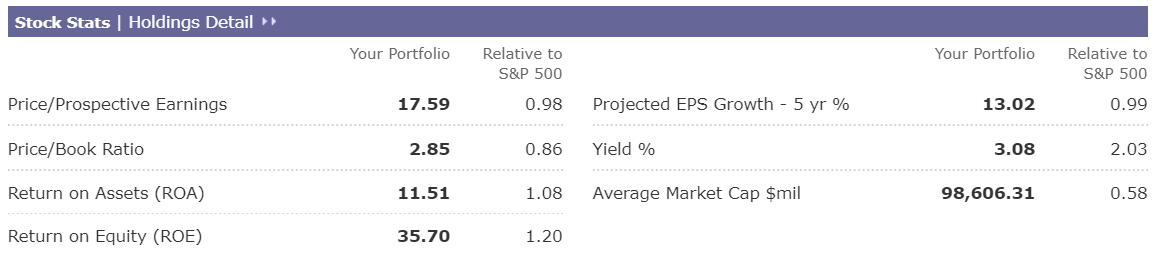
What do the fundamentals of the DK ZEUS Income Growth portfolio look like?
Morningstar
Currently, the managed futures are canceling the bonds, but that will change within two months.
Morningstar
It's 82% large caps and 16% small and midcaps.
Morningstar
Exposure to every part of the global economy.
Perfectly balanced between 33% value, 33% growth, and 33% core, and defensive, cyclical, and economically sensitive allocations.
Morningstar
Exposure to every part of the economy. These 950 companies have all 8 billion people on earth as customers.
Morningstar estimates this portfolio is about 13% undervalued trading at 17.6X earnings.
- historical fair value: 20.3X earnings.
Its quality is superior to the market's, as seen by higher profitability.
Morningstar expects 16.1% long-term returns, about 2% higher than FactSet's consensus forecast.
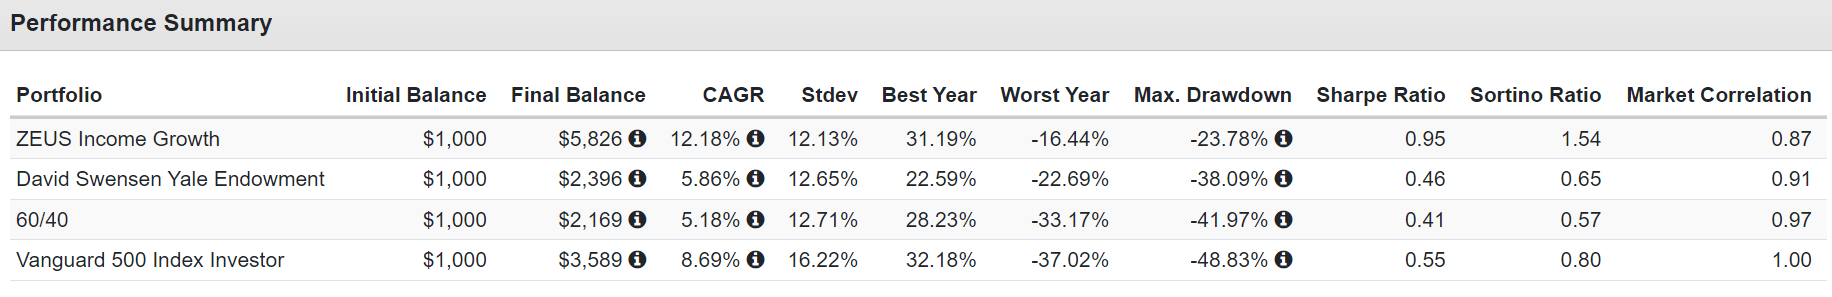
Historical Returns Since December 2007
Double the returns of a 60/40 and hedge funds like the Yale Endowment.
The same low annual volatility but far smaller bear market declines, even in the Great Recession.
3X the negative-volatility-adjusted returns (Sortino) of the 60/40 and with twice the yield.
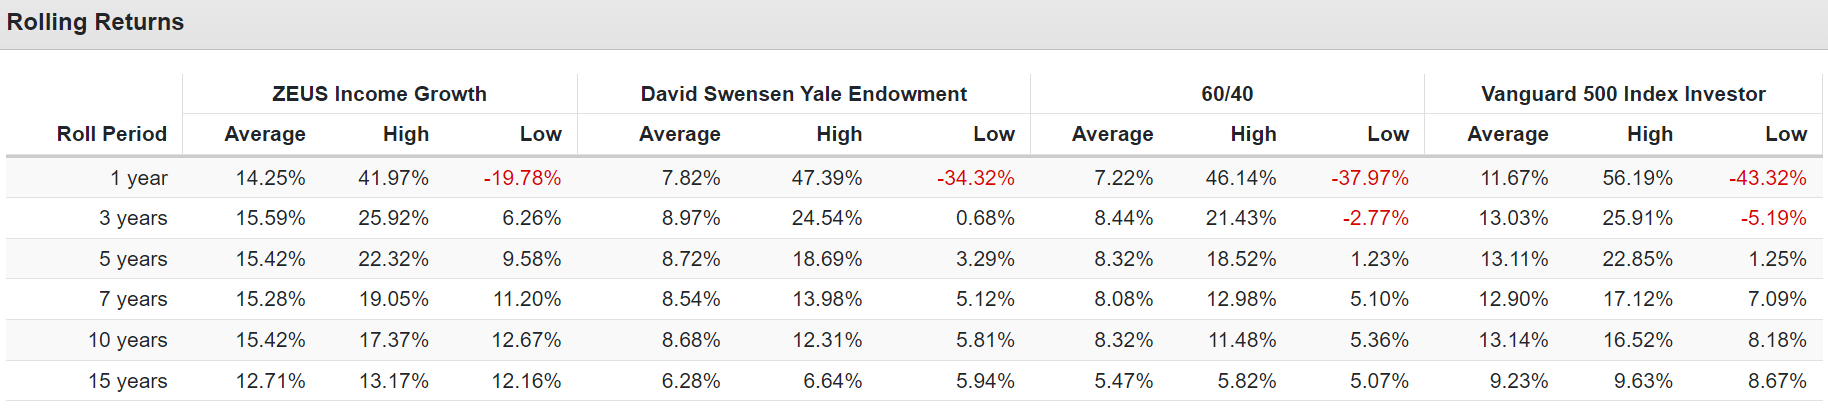
The average 12-month rolling return was 14.2%, just like analysts expect in the future.
That's better returns than the S&P, even during a face-ripping tech bubble.
Riding Over The Market's Worst Potholes In A Rolls Royce Portfolio
| Bear Market |
| ZEUS Income Growth Peak Decline |
| 60/40 Peak Decline |
| S&P Peak Decline |
| Nasdaq Peak Decline |
| 2022 Stagflation |
| -11% |
| -21% |
| -28% |
| -35% |
| Pandemic Crash |
| -10% |
| -13% |
| -34% |
| -13% |
| 2018 Recession Scare |
| -13% |
| -9% |
| -21% |
| -17% |
| 2011 Debt Ceiling Crisis |
| -1% |
| -16% |
| -22% |
| -11% |
| Great Recession |
| -24% |
| -44% |
| -58% |
| -59% |
| Average |
| -12% |
| -21% |
| -33% |
| -27% |
| Median |
| -11% |
| -16% |
| -28% |
| -17% |
(Source: DK Research Terminal.)
How about 2X the yield of a 60/40, with better returns than the S&P, and bear market declines that are 66% lower than the market's?
That's the power of ZEUS.
75-Year Monte Carlo: Stress Testing The Future
Every registered investment advisor, including Ritholtz Wealth Management, uses some version of Monte Carlo simulations when doing retirement planning." - Ben Carlson.
- long-term Monte Carlo simulation uses statistics and past historical returns, and volatility data to run thousands of simulations about what's likely to happen in the future
- as long as the future isn't more extreme than the last 15 years, this is the best way to estimate the probability of likely return ranges, volatility, and the probability of achieving your investment goals.
The last 15 years have seen:
- the two worst recessions since the Great Depression
- the 2nd worst market crash in history
- the fastest bear market in history
- the strongest 12-month rally-month history (100%)
- inflation ranging from -3% to 9%
- 10-year treasury bond yields ranging from 0.5% to 5%
- Fed funds rate from 0% to 4.25%.
Unless you think the future will be more extreme than this, 10,000 75-year Monte Carlo simulation is statistically the best way to forecast the likely future.
- a 75-year time horizon provides more extreme ranges of potential outcomes
- the ultimate stress test for a "forever portfolio."
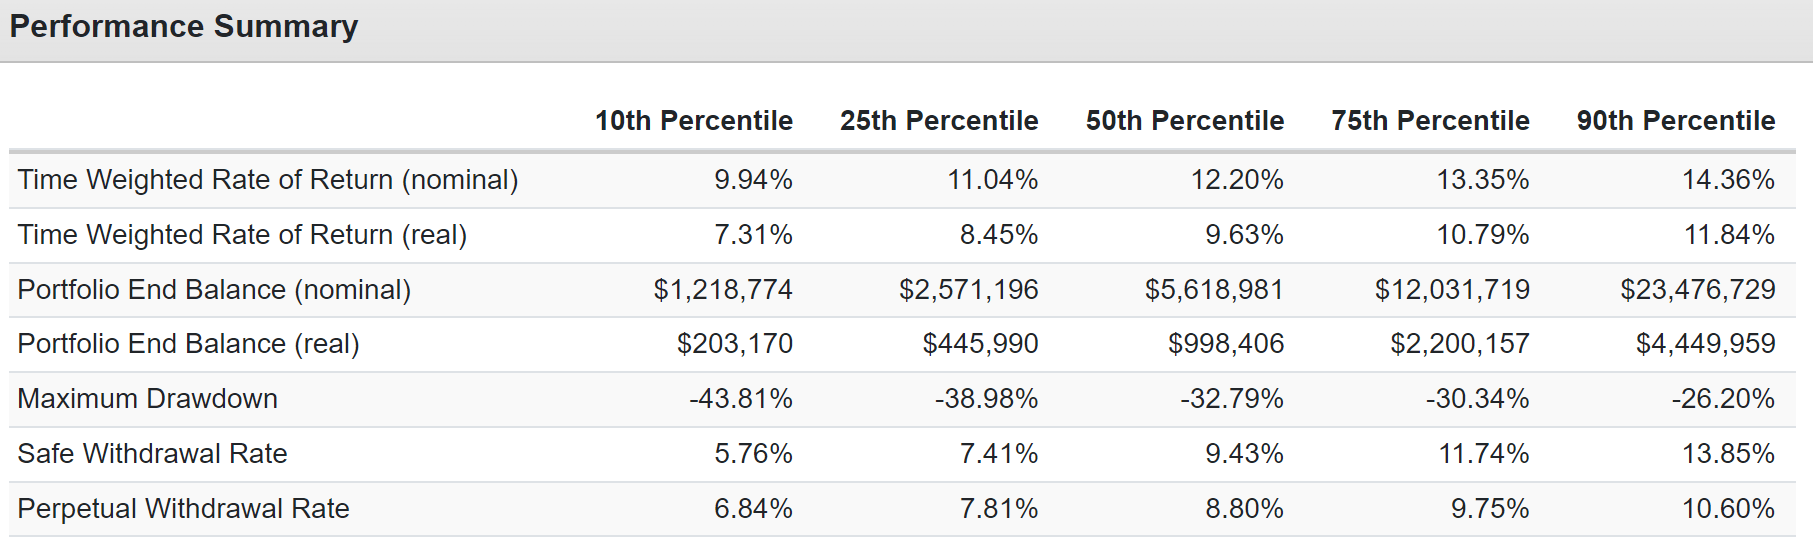
90% probability of 7.3%+ inflation-adjusted returns, with a base-case of 12.2% returns and 9.6% after inflation.
60/40's historical return is 7.4%, and that's what analysts expect in the future. The S&P's historical return is 10%, and what analysts expect in the future.
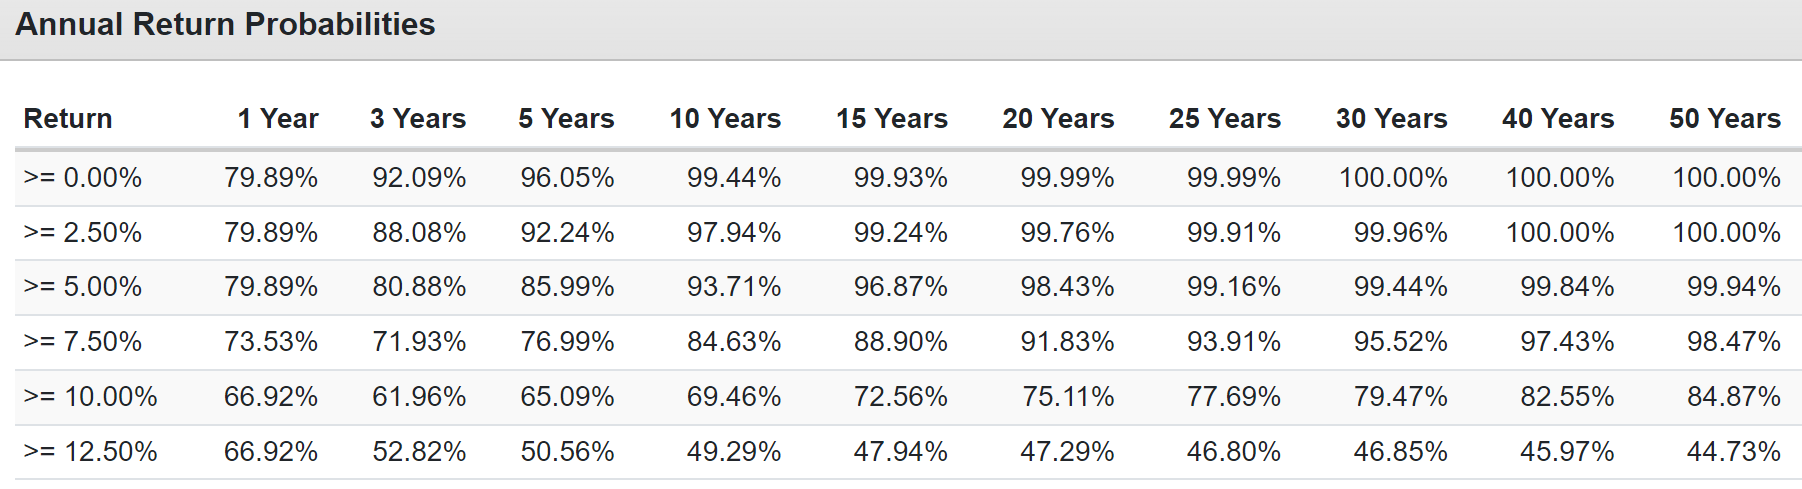
The statistical probability of ZEUS beating a 60/40 over the next 50 years is 98.47%. The probability of beating the S&P is 84.87%.
- There are no guarantees on Wall Street, but this is as close as you'll ever come.
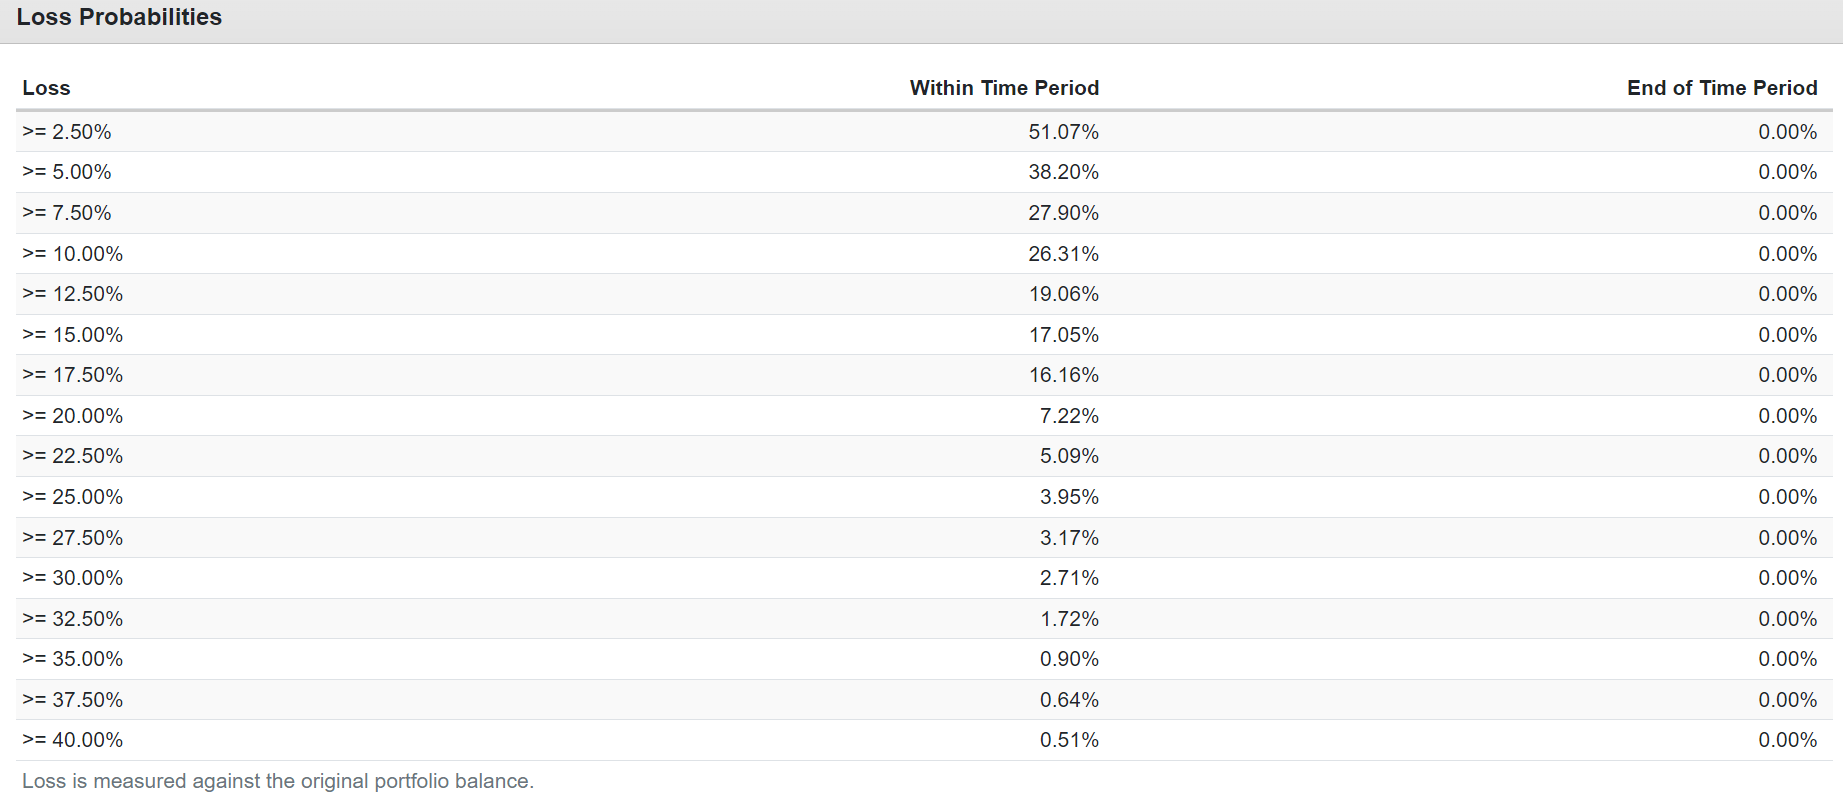
The 60/40's peak decline during the Great Recession was -44%.
| Bear Market Severity |
| Statistical Probability Over 75 Years |
| 1 In X Probability |
| Expected Every X Years |
| S&P More Likely To Suffer X% Decline In Any Given Year |
| 20+% |
| 7.22% |
| 14 |
| 1,039 |
| 173 |
| 25+% |
| 3.95% |
| 25 |
| 1,899 |
| 30+% |
| 2.71% |
| 37 |
| 2,768 |
| 35+% |
| 0.90% |
| 111 |
| 8,333 |
| 40+% |
| 0.51% |
| 196 |
| 14,706 |
| 294 |
As close to a bear market-proof portfolio as is possible to achieve on Wall Street.
ZEUS = riding over even the biggest market potholes in a Rolls Royce.
Bottom Line: These 18 World-Beater Blue Chips Build The Ultimate High-Yield Sleep Well At Night Income Growth Portfolio
With the right blue-chip assets, you can achieve something truly remarkable.
Great Yield, Great Returns, And Volatility So Low You'll Laugh At Bear Markets
| Bear Market |
| ZEUS Income Growth Peak Decline |
| 60/40 Peak Decline |
| S&P Peak Decline |
| Nasdaq Peak Decline |
| 2022 Stagflation |
| -11% |
| -21% |
| -28% |
| -35% |
| Pandemic Crash |
| -10% |
| -13% |
| -34% |
| -13% |
| 2018 Recession Scare |
| -13% |
| -9% |
| -21% |
| -17% |
| 2011 Debt Ceiling Crisis |
| -1% |
| -16% |
| -22% |
| -11% |
| Great Recession |
| -24% |
| -44% |
| -58% |
| -59% |
| Average |
| -12% |
| -21% |
| -33% |
| -27% |
| Median |
| -11% |
| -16% |
| -28% |
| -17% |
(Source: DK Research Terminal.)
I've spent eight years studying what works and what doesn't on Wall Street; the ZEUS Income Growth portfolio is the culmination of this never-ending R&D process.
Is this portfolio perfect for everyone? No, it's just perfect for my family's needs.
You can build a ZEUS portfolio for any goal, time horizon, or risk profile.
- ZEUS high-yield
- ZEUS value
- ZEUS growth
- ZEUS REITs
- ZEUS aristocrats
- ZEUS high-yield aristocrats
- ZEUS monthly income
- ZEUS foreign stocks.
There are infinite combinations of ZEUS portfolios for anyone looking for great returns and ultra-low volatility during bear markets.
If you don't care about volatility? Then take out the hedges and just use a Zen strategy combining ETFs and the world's best blue-chips.
If you want optimal yield or the best possible returns? Then you can build a 20 stock blue-chip portfolio with the optimal fundamentals for your needs and goals.
The point is that you become an emperor when you trust the world's best blue-chip assets.
For further details see:
18 World-Beater Blue Chips For The Ultimate High-Yield Retirement Portfolio