CHMI - 19% Dividend Yields And Big Short Interest
2023-04-27 18:08:49 ET
Summary
- Two stocks to drop. Frequent losers. Shareholder value keeps falling.
- A history of dividend reductions goes along with the declining price.
- There are better choices available than grasping for this yield.
Get ready for charts, images, and tables because they are better than words. The ratings and outlooks we highlight here come after Scott Kennedy's weekly updates in the REIT Forum. Your continued feedback is greatly appreciated, so please leave a comment with suggestions.
We're starting with bad choices.
First REIT
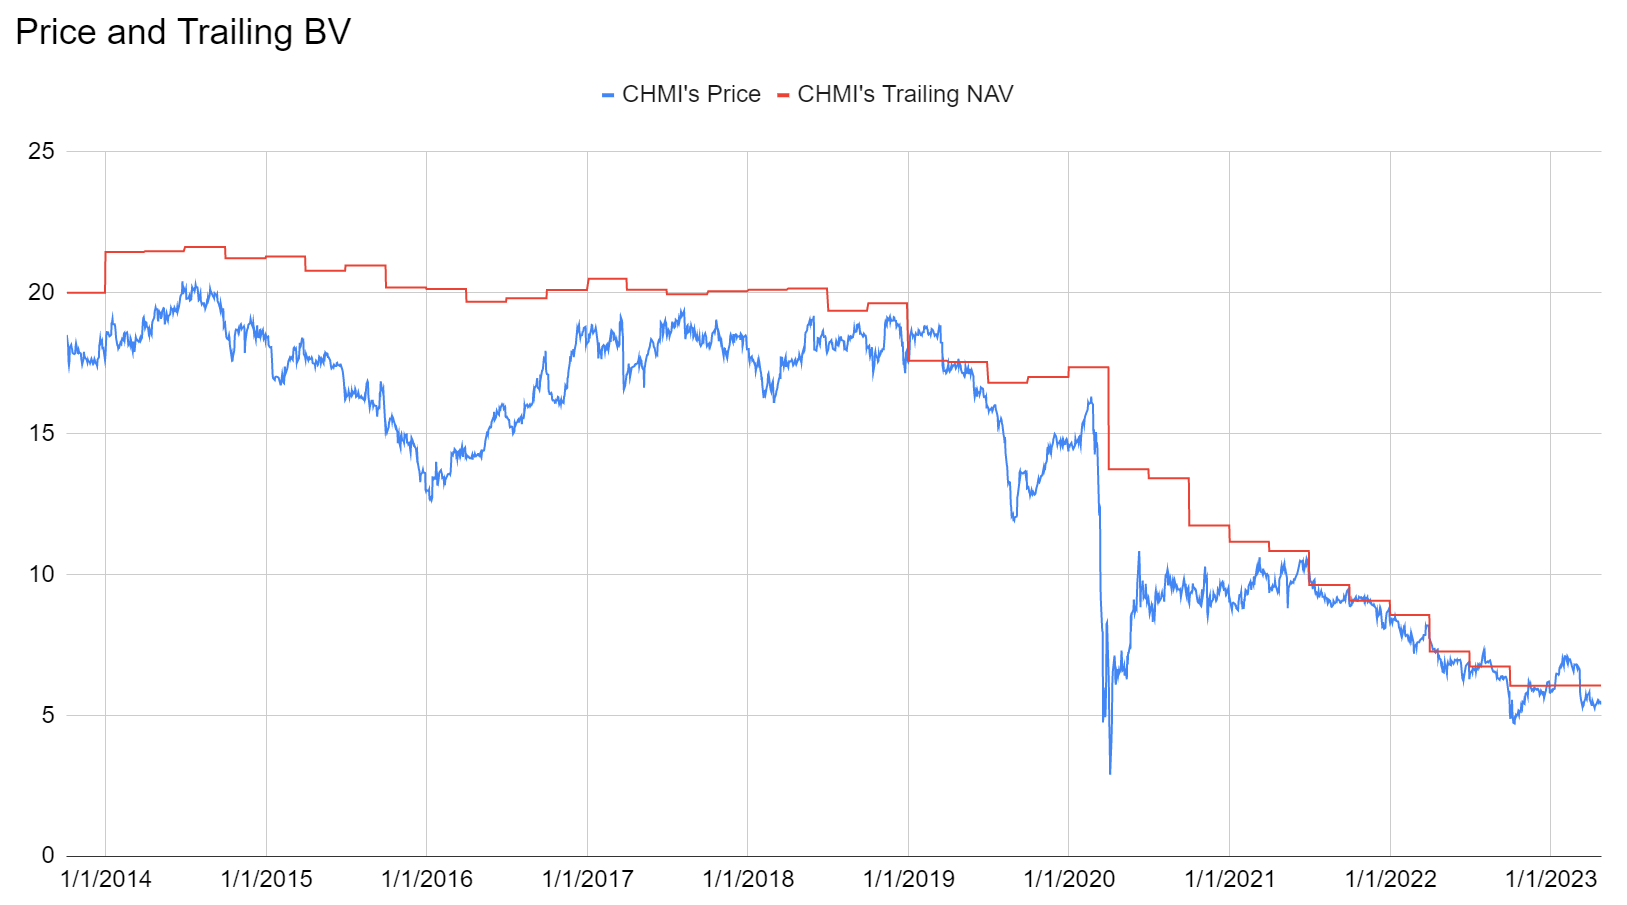
Cherry Hill Mortgage ( CHMI ) lands in the list of bad choices today. They've done that several times. It might be a habit at this point, but it hasn't been as consistent as book value losses:
That chart uses the trailing book value, but we don't have a Q1 2023 book value yet. Consequently, the trailing book value at the moment is still from 12/31/2022. Do you think book value moved up or down in Q1 2023? We're predicting down. In fact, we suspect the book value as of last Friday was probably pretty close to today's share price of $5.52. That's a bit lower than our projection for the end of Q1 2023.
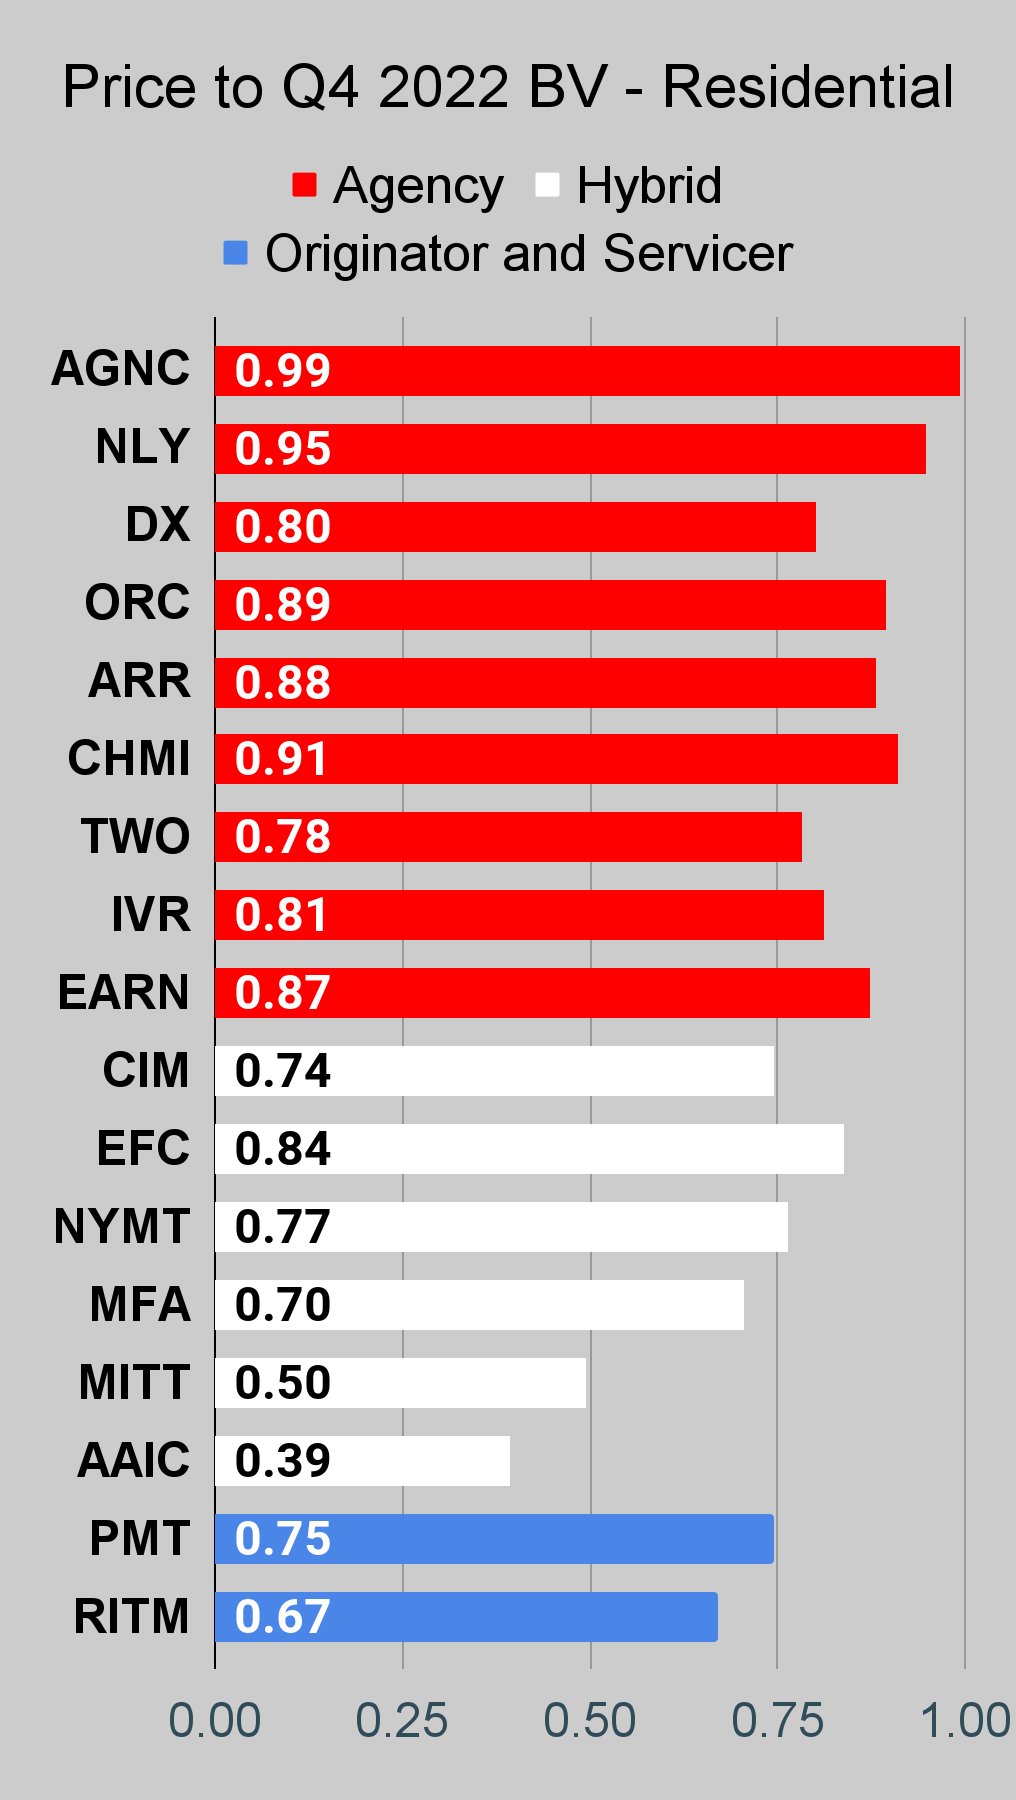
What I find remarkable is that CHMI trades very close to book value. We see Ellington Financial ( EFC ) at .88, Rithm Capital Corp. ( RITM ) at .71, and PennyMac Mortgage Investment Trust ( PMT ) at .79, just to name a few. Those ratios are also based on BV estimates as of 4/21/2023. Since the charts use reported book value from 12/31/2022, those ratios won't quite match.
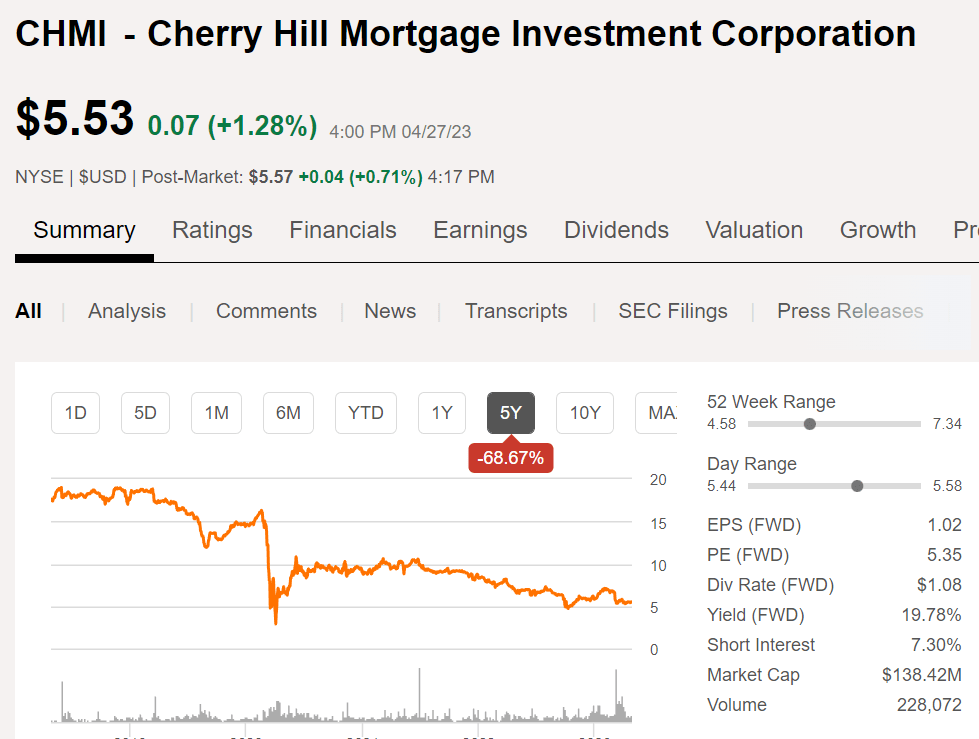
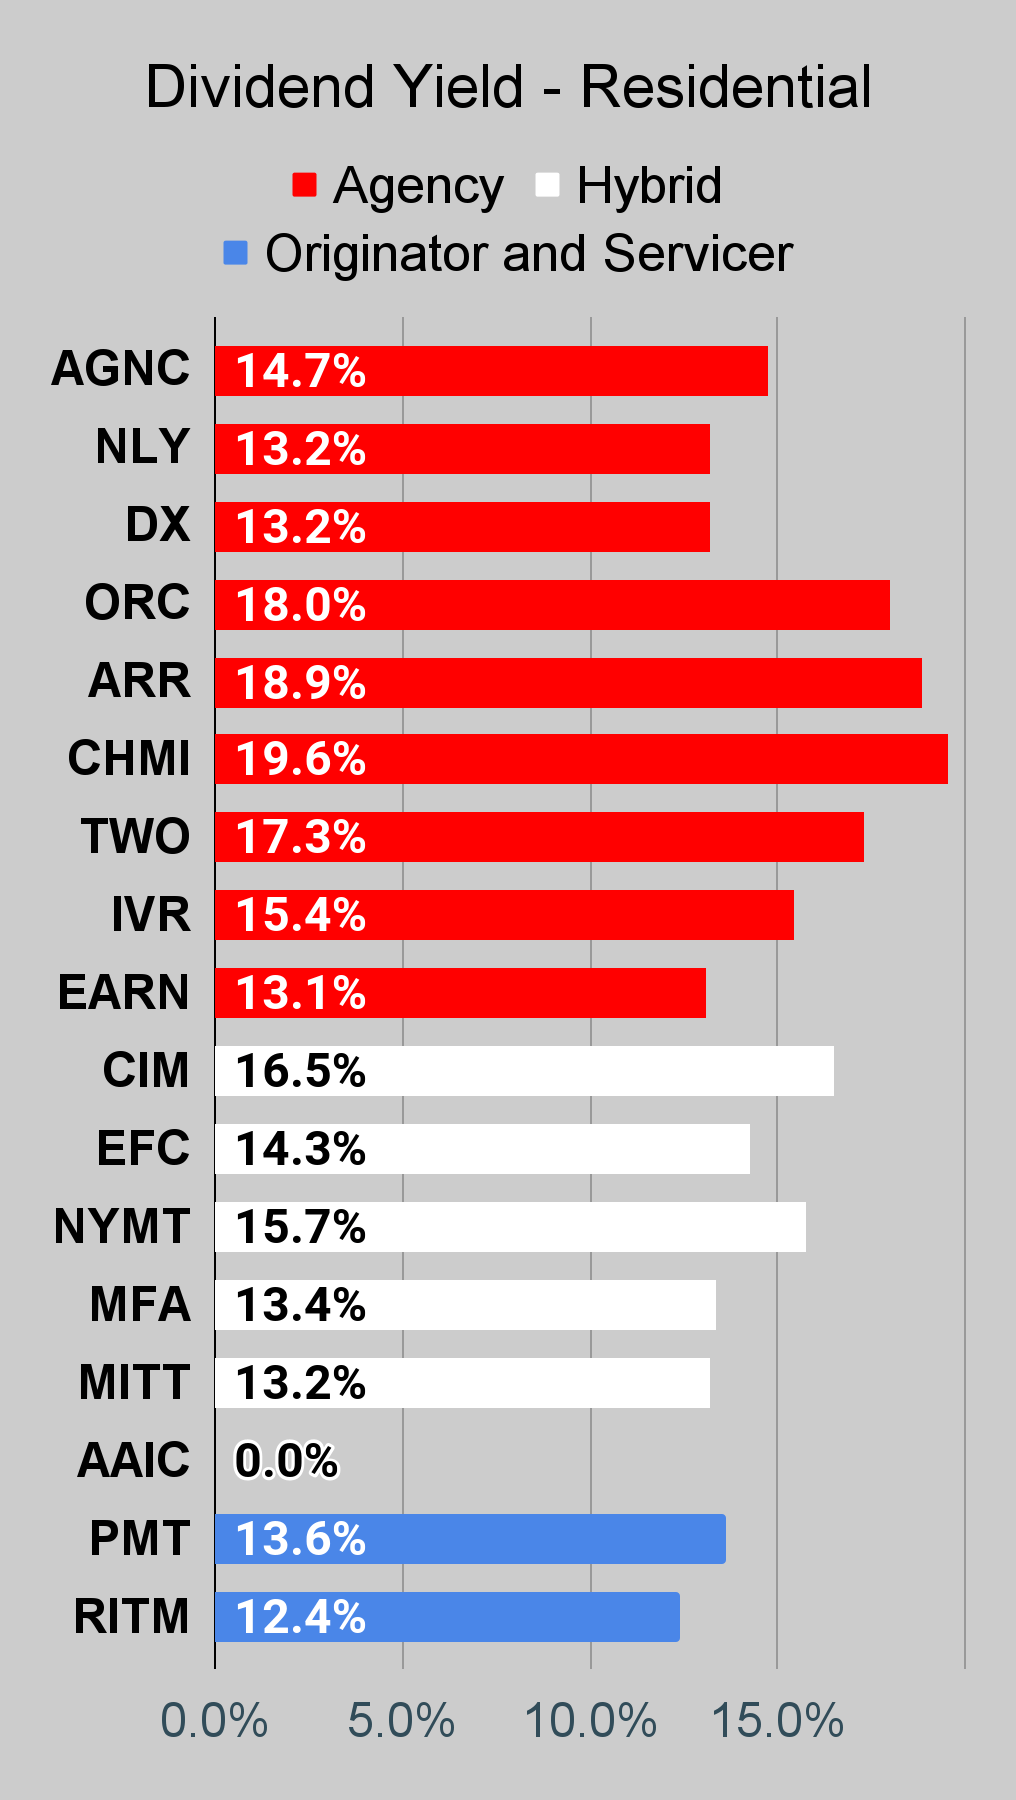
But hey, CHMI has a massive "dividend yield." It's over 19%! I hesitate to call that a "forward dividend yield" though. Seeking Alpha reports a 7.3% short interest in CHMI:
I doubt those investors are furious about paying out the dividend since book value per share has decreased so much.
Second REIT
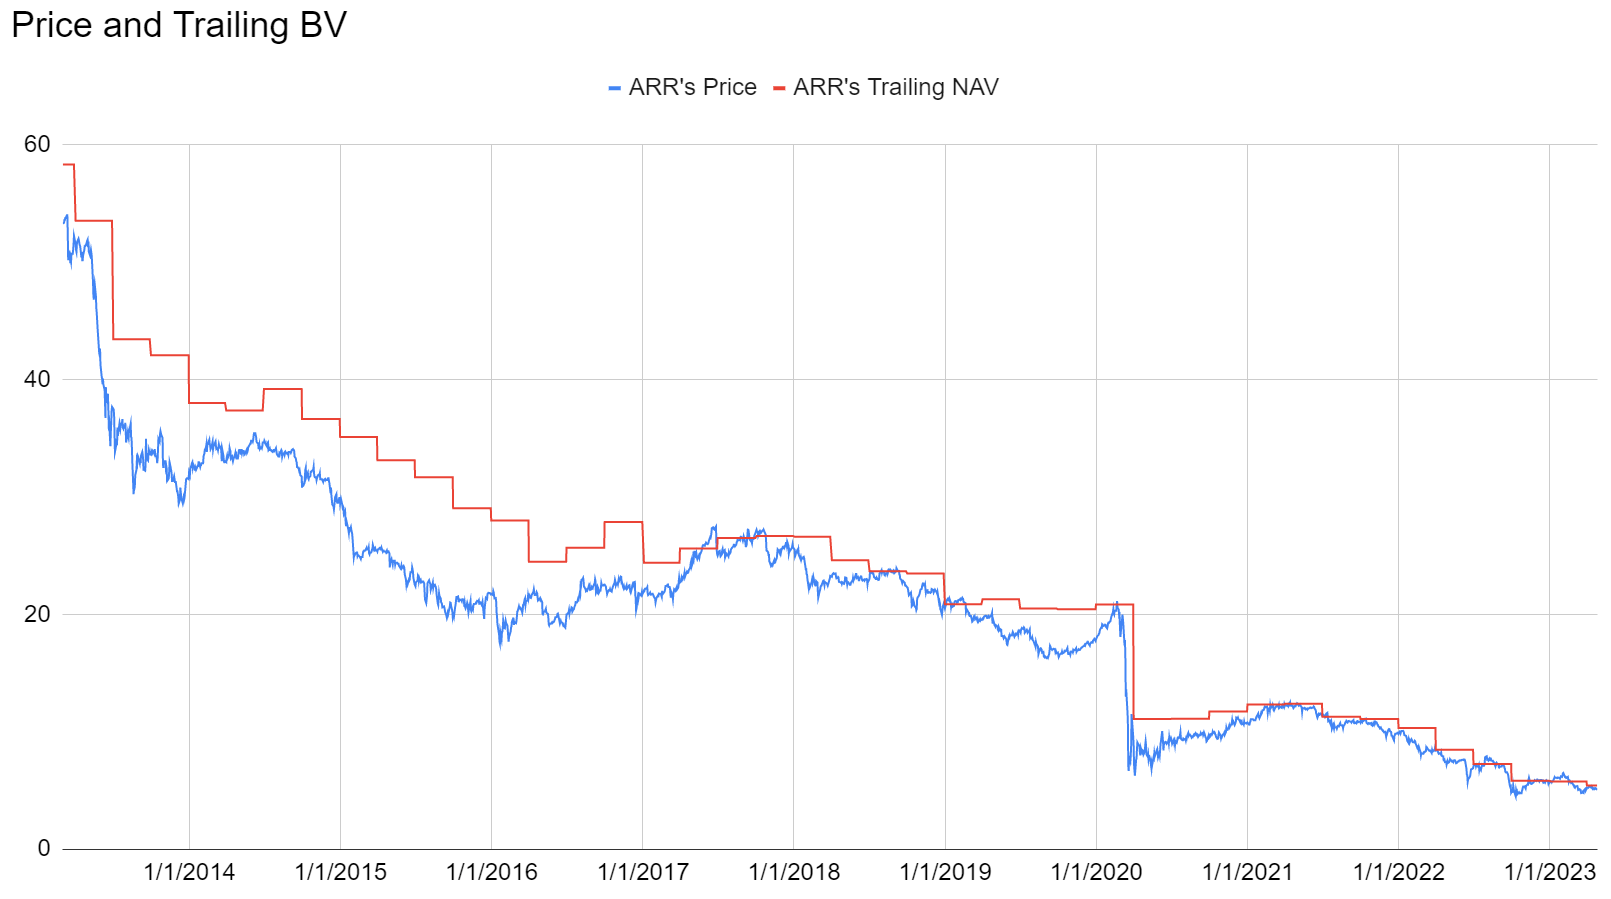
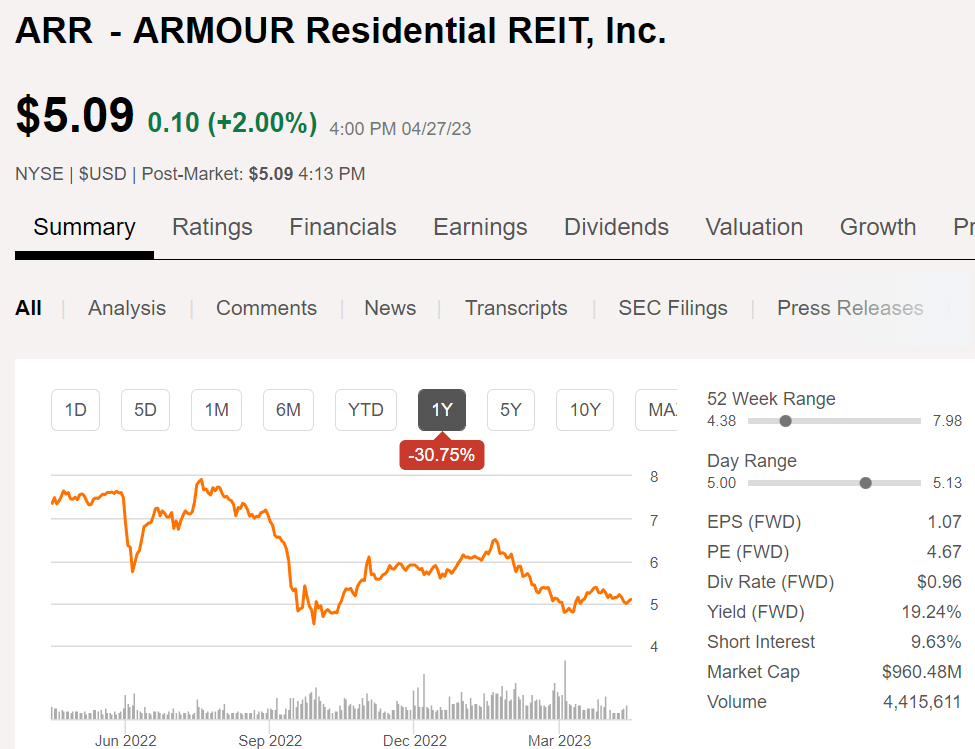
How about another REIT with a history of massive book value losses? Feast your eyes upon ARMOUR Residential REIT ( ARR ):
ARR recently reported their results, so we can already see that book value fell again during Q1 2023. Anyone want to ask why we don't think investors should pay slightly below book value (or more) to buy shares of ARR? Pretty sure my readers all know the answer. Thank you for understanding.
Perhaps you're meeting with a first-time reader, though, and they are busy saying something about the big dividend. You might say: "Sure, it would be a good choice if the dividend is maintained forever."
They think it might be. So what do you do? Hit them with this chart:
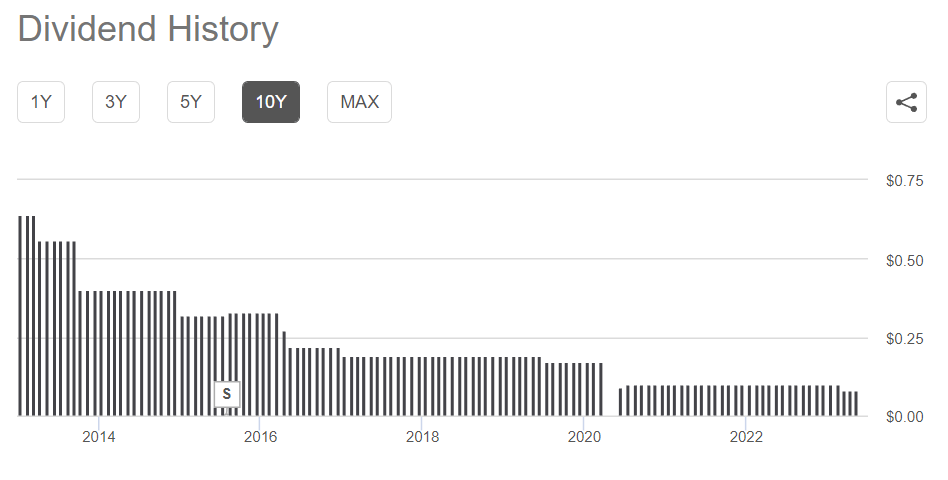
That chart has quite a bit in common with the price chart, doesn't it? It gets lower as it moves to the right. It won't last forever.
What makes this a great day to highlight ARR? Shares are up about 2%! Seems like a good enough time to call it out. For anyone who thinks I should've warned readers sooner, I can only point to the history of my articles slamming these stocks with bearish ratings.
After the rally, shares have an 18.86% "dividend yield." They also have a significant short interest at 9.6%:
The investors who are shortening these REITs could be hedging their sector risk by buying a few of the more attractive REITs.
Short Interest
For comparison, (using values from Seeking Alpha) Annaly Capital Management ( NLY ) only has 3.67% short interest. Dynex Capital ( DX ) only has 4% short interest. RITM only has 1.11% short interest.
Another Header
We don't like those choices, but what would someone own instead?
You could simply own cash (but using a short-term Treasury ETF) to reduce risk. However, if you're still in the market for investing (and we tend to be), then there are plenty of alternatives.
Three of my choices for lower-risk preferred shares are:
DX-C ( DX.PC ), AGNCO ( AGNCO ), and AGNCP ( AGNCP ). These shares are each trading at about 11% to 12.2% discounts to my target prices. The preferred shares have a much steadier dividend history, and they switch over to floating rates within the next two years. For AGNCO it's 10/15/2024 and for AGNCP and DX-C it is 4/15/2025. Since shares trade at a substantial discount to call value, investors get significantly more shares for their investment. That pumps up the yield.
If interest rates go down, the floating dividend payments will be lower. However, I'll remind investors these shares traded pretty close to $25.00, sometimes above $25.00, while interest rates were stuck well below 1%. If bond yields go down, the required yield on these shares should fall also. Granted, if the recession is severe enough, we could see credit spreads widen and push all valuations lower. If you're committed to that view, then you shouldn't be buying anything except some Treasuries. Your expectations for future rates would determine what maturity you want.
Stock Table
We will close out the rest of the article with the tables and charts we provide for readers to help them track the sector for both common shares and preferred shares.
We're including a quick table for the common shares that will be shown in our tables:
| Type of REIT or BDC |
| Residential Agency |
| Residential Hybrid |
| Residential Originator and Servicer |
| Commercial |
| BDC |
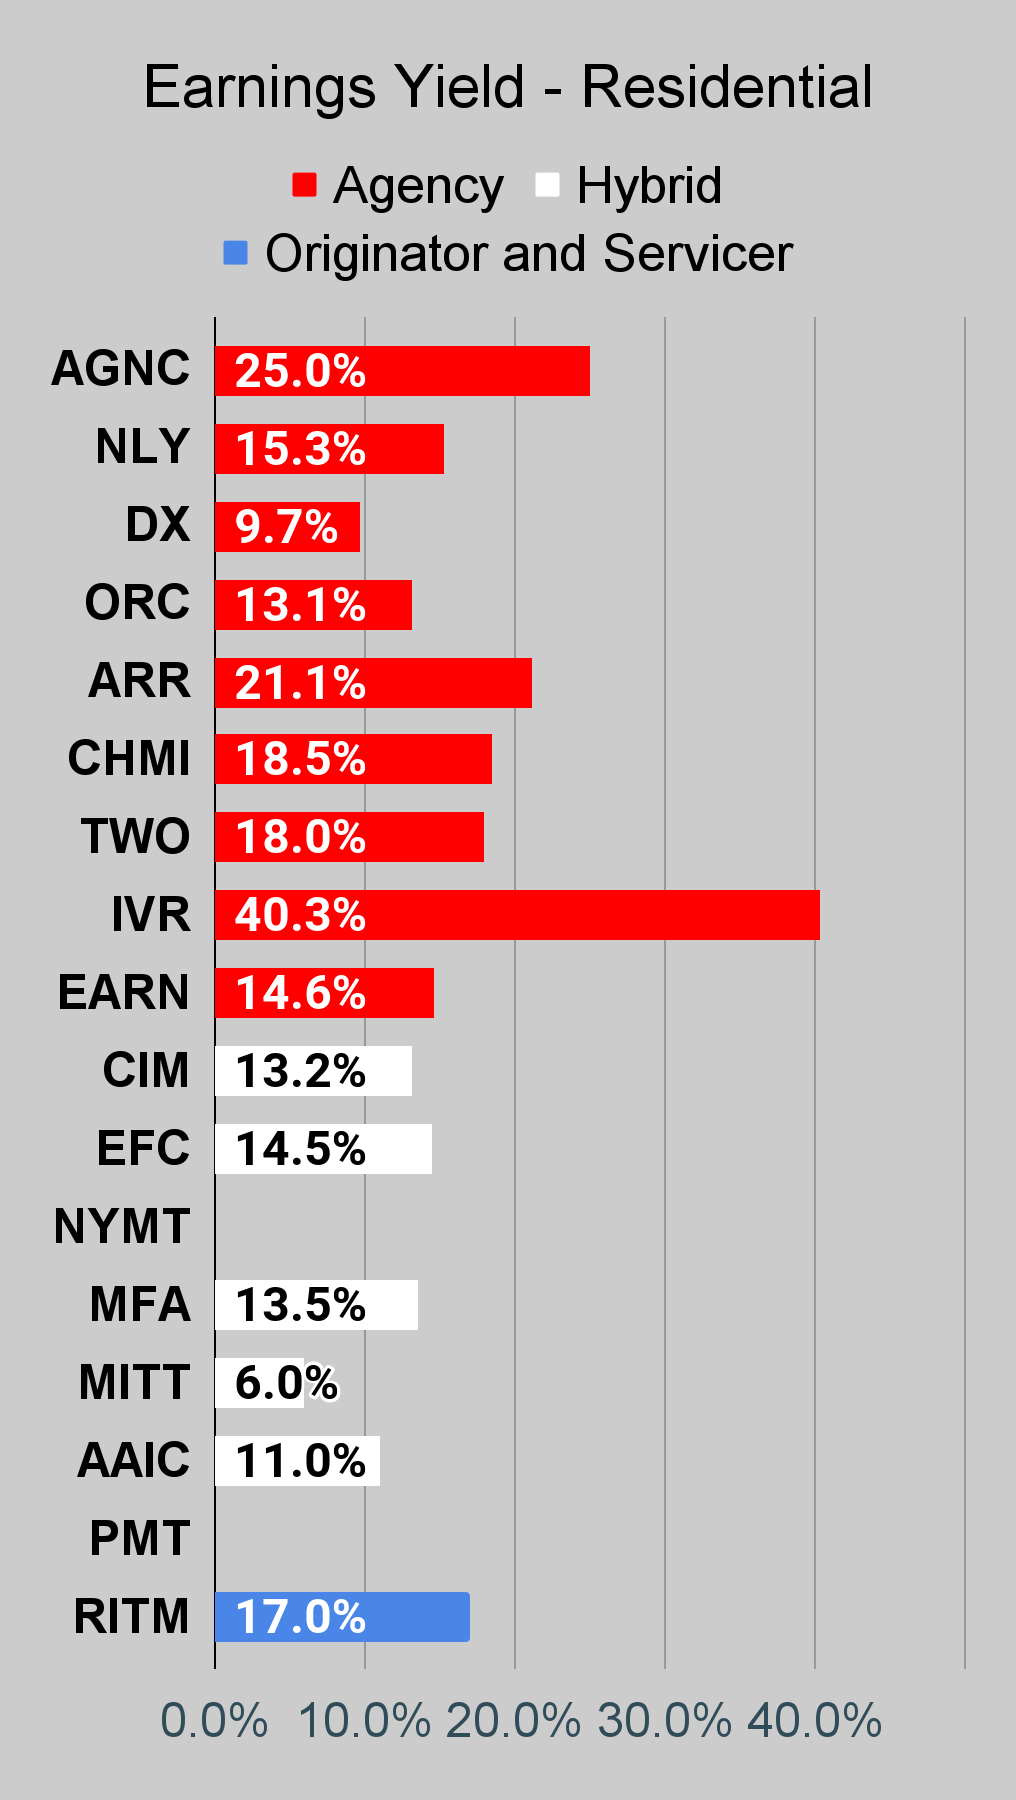
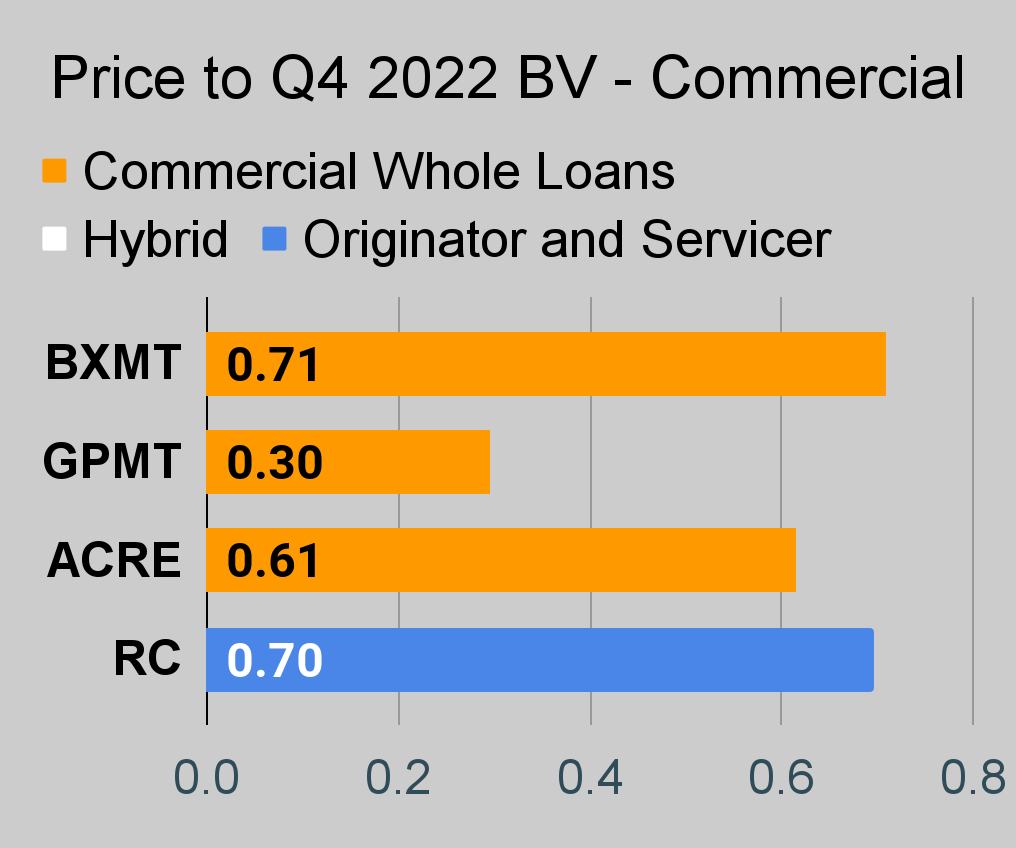
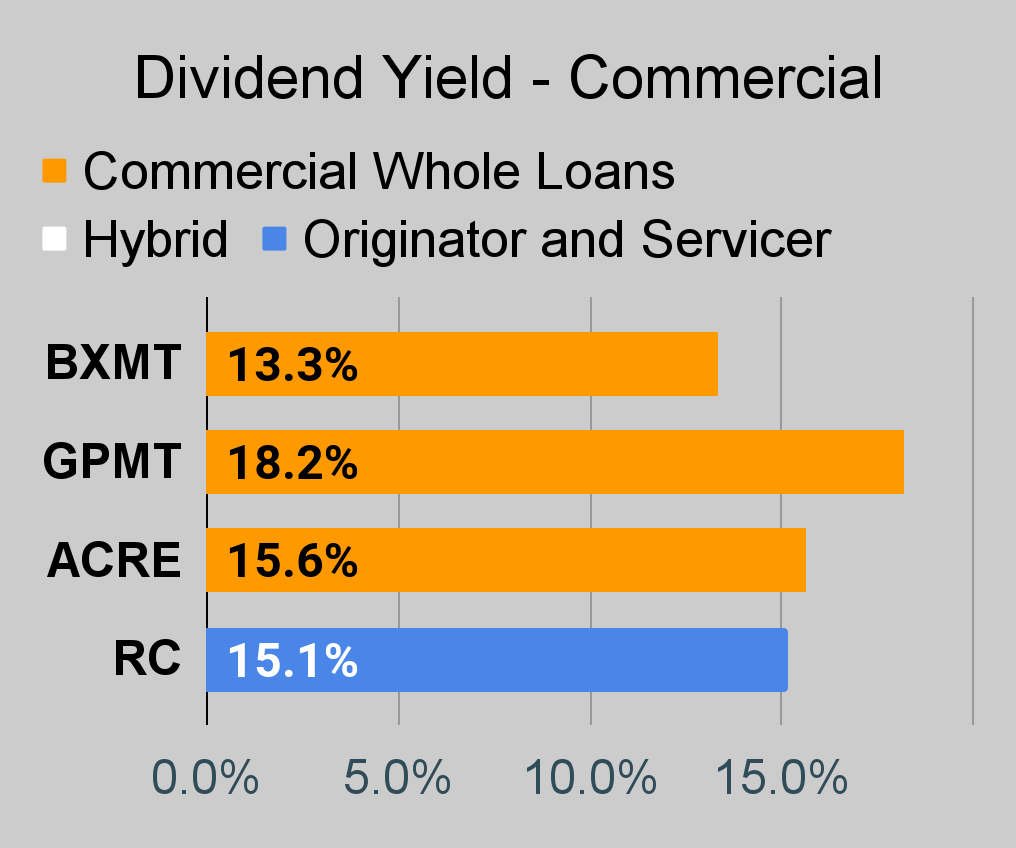
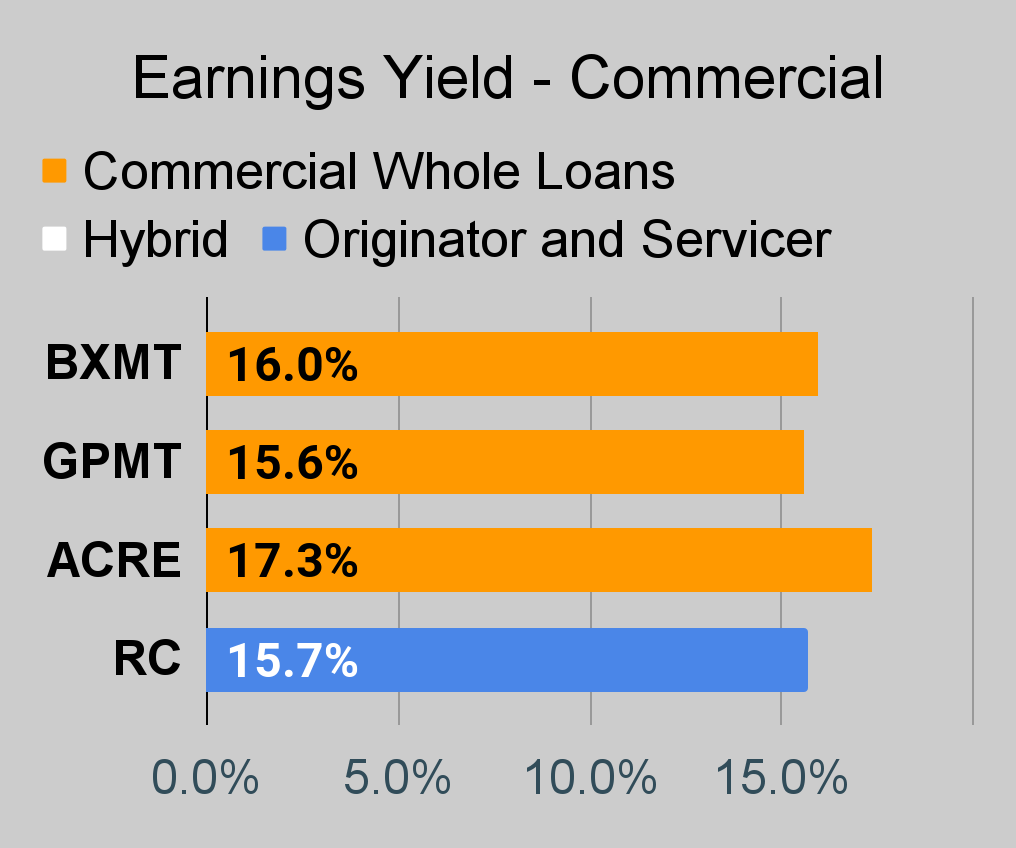
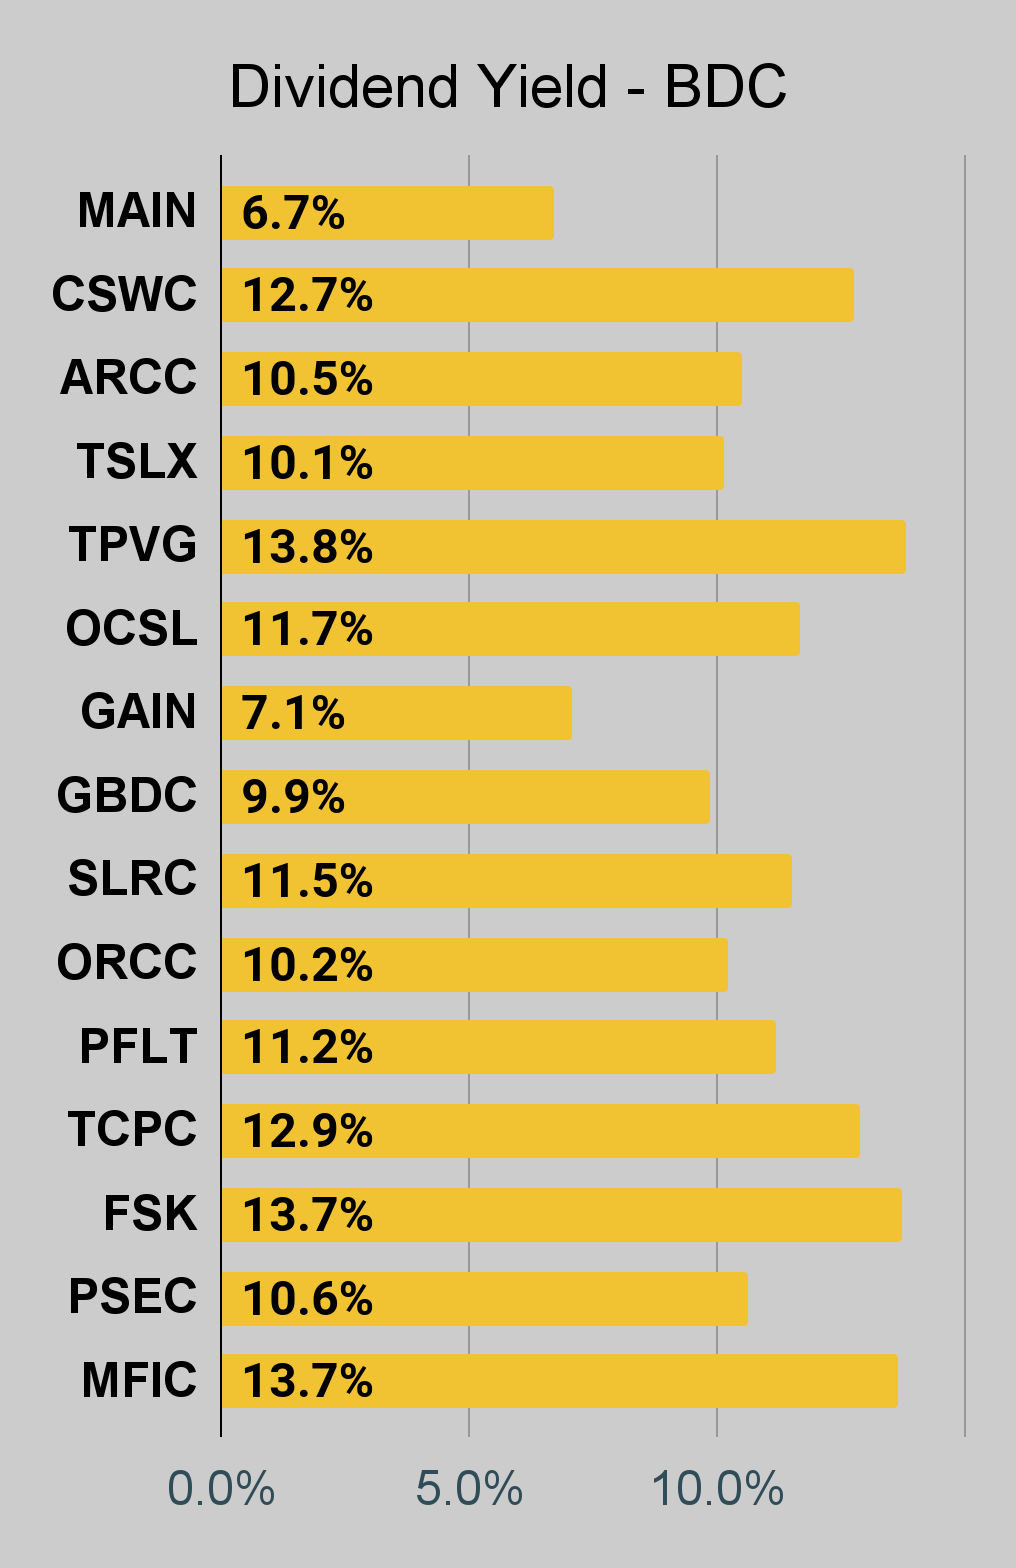
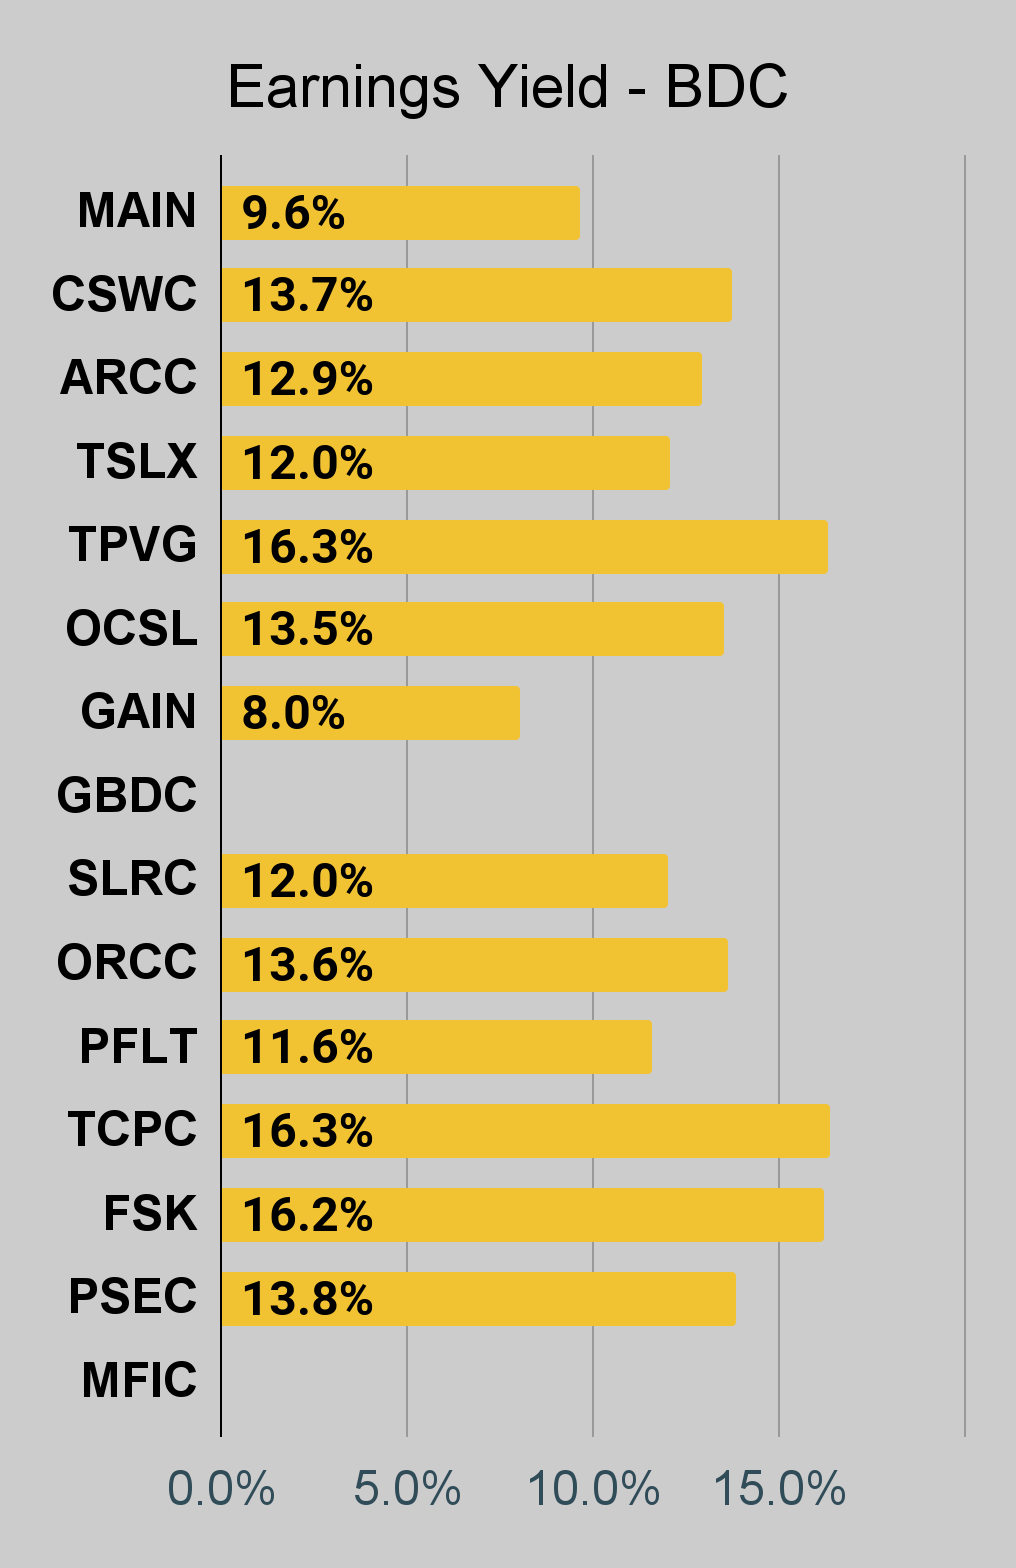
If you're looking for a stock and I haven't mentioned it yet, you'll still find it in the charts below. The charts contain comparisons based on price-to-book value, dividend yields, and earnings yield. You won't find these tables anywhere else.
For mortgage REITs, please look at the charts for AGNC, NLY, DX, ORC, ARR, CHMI, TWO, IVR, EARN, CIM, EFC, NYMT, MFA, MITT, AAIC, PMT, RITM, BXMT, GPMT, WMC, and RC.
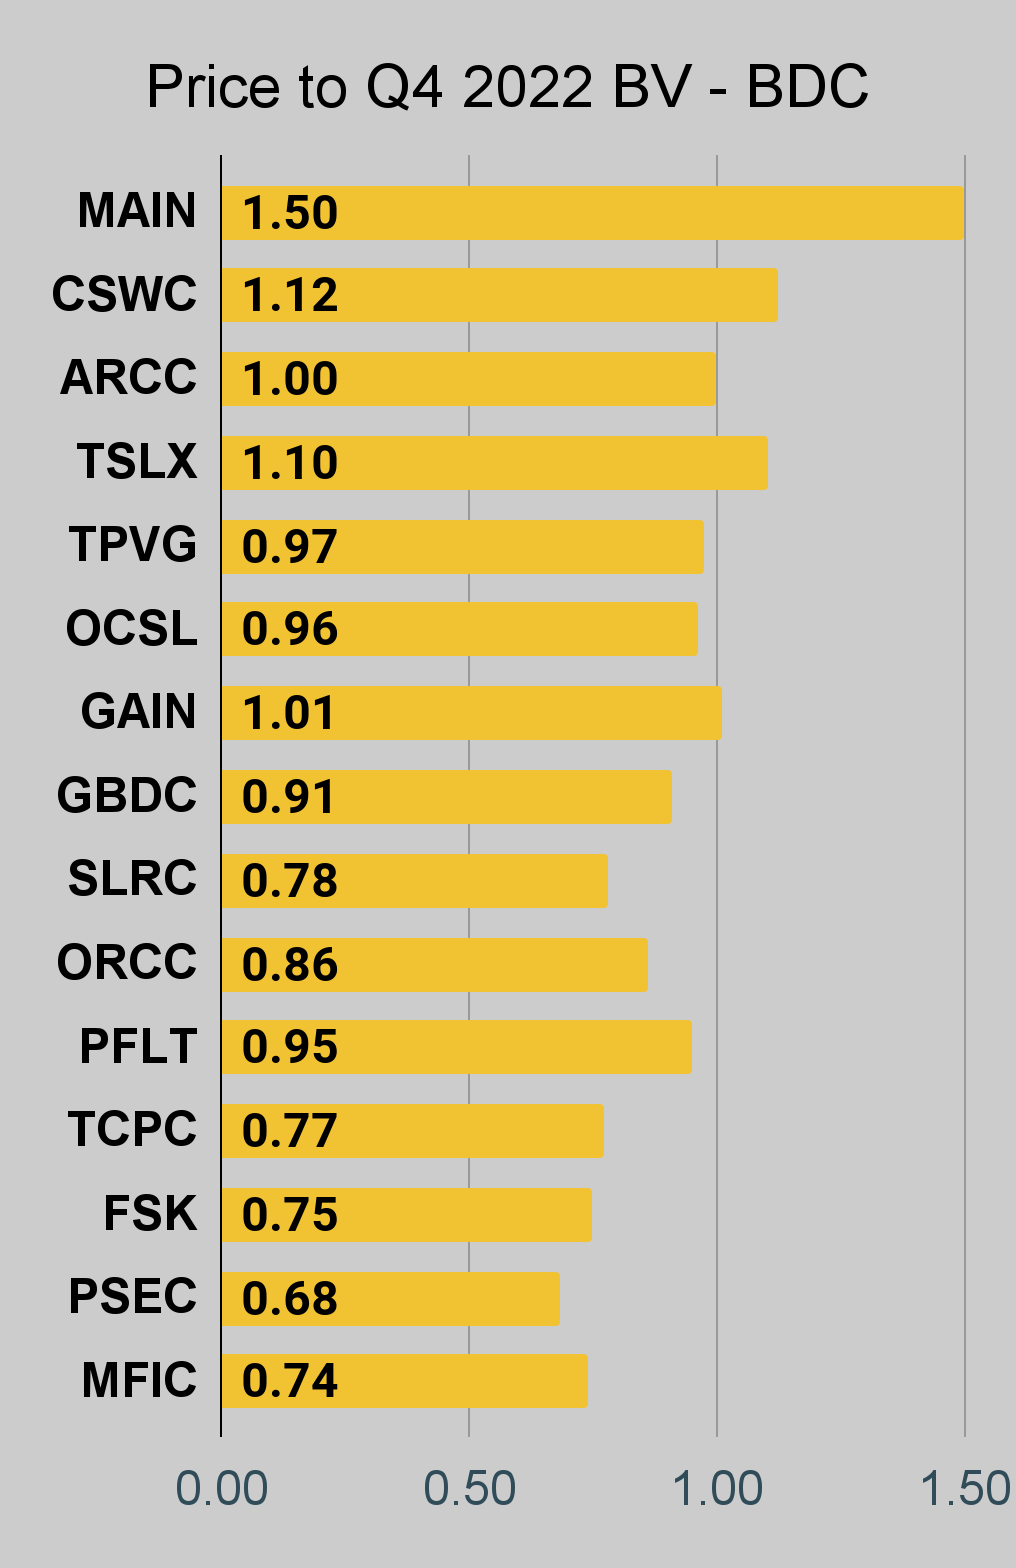
For BDCs, please look at the charts for MAIN, CSWC, ARCC, TSLX, TPVG, OCSL, GAIN, GBDC, SLRC, ORCC, PFLT, TCPC, FSK, PSEC, and MFIC.
This series is the easiest place to find charts providing up-to-date comparisons across the sector.
Residential Mortgage REIT Charts
Note: The chart for our public articles uses the book value per share from the latest earnings release. Current estimated book value per share is used in reaching our targets and trading decisions. It is available in our service, but those estimates are not included in the charts below. PMT and NYMT are not showing an earnings yield metric as neither REIT provides a quarterly "Core EPS" metric.
Second Note: Due to the way historical amortized cost and hedging is factored into the earnings metrics, it is possible for two mortgage REITs with similar portfolios to post materially different metrics for earnings. I would be very cautious about putting much emphasis on the consensus analyst estimate (which is used to determine the earnings yield). In particular, throughout late 2022 the earnings metric became less comparable for many REITs.
Commercial Mortgage REIT Charts
BDC Charts
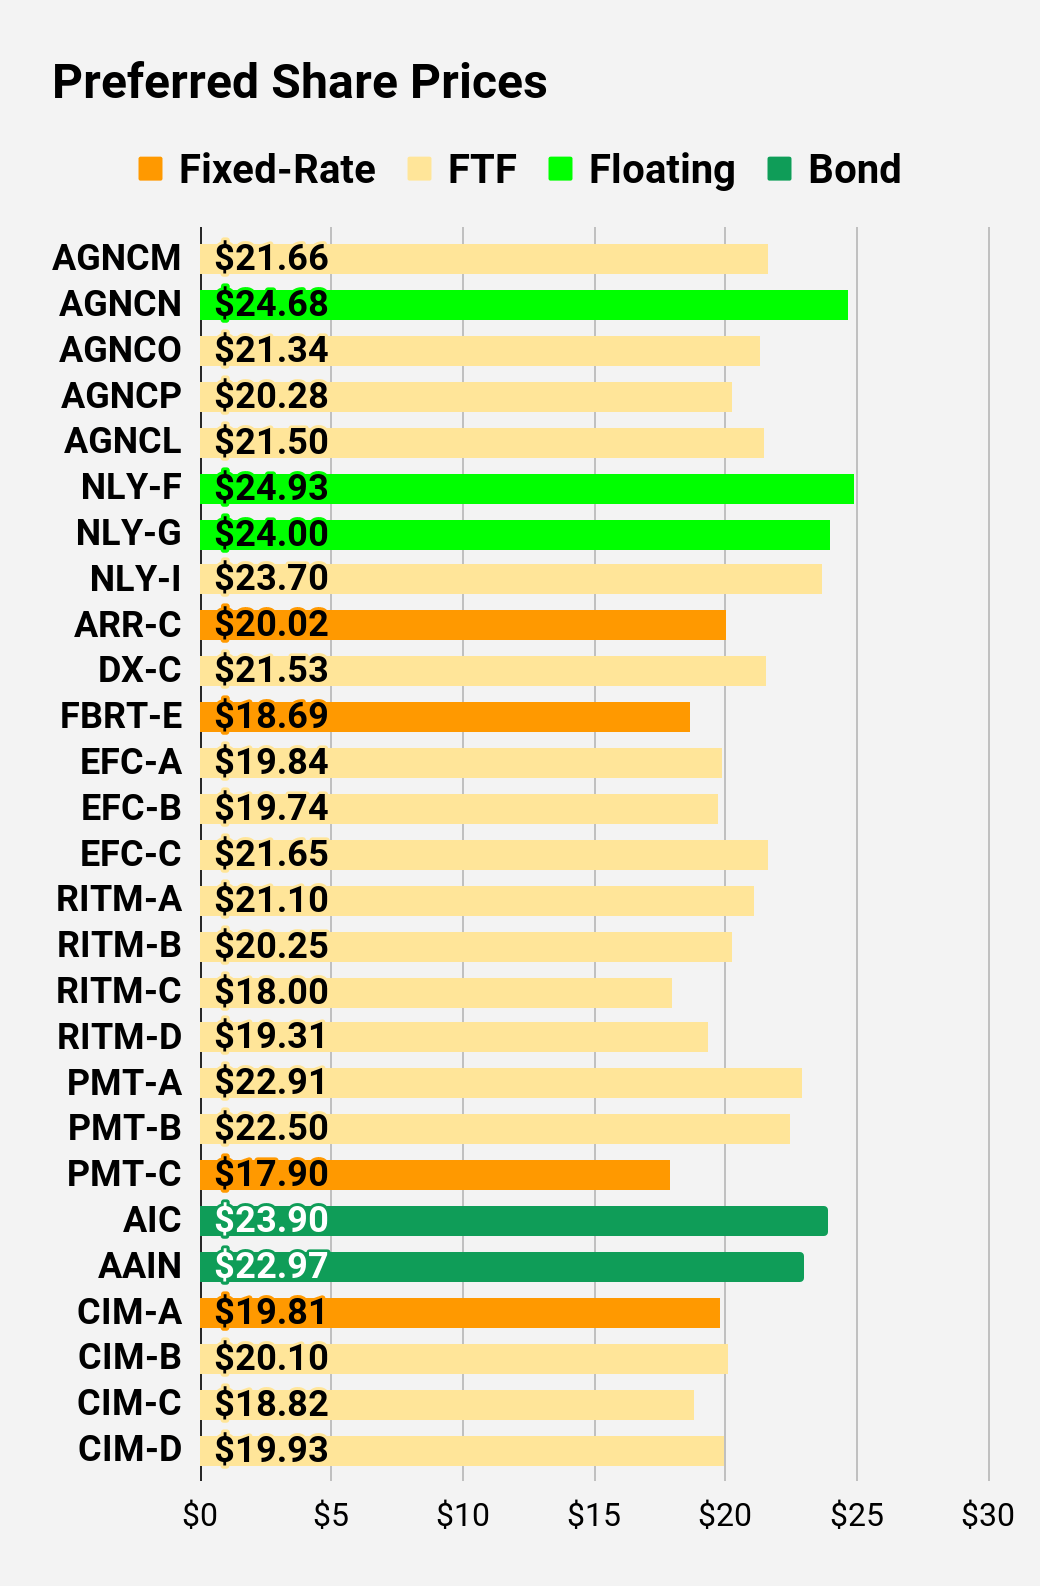
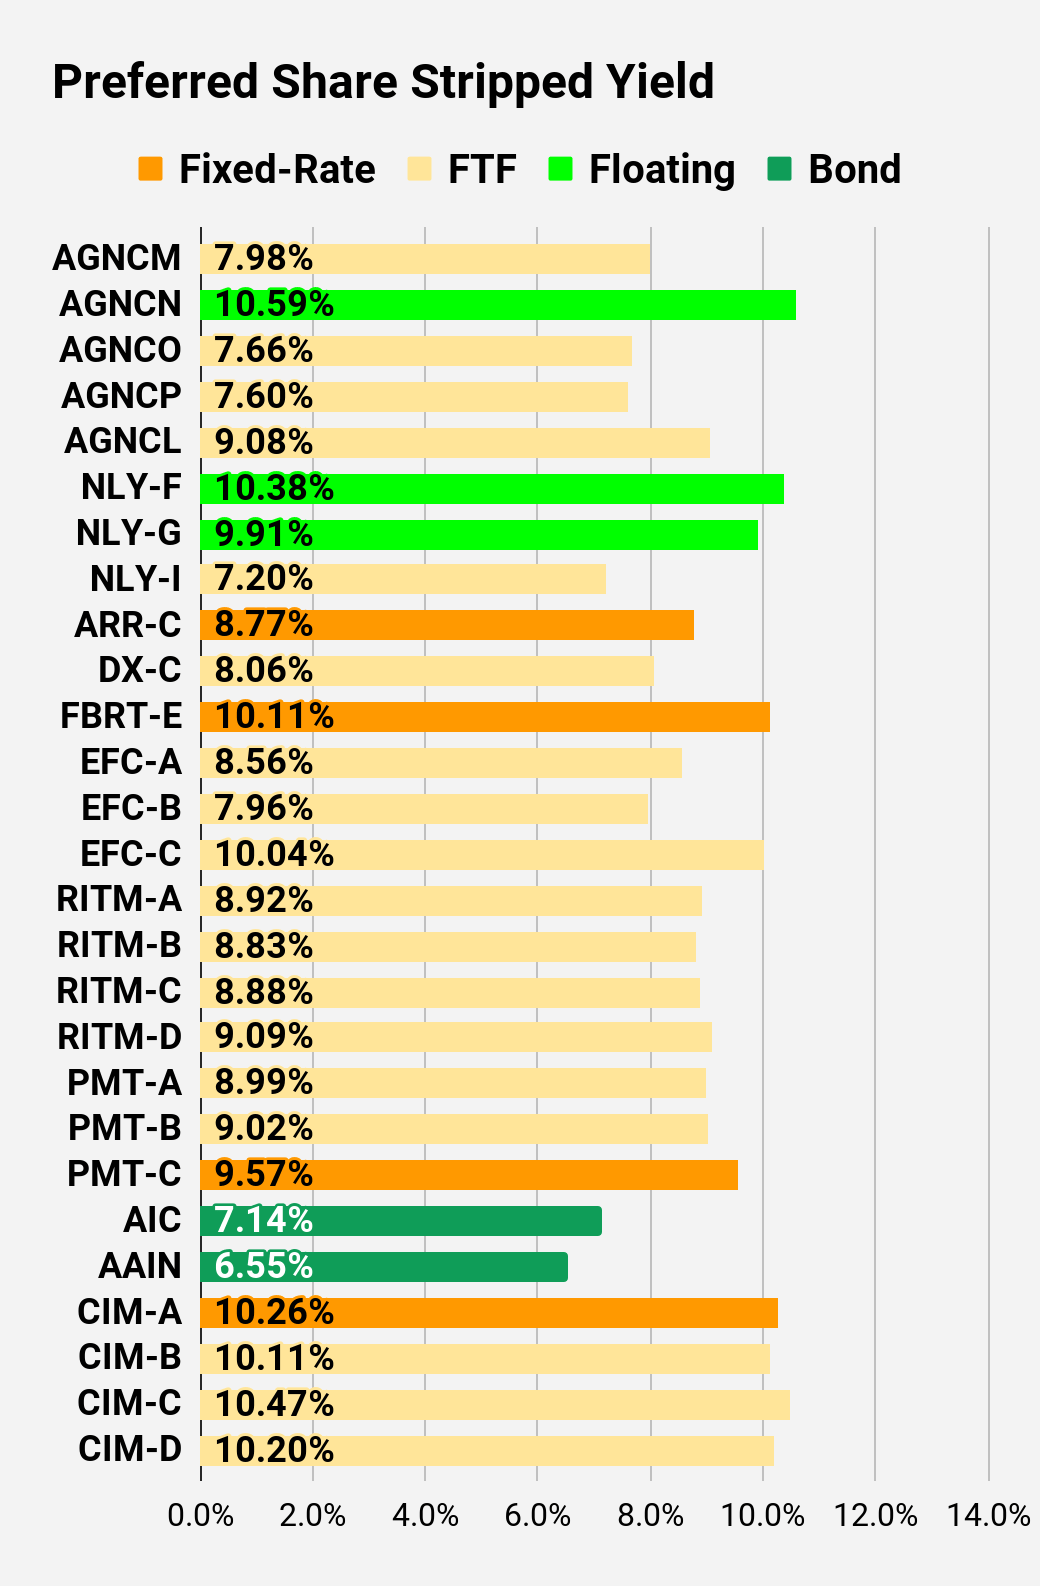
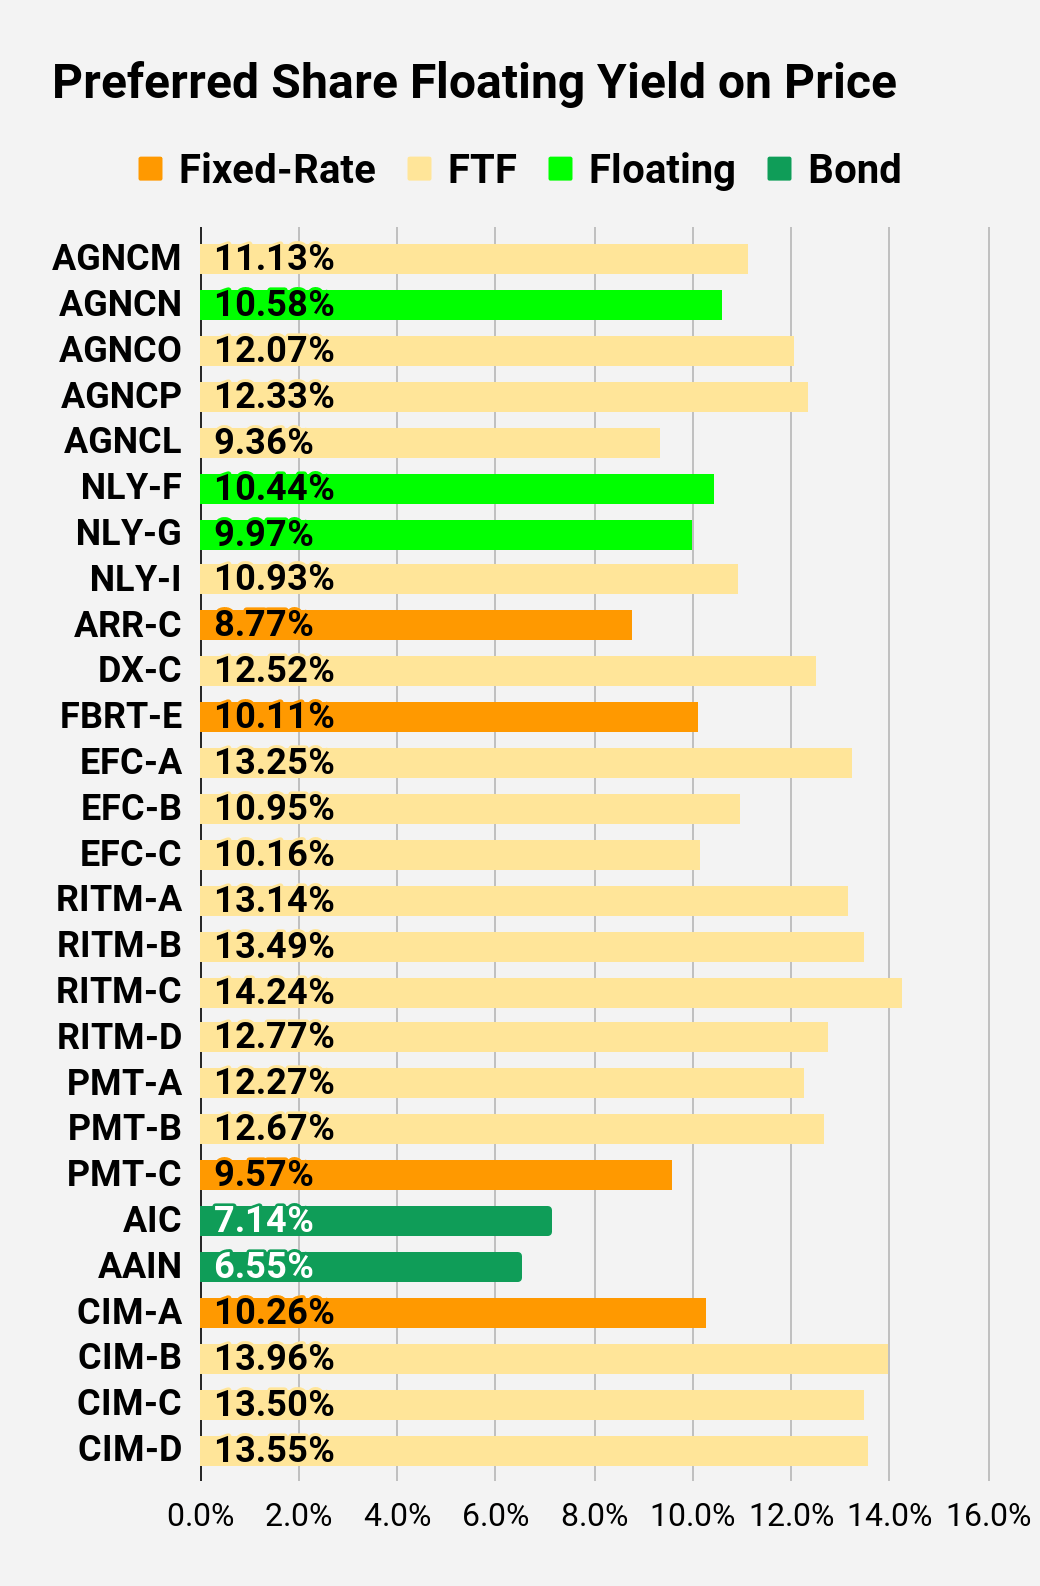
Preferred Share Charts
I changed the coloring a bit. We needed to adjust to include that the first fixed-to-floating shares have transitioned over to floating rates. When a share already is floating, the stripped yield may be different from the "Floating Yield on Price" due to changes in interest rates. For instance, NLY-F already has a floating rate. However, the rate is only reset once per three months. The stripped yield is calculated using the upcoming projected dividend payment and the "Floating Yield on Price" is based on where the dividend would be if the rate reset today. In my opinion, for these shares the "Floating Yield on Price" is clearly the more important metric.
Preferred Share Data
Beyond the charts, we're also providing our readers with access to several other metrics for the preferred shares.
After testing out a series on preferred shares, we decided to try merging it into the series on common shares. After all, we're still talking about positions in mortgage REITs. We don't have any desire to cover preferred shares without cumulative dividends, so any preferred shares you see in our column will have cumulative dividends. You can verify that by using Quantum Online. We've included the links in the table below.
To better organize the table, we needed to abbreviate column names as follows:
- Price = Recent Share Price - Shown in Charts
- BoF = Bond or FTF (Fixed-to-Floating)
- S-Yield = Stripped Yield - Shown in Charts
- Coupon = Initial Fixed-Rate Coupon
- FYoP = Floating Yield on Price - Shown in Charts
- NCD = Next Call Date (the soonest shares could be called)
- Note: For all FTF issues, the floating rate would start on NCD.
- WCC = Worst Cash to Call (lowest net cash return possible from a call)
- QO Link = Link to Quantum Online Page
| Ticker |
| Price |
| BoF |
| S-Yield |
| Coupon |
| FYoP |
| NCD |
| WCC |
| QO Link |
| P-Link |
| $21.66 |
| FTF |
| 7.98% |
| 6.88% |
| 11.13% |
| 4/15/2024 |
| $5.07 |
| $24.68 |
| Floating |
| 10.59% |
| 10.37% |
| 10.58% |
| 5/27/2023 |
| $0.63 |
| $21.34 |
| FTF |
| 7.66% |
| 6.50% |
| 12.07% |
| 10/15/2024 |
| $6.11 |
| $20.28 |
| FTF |
| 7.60% |
| 6.13% |
| 12.33% |
| 4/15/2025 |
| $7.79 |
| $21.50 |
| FTF |
| 9.08% |
| 7.75% |
| 9.36% |
| 10/15/2027 |
| $12.23 |
| $24.93 |
| Floating |
| 10.38% |
| 10.18% |
| 10.44% |
| 5/27/2023 |
| $0.48 |
| $24.00 |
| Floating |
| 9.91% |
| 9.36% |
| 9.97% |
| 5/27/2023 |
| $1.37 |
| $23.70 |
| FTF |
| 7.20% |
| 6.75% |
| 10.93% |
| 6/30/2024 |
| $3.42 |
| $20.02 |
| 8.77% |
| 7.00% |
| 8.77% |
| 1/28/2025 |
| $8.05 |
| $21.53 |
| FTF |
| 8.06% |
| 6.90% |
| 12.52% |
| 4/15/2025 |
| $6.92 |
| $18.69 |
| 10.11% |
| 7.50% |
| 10.11% |
| 5/27/2023 |
| $6.52 |
| $19.84 |
| FTF |
| 8.56% |
| 6.75% |
| 13.25% |
| 10/30/2024 |
| $7.70 |
| $19.74 |
| FTF |
| 7.96% |
| 6.25% |
| 10.95% |
| 1/30/2027 |
| $11.13 |
| $21.65 |
| FTF |
| 10.04% |
| 8.63% |
| 10.16% |
| 4/30/2028 |
| $14.15 |
| $21.10 |
| FTF |
| 8.92% |
| 7.50% |
| 13.14% |
| 8/15/2024 |
| $6.26 |
| $20.25 |
| FTF |
| 8.83% |
| 7.13% |
| 13.49% |
| 8/15/2024 |
| $6.99 |
| $18.00 |
| FTF |
| 8.88% |
| 6.38% |
| 14.24% |
| 2/15/2025 |
| $9.81 |
| $19.31 |
| FTF |
| 9.09% |
| 7.00% |
| 12.77% |
| 11/15/2026 |
| $11.84 |
| $22.91 |
| FTF |
| 8.99% |
| 8.13% |
| 12.27% |
| 3/15/2024 |
| $4.13 |
| $22.50 |
| FTF |
| 9.02% |
| 8.00% |
| 12.67% |
| 6/15/2024 |
| $5.01 |
| $17.90 |
| 9.57% |
| 6.75% |
| 9.57% |
| 8/24/2026 |
| $12.92 |
| $23.90 |
| Bond |
| 7.14% |
| 6.75% |
| 7.14% |
| 5/27/2023 |
| $1.43 |
| $22.97 |
| Bond |
| 6.55% |
| 6.00% |
| 6.55% |
| 8/1/2023 |
| $2.40 |
| $19.81 |
| 10.26% |
| 8.00% |
| 10.26% |
| 5/27/2023 |
| $5.59 |
| $20.10 |
| FTF |
| 10.11% |
| 8.00% |
| 13.96% |
| 3/30/2024 |
| $6.99 |
| $18.82 |
| FTF |
| 10.47% |
| 7.75% |
| 13.50% |
| 9/30/2025 |
| $11.12 |
| $19.93 |
| FTF |
| 10.20% |
| 8.00% |
| 13.55% |
| 03/30/2024 |
| $7.16 |
Second Batch:
| Ticker |
| Price |
| BoF |
| S-Yield |
| Coupon |
| FYoP |
| NCD |
| WCC |
| QO Link |
| P-Link |
| $19.79 |
| FTF |
| 10.31% |
| 8.13% |
| 13.85% |
| 04/27/2027 |
| $13.33 |
| $18.75 |
| FTF |
| 10.21% |
| 7.63% |
| 14.20% |
| 07/27/2027 |
| $14.35 |
| $18.64 |
| FTF |
| 9.77% |
| 7.25% |
| 13.82% |
| 1/27/2025 |
| $9.54 |
| $18.45 |
| 10.32% |
| 7.50% |
| 10.32% |
| 5/27/2023 |
| $6.84 |
| $17.77 |
| FTF |
| 9.27% |
| 6.50% |
| 15.12% |
| 3/31/2025 |
| $10.49 |
| $16.89 |
| FTF |
| 10.44% |
| 7.00% |
| 16.53% |
| 11/30/2026 |
| $14.44 |
| $21.63 |
| 9.55% |
| 8.20% |
| 9.55% |
| 5/27/2023 |
| $3.53 |
| $21.74 |
| FTF |
| 9.56% |
| 8.25% |
| 12.61% |
| 4/15/2024 |
| $5.25 |
| $20.18 |
| FTF |
| 9.75% |
| 7.75% |
| 13.12% |
| 12/27/2024 |
| $8.24 |
| $19.18 |
| FTF |
| 9.93% |
| 7.50% |
| 13.95% |
| 9/27/2027 |
| $14.29 |
| $20.00 |
| FTF |
| 9.92% |
| 7.88% |
| 14.71% |
| 1/15/2025 |
| $8.45 |
| $19.58 |
| FTF |
| 10.30% |
| 8.00% |
| 14.09% |
| 10/15/2027 |
| $14.42 |
| $17.66 |
| FTF |
| 9.81% |
| 6.88% |
| 16.23% |
| 10/15/2026 |
| $13.36 |
| $17.20 |
| 10.26% |
| 7.00% |
| 10.26% |
| 1/15/2027 |
| $14.37 |
| $19.00 |
| 9.35% |
| 7.00% |
| 9.35% |
| 5/27/2023 |
| $6.28 |
| $21.00 |
| FTF |
| 9.98% |
| 8.25% |
| 13.20% |
| 3/30/2024 |
| $6.07 |
| $17.38 |
| 12.10% |
| 8.25% |
| 12.10% |
| 5/27/2023 |
| $7.98 |
| $16.50 |
| 12.37% |
| 8.00% |
| 12.37% |
| 5/27/2023 |
| $8.85 |
| $17.80 |
| FTF |
| 11.45% |
| 8.00% |
| 16.78% |
| 9/17/2024 |
| $10.18 |
| $20.19 |
| FTF |
| 10.77% |
| 8.63% |
| 13.95% |
| 7/30/2024 |
| $7.51 |
| $18.00 |
| 11.03% |
| 7.88% |
| 11.03% |
| 5/21/2026 |
| $13.02 |
Strategy
Our goal is to maximize total returns . We achieve those most effectively by including "trading" strategies. We regularly trade positions in the mortgage REIT common shares and BDCs because:
- Prices are inefficient.
- Long term, share prices generally revolve around book value.
- Short term, price-to-book ratios can deviate materially.
- Book value isn't the only step in analysis, but it is the cornerstone.
We also allocate to preferred shares and equity REITs. We encourage buy-and-hold investors to consider using more preferred shares and equity REITs.
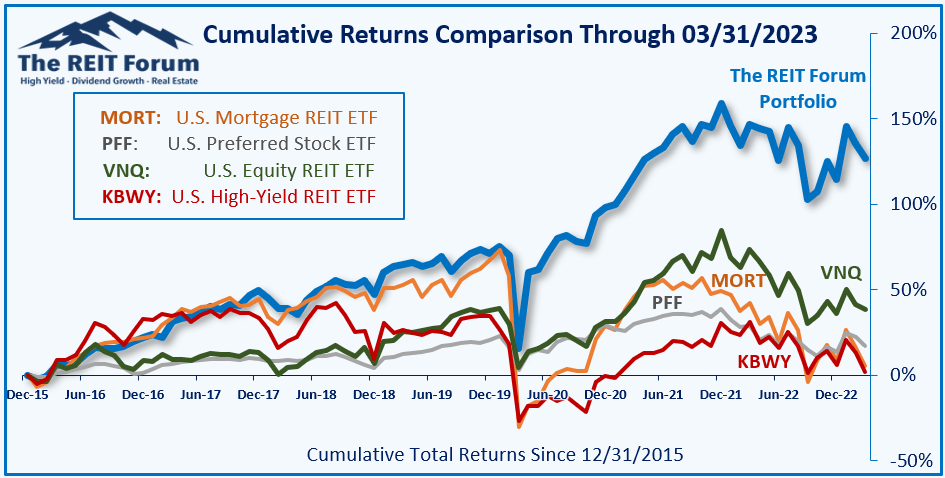
Performance
We compare our performance against four ETFs that investors might use for exposure to our sectors:
The four ETFs we use for comparison are:
| Ticker |
| Exposure |
| One of the largest mortgage REIT ETFs |
| One of the largest preferred share ETFs |
| Largest equity REIT ETF |
| The high-yield equity REIT ETF. Yes, it has been dreadful. |
When investors think it isn't possible to earn solid returns in preferred shares or mortgage REITs, we politely disagree. The sector has plenty of opportunities, but investors still need to be wary of the risks. We can't simply reach for yield and hope for the best. When it comes to common shares, we need to be even more vigilant to protect our principal by regularly watching prices and updating estimates for book value and price targets.
Ratings: Bearish on CHMI and ARR
For further details see:
19% Dividend Yields And Big Short Interest