VTV - 2 Sentiment Indicators Point To Higher Prices
2023-06-27 04:27:17 ET
Summary
- Two Sentiment indicators suggest that the current market rally is not over, as there are not enough bullish investors yet.
- Both the UltraPro Bear-Bull Buying Ratio and the ProShare S&P 500 short fund indicate that a major market decline is unlikely at this time.
- A 5% market correction may occur, but the longer-term uptrend will remain intact until there are more bulls and fewer bears.
Why markets go opposite to what people expect
Sentiment indicators are based on the investment principle that when the vast majority of people expect something to happen, the opposite usually happens. It's easy to understand why. It's because economic conditions or earnings numbers don't determine stock prices, people's thoughts and actions do.
If all available investors have purchased stocks thinking prices will go higher, no one is left to buy and drive prices higher with additional good news. So, prices decline, or at best go sideways.
Likewise, when everyone's expecting stock prices to decline, the vast majority of investors have already sold and there's few left to sell to push stocks lower no matter how bad things get. This is effectively what happened last year.
This explains the contradictory price action that often occurs with positive or negative news.
The Value of Sentiment Indicators
Sentiment indicators help investors find the moment when too many people are expecting something to happen.
There's a corollary to the above principle. It's that a major advance or decline will not end until the vast majority of people are measurably bullish or bearish. While this corollary isn't true all of the time, it's true at least 80% to 90% of the time, which makes it a very useful investment principle.
It's this corollary that we're using here.
Two Sentiment Indicators Suggest Prices Will Continue Higher
Many investors are wondering if the eight month price advance that started last October is over. If one agrees with the above corollary, then the following two sentiment indicators suggest the rally is not over. There simply aren't enough bulls yet; the rally hasn't exhausted potential buyers. It won't be over until it does.
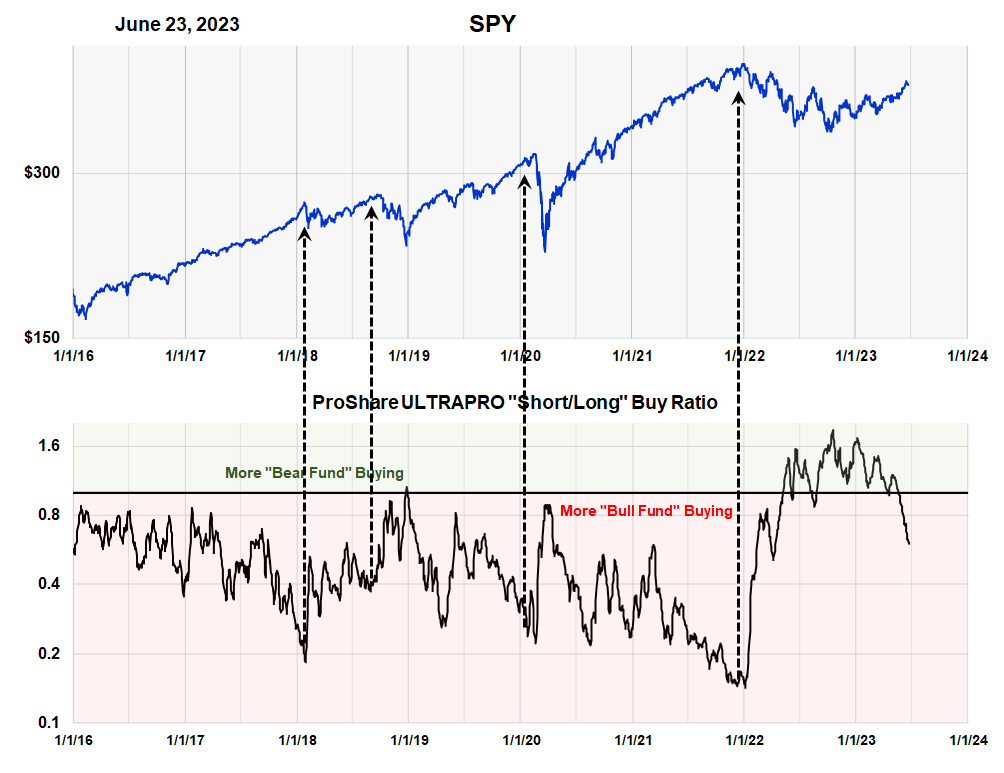
The UltraPro Bear-Bull Buying Ratio
The ProShares ULTRAPRO bear to bull buying ratio (Sentiment King)
We personally like this first sentiment indicator. It compares buying levels in the ProShares UltraPro bull and bear funds.
The ProShares family has nine investments called UltraPro, which are highly leveraged long and short funds of major market indices. Almost 40% of the fund's net assets are in these nine funds.
In our indicator we divide how much money is buying short funds into the amount buying long funds. We average over seven days. The ratio is charted above in black.
Since 2016 major tops haven't occurred until the ratio got below .4, which is when 2 1/2 times more money is going into the bull funds than bear funds. We've indicated these moments with four arrows. The current ratio is .6.
While we can see an 5% correction from here, this indicator shows there aren't enough bulls - and still too many bears - for a major decline to start. Until that happens the longer term uptrend is still in force.
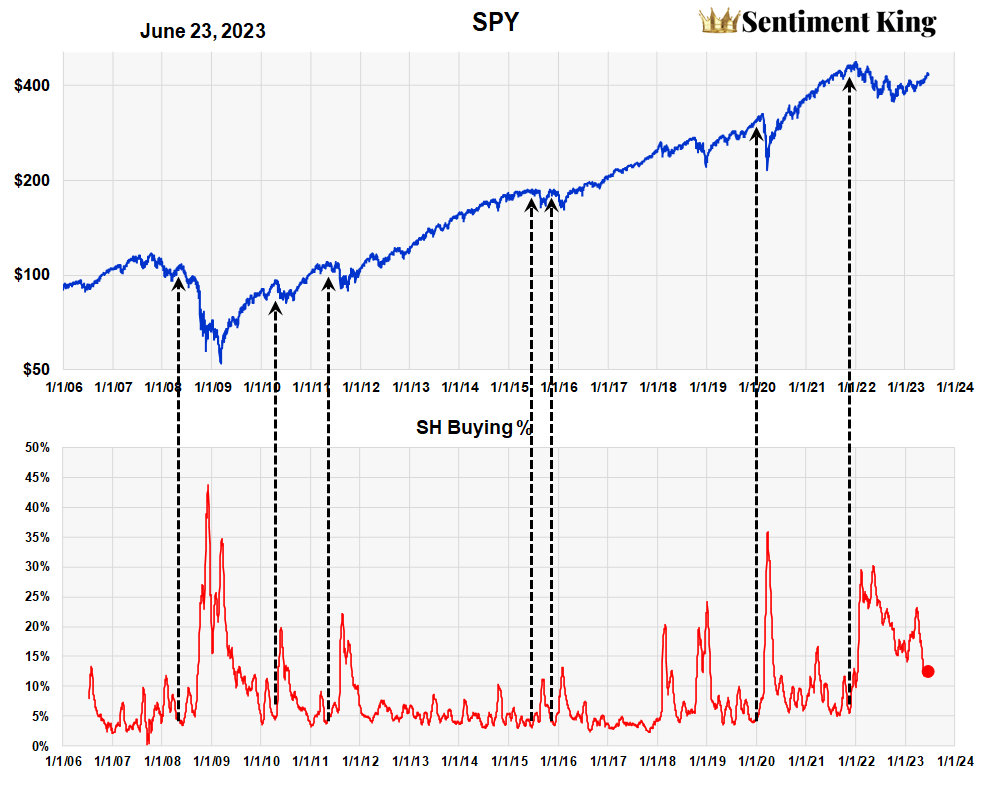
Too many people are still buying the ProShares S&P 500 short fund ( SH )
Below is another sentiment indicator based on buying levels of the ProShares S&P 500 short fund. It shows how much money is going into this bear fund each day as a percentage of assets, and its charted from 2007 to present.
Average daily buying in the ProShares Short Fund (SH) as a percent of assets (Sentiment King)
For the last ten months we used it to be bullish on this market. But it's also useful at indicating major market top, which occur when buying (short selling) falls to very low levels.
For example, since 2007 a major decline in the market has never occurred until buying in SH fell to 5%, or less, of total assets. The ratio can get to 5% and not indicate a top, but a major top has never occurred without the ratio first being only 5%.
The current buying ratio is 12%, which means there are still far too many people shorting this market. But it's still the lowest amount of short selling since the start of last year's bear market; just not low enough.
Using our principle, the long term up trend won't be over until the ratio at least reaches 5%. But if this is to occur, it should take at least three or four months.
Summary
Both ProShares Sentiment Indicators point to the same conclusion: that the rally has farther to go and is not over. The market could experience a 5% correction but the longer term trend will remain intact until there are more bulls and fewer bears.
For further details see:
2 Sentiment Indicators Point To Higher Prices