EXPD - 2 Stocks Breaking Out To 52-Week Highs Are On My Buy List (Technical Analysis)
Summary
- Expeditors International of Washington, Inc. and Fortive Corporation closed at 52-week highs.
- They have strong price action, momentum, and relative strength.
- Both are being bought this week.
In this article, I will outline why I am taking a new position in two stocks. Both stocks could do well in this new bull market. The stocks are Expeditors International of Washington, Inc. ( EXPD ) and Fortive Corporation ( FTV ). With the new bull market taking off, I am going to establish a position in both stocks this week. Let’s examine why.
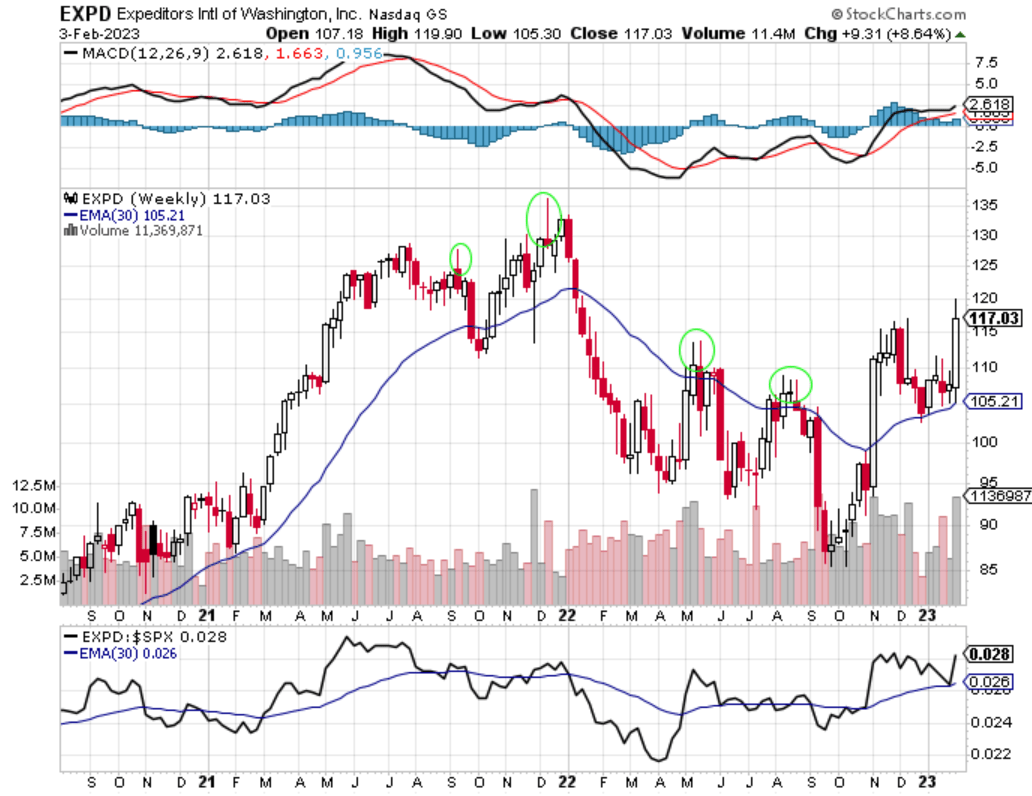
Chart 1 below shows a weekly chart of EXPD with a 30-week moving average, a momentum indicator known as the Moving Average Convergence/Divergence ((MACD)) in the top pane, and a relative strength ratio in the bottom pane. Here is what I see when I look at Chart 1.
Chart 1 – EXPD Weekly Chart with 30 Week Moving Average
Starting with price, you can see that EXPD made a high back in December 2021 and then headed lower as the stock market turned bearish. EXPD crossed below its 30-week moving average in blue and headed lower for several months. In April/May 2022 EXPD rallied back to its 30-week moving average only to be rejected at that level. EXPD then turned lower and put in a lower low in June 2022. EXPD then attempted another rally only again to be rejected at the 30-week moving average. EXPD made a lower low and its bear market low in late September 2022 at $85.85.
Over that 10-month period, EXPD was in a downtrend as it made a series of lower lows and lower highs. That trend seems to have reversed. EXPD rallied off the September lows as the new bull market started. EXPD made a higher high in December 2022, pulled back to a higher low in late December 2022, and now bounced off its 30-week moving average in blue and closed the week at $117.03. It sits above its upward sloping 30-week moving average. This price is the highest closing price since January 2022. New 52-week highs are always bullish. Volume has been strong as well. There is a lot to like about this price action.
Looking at the top pane in Chart 1, you can see the MACD momentum indicator. The MACD is used by traders to determine momentum. MACD is a combination of two moving averages that make up the red MACD line, and a moving average of the difference between the two moving averages of the red MACD line. This is the black signal line. There is no need to get caught up in the math of the MACD indicator. Using the MACD indicator for identifying momentum is easy. When the black signal line is above the red MACD line that is considered a bullish development. It shows positive or bullish momentum. It is even more bullish when the black signal line is above the zero-center line. I want to own stocks when the black signal line is above the red MACD line. Buying a stock that has bullish momentum is a plus. You can see that EXPD had a bullish MACD crossover in November and in December the black signal line crossed above the zero-center line. If you look at the left hand side of Chart 1 you can see that EXPD rose from August 2020 to December 2021 and that the MACD black signal line was above the zero-center line the whole time. Similarly, when EXPD declined for 10 months, the Signal line was below the zero-center line. Again, traders use the MACD indicator to validate the price move in either direction.
The bottom pane of Chart 1 shows the relative strength ratio of EXPD to the SP 500 index. When the black price line is moving higher that shows that EXPD is outperforming the SP 500 index. When the black price line is moving lower, EXPD is underperforming the SP 500 index. Since September 2022, EXPD has been outperforming the SP 500 index. The ratio’s 30 week moving average is sloping higher as well.
In summary, EXPD is in a bullish uptrend. It is above an upward sloping 30-week moving average. It closed at a 52-week closing high. Volume is bullish. Momentum is bullish both with a cross over and the signal line being above the center line. Lastly, the relative strength ratio is showing that EXPD is outperforming the market. These are the reasons I am starting a position in EXPD this week.
Now I will turn my attention to FTV, shown in Chart 2 below.
Chart 2 - FTV Weekly Chart with 30 Week Moving Average
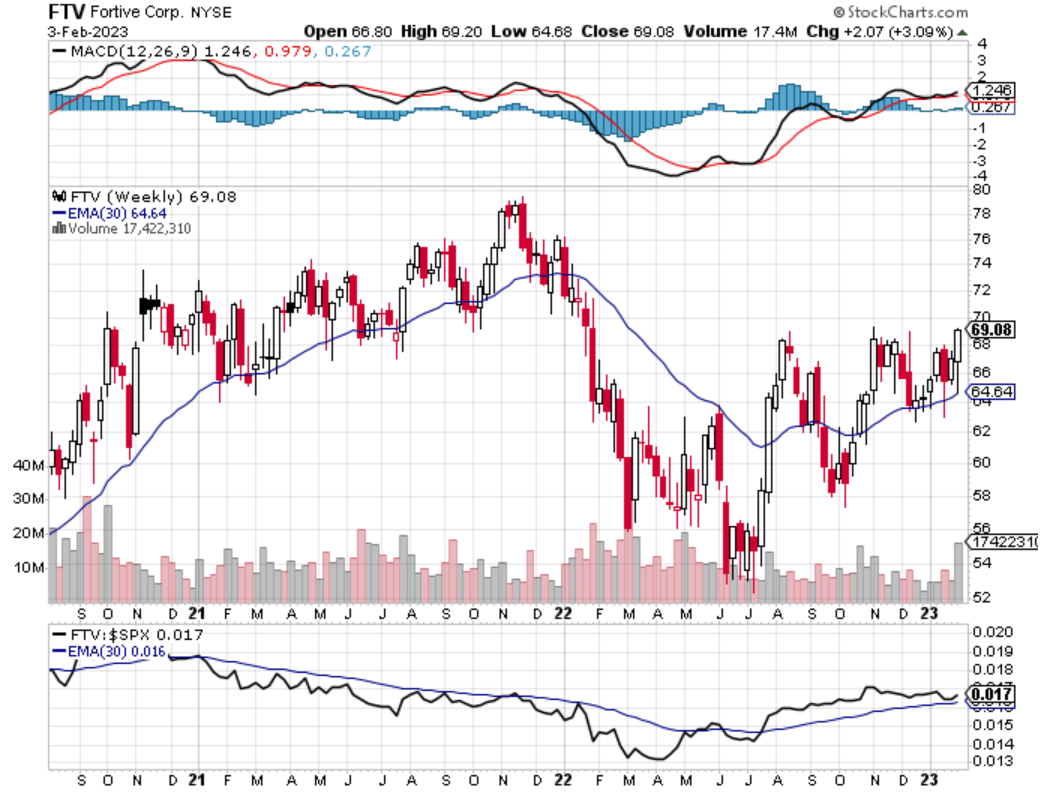
The analysis of FTV is just like the analysis of EXPD. FTV peaked in November 2022 at $79.44 and then declined with the bear market. FTV put in a series of lower lows and lower highs. FTV bottomed in July 2022 at $52.36. Then the trend change started. FTV crossed above its 30-week moving average and made a higher high in August 2022 at $68.92. It pulled back below its 30-week moving average while still making a higher low at $57.37 in October. From there it put in a higher high in November before pulling back again but this time finding support at its 30-week moving average. That itself is bullish. Now FTV closed at a new 52-week closing high above an upward sloping 30-week moving average. Volume has been constructive. Price action is bullish.
MACD is also validating strong price action. In November, the MACD signal line crossed above the zero-center line and there was a bullish MACD cross over in October. Momentum seems strong for FTV.
Looking at the relative strength line you can see that FTV has outperformed the SP 500 index since April 2022. The line is above its upward sloping 30-week moving average and the line is now curling back up which is bullish.
In summary, FTV is making a series of higher highs and higher lows. It is above its upward sloping 30- week moving average and it just printed a 52-week closing high. Volume is bullish and momentum is strong. FTV is also outperforming the broad market index. All these elements taken together are the reason why I am starting a position in FTV this week.
This type of analysis is trying to find high probability setups using price, momentum, and relative strength. It is not a perfect methodology. I have yet to find a perfect method for buying and selling stocks. Knowing that my analysis could be wrong I am prepared to close my position. If either stock closes below its 30-week moving average, I would enter a stop loss order just below the weekly low. If price starts to make a series of lower highs and lower lows, I will look to close my position.
Also note that I risk no more than 2% of my account equity in any trade. The price I would use to calculate my 2% account equity position for EXPD is $102 which is just below the low made in December 2022. The price I would use to calculate my 2% account equity position is $62.50 for FTV which is also just below the low made in December 2022. So, using EXPD as an example, I am looking to start my position at the current price which is $117.03. I said my stop loss would be $102. So that spread is $15. If I have a $100,000 account and I only want to risk 2% of my account equity in this trade, I don’t want to lose more than $2,000 which is 2% of my account equity. To determine how many shares to buy for this position I divide $2,000 by $15 and come to 133 shares.
That is the most shares I can buy. If I buy 133 shares at $117, I buy $15,561 worth of EXPD. If EXPD then drops to $102 and my stop loss order is filled, I sell 133 shares at $102 which is $13,566. This results in a loss of just under $2,000. That wouldn’t be great. It wouldn’t be too detrimental to recover from either. Small losses keep me in the game and allow me to find another opportunity.
For further details see:
2 Stocks Breaking Out To 52-Week Highs Are On My Buy List (Technical Analysis)