DFAS - 2000 And 2020: The Differences Are As Important As The Similarities For Tech Stocks
Summary
- The pandemic bubble was driven by low rates as much as it was by over enthusiasm, unlike the 2000 tech bubble which occurred against a backdrop of relatively high rates.
- While IT spending surged during the pandemic, it was nothing like the late 90s, making an investment hangover less likely.
- Valuations have already largely corrected meaning the path forward is likely to be dictated by the probability of recession.
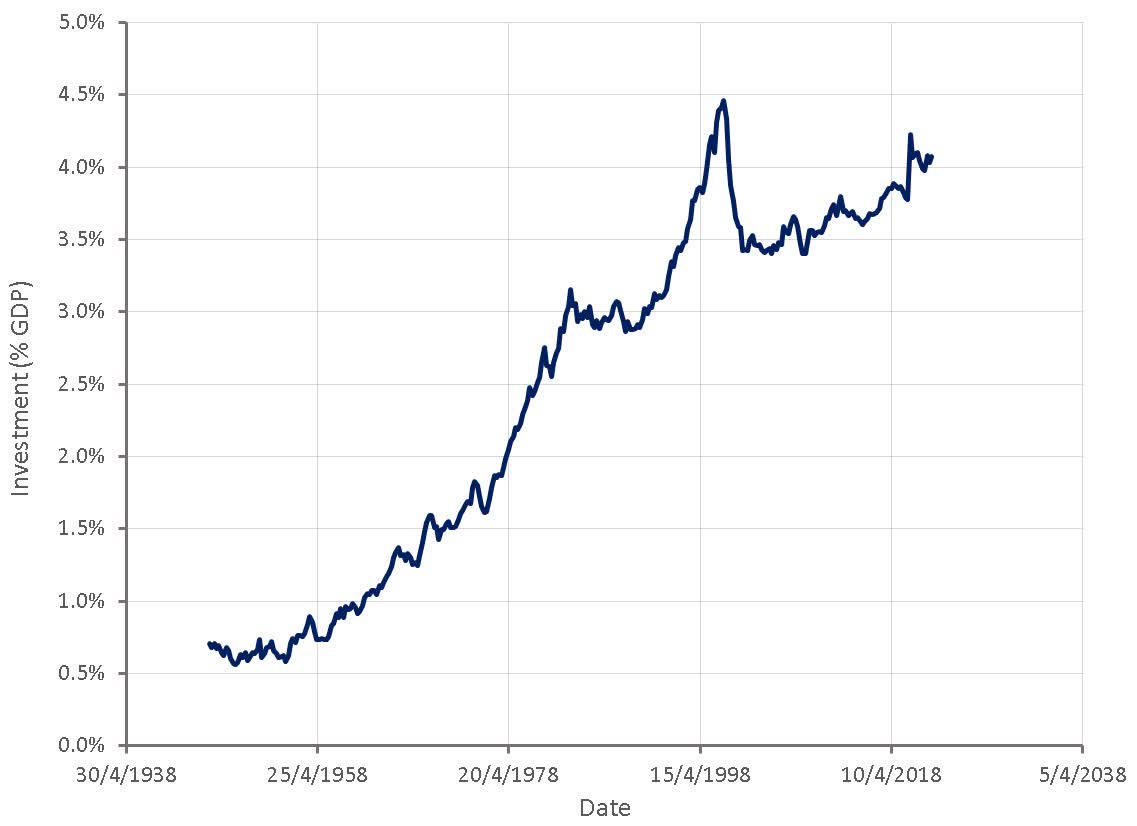
The COVID induced surge in growth stocks during 2020 and 2021 has drawn comparisons to the tech bubble of the late 90s, with many expecting the fallout to be the same. While there are similarities, it should be recognized that in general valuations were not as extreme during the pandemic and were driven by low interest rates as much as they were by overenthusiasm. The late 90s also saw an unsustainable increase in IT spending due to the rise of the internet and Y2K fears, something that happened to a far more modest extent during COVID. A period of weaker IT spending is therefore likely, particularly if a recession occurs later in the year, but it is unlikely to be as severe as the one that occurred in the early 2000s.
Figure 1: Private Fixed Investment in Information Processing Equipment and Software (source: Created by author using data from The Federal Reserve)
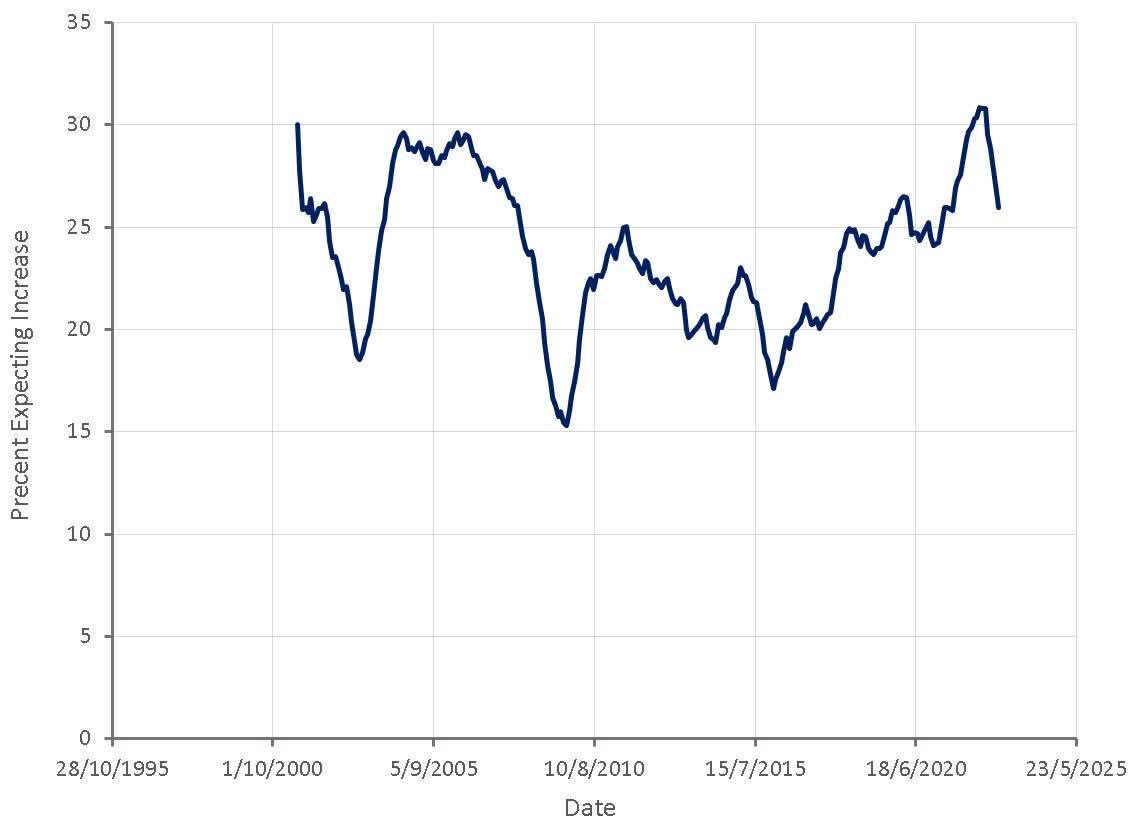
There are already signs that the pullback in tech spending may be stabilizing, although it is really too early to make any conclusions. If inflation rates continue to decline and recessionary fears fade, it is likely that IT spending will stabilize. If inflation begins to rise again, or a recession becomes a widely anticipated event, IT spending is likely to weaken further.
Figure 2: Future Technology Spending; Percent Expecting Increases for New York (source: Created by author using data from The Federal Reserve)
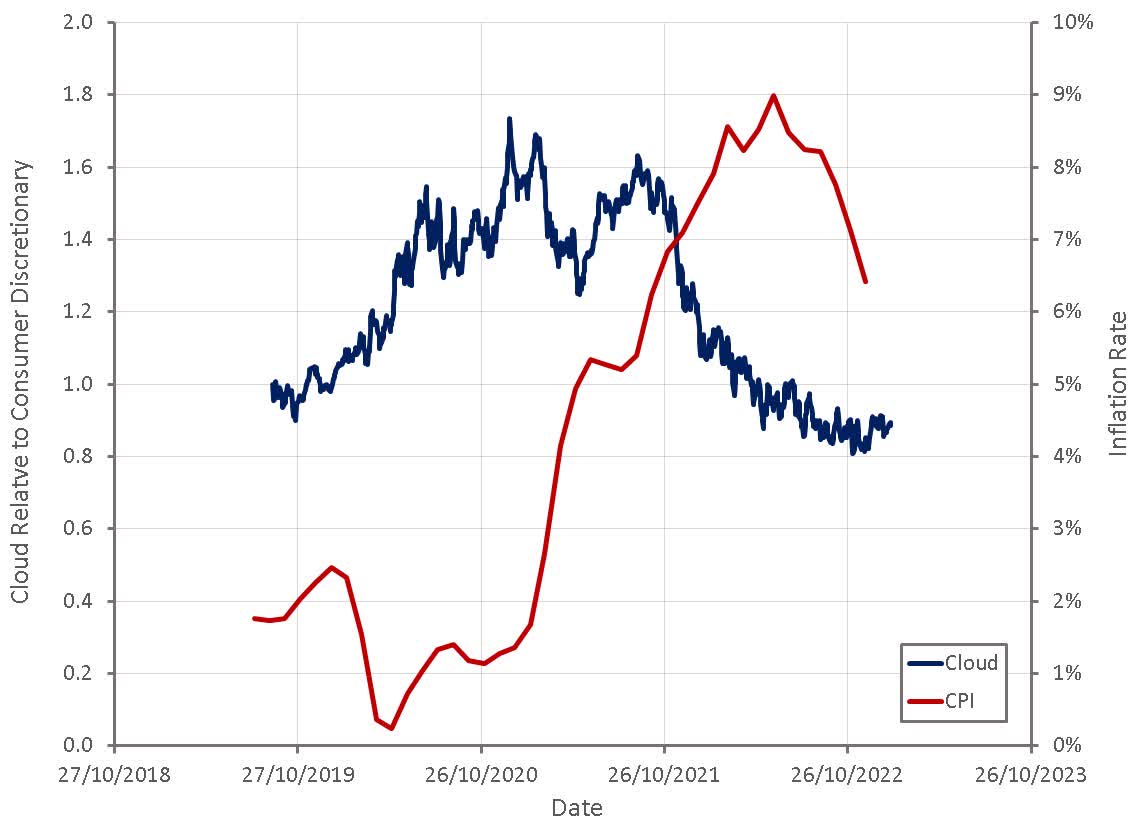
While it is difficult to say with any certainty, markets seem to be recognizing that inflation was transitory but has yet to begin pricing in significant economic weakness. Trying to anticipate a recession is likely to be a fool's errand, and any real economic weakness is not likely to become apparent until late 2023 / early 2024. It therefore would be reasonable to expect tech stock prices to stabilize or even recover somewhat in the near term.
Figure 3: Cloud Stock Index Relative to Consumer Discretionary Stock Index (source: Created by author using data from The Federal Reserve and Yahoo Finance)
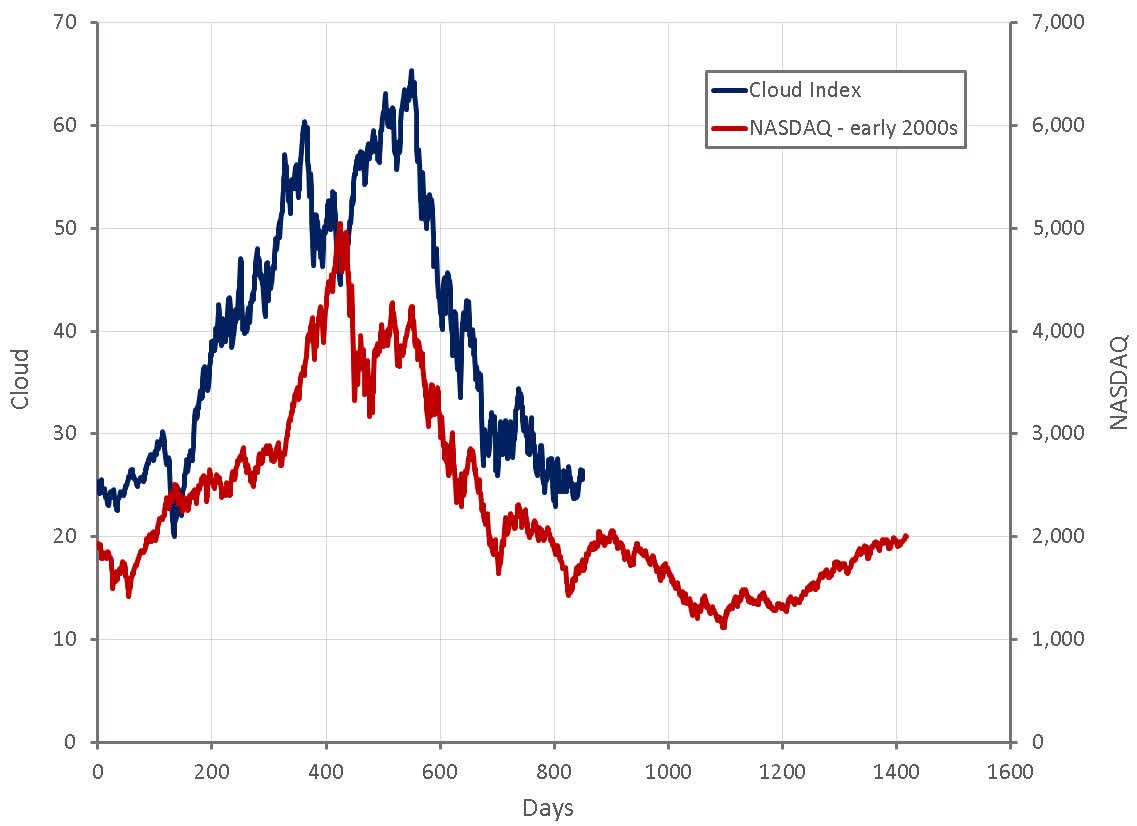
Comparing the performance of tech stocks during the pandemic to the NASDAQ index during the tech bubble indicates some similarities. In general I believe this approach is lazy and mainly used to support pre-existing beliefs, but in this case could indicate that the pandemic bubble has already burst and that the path forward will depend on whether there is a recession or not.
Figure 4: Cloud Stock Index and NASDAQ Index During the Tech Bubble (source: Created by author using data from Yahoo Finance)
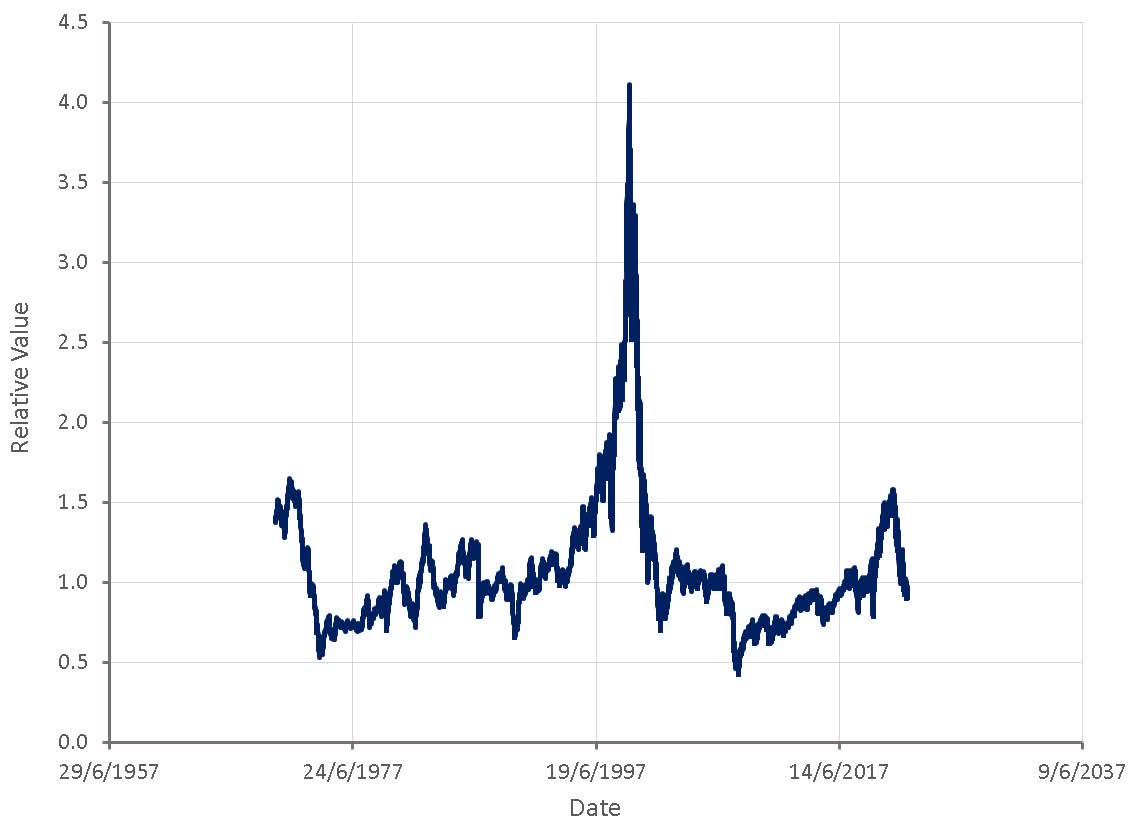
From a valuation perspective, the NASDAQ index already appears reasonably priced relative to other assets based on the current interest rate environment. Higher interest rates, weaker earnings or greater pessimism regarding growth stocks could lead to further downside though. It should also be noted that valuations during the tech bubble were far more extreme than during the pandemic, due in large part to the difference in interest rates.
Figure 5: NASDAQ Relative Value (source: Created by author using data from The Federal Reserve)
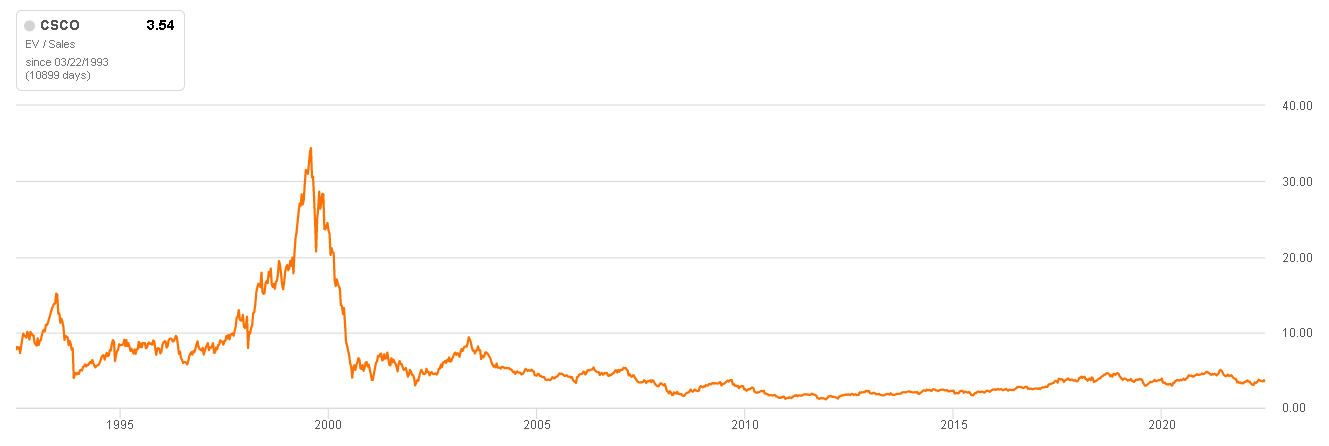
Cisco ( CSCO ) is the poster child for excessive optimism during the tech bubble, and is often used to highlight the folly of paying high multiples for growth stocks. Cisco is a unique case though, due to the company's combination of size and high valuation. A stock trading on higher multiples is more likely to be overvalued, as expectations of future business performance are higher, but this really depends on the circumstances. Buying Cisco on an EV/S multiple of 30 in the early 90s would have provided a healthy return, even if an investor held through to the 2002 lows. The problem was paying that type of multiple during the late 90s when Cisco was already a massive company that had saturated its core market and was chasing growth in lower quality markets. This was also occurring against a backdrop of unsustainable IT spending due to the buildout of internet infrastructure. For Cisco investors to have earned reasonable returns from the tech bubble peak, the company would likely need current revenues to be north of a trillion USD. The expectations implied by the stock price were impossible, and as a result the stock never recovered.
Figure 6: Cisco EV/S Multiple (source: Seeking Alpha)
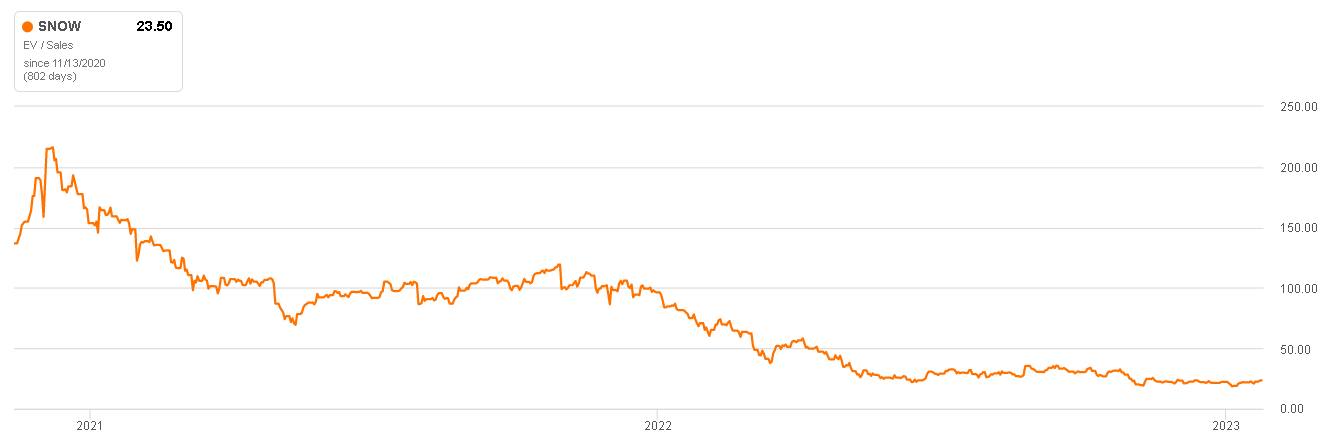
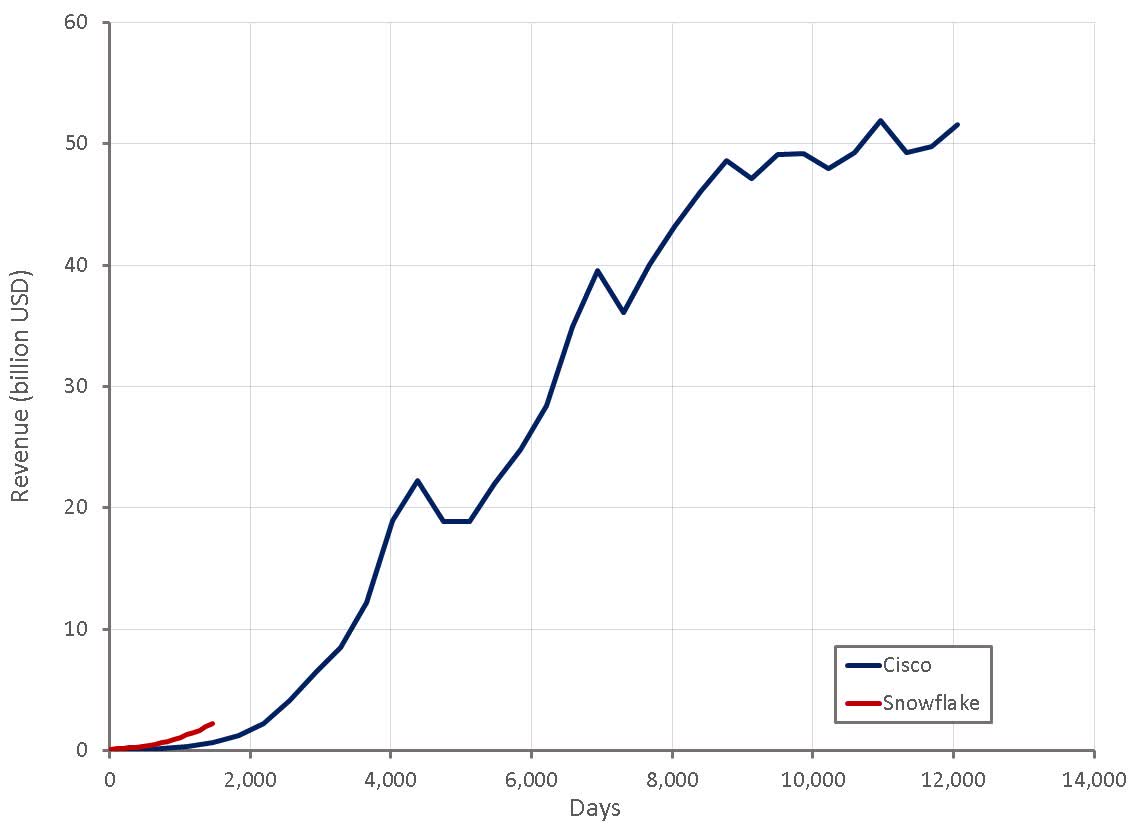
Snowflake's ( SNOW ) valuation during the pandemic could be considered a relevant comparison. While Snowflake's valuation appears more extreme than Cisco's were during the tech bubble, the business performance implied by Snowflake's share price is far more likely to be achieved. Not that I'm suggesting that Snowflake was reasonably priced at the time. For Snowflake investors to do well from the pandemic peak, the company will likely eventually need revenues above 100 billion USD annually, a large ask for any company. The point is that any comparison with Cisco should recognize that the company was already mature during the tech boom and growth was inevitably going to decline significantly. Companies like Snowflake are barely beginning to penetrate their core markets and have yet to really explore opportunities in adjacent markets.
Figure 7: Snowflake EV/S Multiple (source: Seeking Alpha) Figure 8: Cisco and Snowflake Revenue (source: Created by author using data from company reports)
Comparisons of the 2000s tech bubble and the pandemic growth stock bubble have their limitations. Stock prices during the pandemic were driven as much by extremely loose monetary policy as much as they were by unrealistic growth expectations. Prices have corrected to the point that many growth stocks are now beginning to look attractive from a valuation perspective, but short-term performance is likely to be dictated by whether there is a recession or not.
For further details see:
2000 And 2020: The Differences Are As Important As The Similarities For Tech Stocks